Chapter 22
COST-VOLUME-PROFIT
CHAPTER LEARNING OBJECTIVES
After studying this chapter, you should be able to:
1. Distinguish between variable and fixed costs.
2. Explain the significance of the relevant range.
3. Explain the concept of mixed costs.
4. List the five components of cost-volume-profit analysis.
5. Indicate what contribution margin is and how it can be expressed.
6. Identify the three ways to determine the break-even point.
7. Give the formulas for determining sales required to earn target net income.
8. Define margin of safety, and give the formulas for computing it.
9. Describe the essential features of a cost-volume-profit income statement.
*10. Explain the difference between absorption costing and variable costing.
*Note: All asterisked (*) items relate to material contained in the Appendix to the chapter.
![]()
PREVIEW OF CHAPTER 22
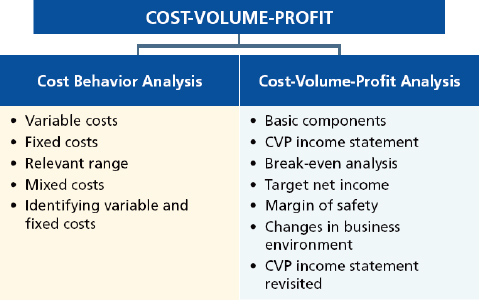
Management must understand how costs respond to changes in sales volume and the effect of the interaction of costs and revenues on profits. A prerequisite to understanding cost-volume-profit (CVP) relationships is knowledge of how costs behave. In this chapter, we first explain the considerations involved in cost behavior analysis. Then we discuss and illustrate CVP analysis and variable costing. The content and organization of the chapter are as follows:
![]()
CHAPTER REVIEW
- Cost behavior analysis is the study of how specific costs respond to changes in the level of business activity. A knowledge of cost behavior helps management plan operations and decide between alternative courses of action.
- The activity index identifies the activity that causes changes in the behavior of costs; examples include direct labor hours, sales dollars, and units of output. Once an appropriate activity index is chosen, costs can be classified as variable, fixed or mixed.
Variable and Fixed Costs
3. (L.O. 1) Variable costs are costs that vary in total directly and proportionately with changes in the activity level. Examples of variable costs include direct materials and direct labor, cost of goods sold, sales commissions, and freight-out. A variable cost may also be defined as a cost that remains the same per unit at every level of activity.
4. Fixed costs are costs that remain the same in total regardless of changes in the activity level. Examples include property taxes, insurance, rent, supervisory salaries, and depreciation. Fixed costs per unit vary inversely with activity; as volume increases, unit cost declines and vice versa.
Relevant Range
5. (L.O. 2) The range over which a company expects to operate during the year is called the relevant range. Within the relevant range a straight-line relationship exists for both variable and fixed costs.
Mixed Costs
6. (L.O. 3) Mixed costs are costs that contain both a variable element and a fixed element; they increase in total as the activity level increases, but not proportionately. For purposes of CVP analysis, mixed costs must be classified into their fixed and variable elements.
7. The high-low method uses the total costs incurred at the high and low levels of activity. The difference in costs represents variable costs, since only the variable cost element can change as activity levels change.
8. The steps in computing fixed and variable costs under the high-low method are:
a. Determine variable cost per unit from the following formula:
![]()
b. Determine the fixed cost by subtracting the total variable cost at either the high or the low activity level from the total cost at that activity level.
9. (L.O. 4) Cost-volume-profit (CVP) analysis is the study of the effects of changes in costs and volume on a company's profits. It is a critical factor in such management decisions as profit planning, setting selling prices, determining product mix, and maximizing use of production facilities.
10. CVP analysis considers the interrelationships among the following components: (a) volume or level of activity, (b) unit selling prices, (c) variable cost per unit, (d) total fixed costs, and (e) sales mix.
Basic CVP Components
11. The following assumptions underlie each CVP analysis:
a. The behavior of both costs and revenues is linear throughout the relevant range of the activity index.
b. All costs can be classified as either variable or fixed with reasonable accuracy.
c. Changes in activity are the only factors that affect costs.
d. All units produced are sold.
e. When more than one type of product is sold, the sales mix will remain constant. That is, the percentage that each product represents of total sales will stay the same.
Contribution Margin
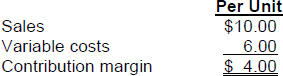
12. (L.O. 5) Contribution margin is the amount of revenue remaining after deducting variable costs. The formula for contribution margin per unit is:
![]()
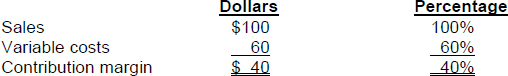
13. Contribution margin per unit indicates the amount available to cover fixed costs and contribute to income. The formula for the contribution margin ratio is:
![]()
The ratio indicates the portion of each sales dollar that is available to apply to fixed costs and to contribute to income.
Break-Even Analysis
14. (L.O. 6) The break-even point is the level of activity at which total revenue equals total costs (both fixed and variable). Knowledge of the break-even point is useful to management when it decides whether to introduce new product lines, change sales prices on established products, or enter new market areas.
15. A common equation used for CVP analysis is as follows:
Sales = Variable Costs + Fixed Costs + Net Income
16. Under the contribution margin technique, the break-even point can be computed by using either the contribution margin per unit or the contribution margin ratio.
17. The formula, using unit contribution margin, is:
![]()
18. The formula using the contribution margin is:
![]()
19. A chart (or graph) can also be used as an effective means to determine and illustrate the break-even point. A cost-volume-profit (CVP) graph is as follows:
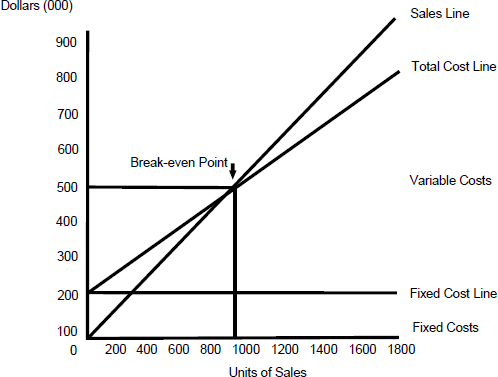
Target Net Income
20. (L.O. 7) Target net income is the income objective for individual product lines. The following equation is used to determine target net income sales:
Required Sales = Variable Costs + Fixed Costs + Target Net Income
Margin of Safety
21. (L.O. 8) Margin of safety is the difference between actual or expected sales and sales at the break-even point.
a. The formula for stating the margin of safety in dollars is:
![]()
b. The formula for determining the margin of safety ratio is:
![]()
The higher the dollars or the percentage, the greater the margin of safety.
CVP Income Statement
22. (L.O. 9) The cost-volume-profit (CVP) income statement classifies costs and expenses as variable or fixed and specifically reports contribution margin in the body of the statement.
Absorption and Variable Costing
*23. (L.O. 10) There are two approaches to product costing.
a. Under full or absorption costing all manufacturing costs are charged to the product.
b. Under variable costing, only direct materials, direct labor, and variable manufacturing overhead costs are product costs; fixed manufacturing overhead costs are recognized as period costs (expenses) when incurred.
*24. The income statement under variable costing is prepared in the cost-volume-profit format.
*25. The effects of the alternative costing methods on income from operations are:
| Circumstance | Effects on Income From Operations |
| Units produced exceed units sold | Income under absorption costing is higher than under variable costing |
| Units produced are less than units sold | Income under absorption costing is lower than under variable costing |
| Units produced equal units sold | Income will be equal under both approaches |
*26. The use of variable costing in product costing is acceptable only for internal use by management. It cannot be used in determining products costs in financial statements prepared in accordance with generally accepted accounting principles because it understates inventory costs.
![]()
![]()
REVIEW QUESTIONS AND EXERCISES
Indicate whether each of the following is true (T) or false (F) in the space provided.
![]()
MULTIPLE CHOICE
Circle the letter that best answers each of the following statements.
- (L.O. 1) Costs that vary in total directly and proportionately with changes in the activity level are:
- variable costs.
- fixed costs.
- mixed costs.
- semivariable costs.
- (L.O. 1) Fixed costs are costs that:
- remain the same in total regardless of changes in the activity level.
- vary inversely with activity on a per unit basis.
- both (a) and (b).
- neither (a) nor (b).
- (L.O. 2) Within the relevant range, the variable cost per unit:
- differs at each activity level.
- remains constant at each activity level.
- increases as production increases.
- decreases as production increases.
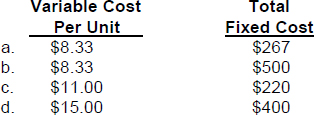
- (L.O. 3) In the Gabbana Company, maintenance costs are a mixed cost. At the low level of activity (40 direct labor hours), maintenance costs are $600. At the high level of activity (100 direct labor hours), maintenance costs are $1,100. Using the high-low method, what is the variable maintenance cost per unit and the total fixed maintenance cost?
- (L.O. 4) Which of the following is not an underlying assumption of cost-volume-profit analysis?
- All costs can be classified as either variable or fixed with reasonable accuracy.
- When more than one type of product is sold, total sales will be in a constant sales mix.
- Changes in activity and other factors affect costs.
- The behavior of both costs and revenues is linear throughout the entire range of the activity index.
- (L.O. 5) The contribution margin ratio increases when:
- fixed costs increase.
- fixed costs decrease.
- variable costs as a percentage of sales decrease.
- variable costs as a percentage of sales increase.
- (L.O. 5) The contribution margin per unit decreases when unit selling price remains the same and:
- fixed costs increase.
- fixed costs decrease.
- variable costs per unit increases.
- variable cost per unit decreases.
- (L.O. 6) A formula for break-even point in sales dollars is:
- contribution margin per unit divided by fixed costs.
- fixed costs divided by contribution margin per unit.
- contribution margin ratio divided by fixed costs.
- fixed costs divided by contribution margin ratio.
- (L.O. 6) Which of the following is correct?
- Contribution Margin Ratio ÷ Fixed Costs = Break-even in Dollars
- Fixed Costs ÷ Contribution Margin Ratio = Break-even in Dollars
- Contribution Margin Ratio ÷ Fixed Costs = Break-even in Units
- Fixed Costs ÷ Contribution Margin Ratio = Break-even in Units
- (L.O. 6) Livingston Co. has fixed costs of $60,000 and a contribution margin ratio of 30%. How much in dollar sales does Livingston Co. need to have to break-even?
- 0.
- $60,000.
- $180,000.
- $200,000.
- (L.O. 6) Dolce Company is planning to sell 400,000 hammers for $1.50 per unit. The contribution margin ratio is 20%. If Dolce will break even at this level of sales, what are the fixed costs?
- $120,000.
- $280,000.
- $400,000.
- $480,000.
- (L.O. 6) At the break-even point, fixed costs are:
- less than the contribution margin.
- equal to the contribution margin.
- more than the contribution margin.
- indeterminate of the contribution margin.
Items 13 and 14 are based on the following data for the Mizrahi Company.
Sales (50,000 units) $1,000,000, direct materials and direct labor $300,000, other variable costs $50,000, and fixed costs $130,000.
13. (L.O. 6) What is Mizrahi's break-even point in units?
a. 9,848.
b. 10,000.
c. 18,571.
d. 26,000.
14. (L.O. 6) What is Mizrahi's contribution margin ratio?
a. 66%.
b. 65%.
c. 59%.
d. 35%.
15. (L.O. 6) Versace Company is contemplating an expansion program based on expected sales $600,000, variable costs $420,000, and fixed costs $120,000. What is the amount of break-even sales?
a. $400,000.
b. $420,000.
c. $540,000.
d. $660,000.
16. (L.O. 6) Mugler Company sells radios for $50 per unit. The fixed costs are $210,000 and the variable costs are 60% of the selling price. As a result of new automated equipment, it is anticipated that fixed costs will increase by $50,000 and variable costs will be 50% of the selling price. The new break-even point in units is:
a. 10,500.
b. 10,400.
c. 10,300.
d. 8,400.
Items 17 and 18 are based on the following data:
Moschino Company sells cassette players for $60 each. Variable costs are $40 per unit, and fixed costs total $30,000.
17. (L.O. 7) How many cassette players must Moschino sell to earn net income of $70,000?
a. 5,000.
b. 3,500.
c. 2,500.
d. 1,500.
18. (L.O. 6) What sales are needed by Moschino to break even?
a. $40,000.
b. $75,000.
c. $90,000.
d. $120,000.
19. (L.O. 7) Lagerfeld Company reported the following results from the sale of 5,000 hammers in May: sales $200,000, variable costs $120,000, fixed costs $60,000, and net income $20,000. Assume that Lagerfeld increases the selling price of hammers by 10% on June 1. How many hammers will have to be sold in June to maintain the same level of net income?
a. 4,000.
b. 4,300.
c. 4,500.
d. 5,000.
20. (L.O. 8) Gaultier Company had actual sales of $800,000 when break-even sales were $600,000. What is the margin of safety ratio?
a. 25%.
b. 33%.
c. 67%.
d. 75%.
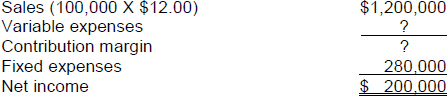
21. (L.O. 9) Givenchy Company sells 100,000 wrenches for $12.00 a unit. Fixed costs are $280,000 and net income is $200,000. What should be reported as variable expenses in the CVP income statement?
a. $480,000.
b. $720,000.
c. $900,000.
d. $920,000.
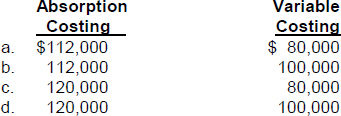
*22. (L.O. 10) In the Klein Company, 50,000 units are produced and 40,000 units are sold. Variable manufacturing costs per unit are $8 and fixed manufacturing costs are $160,000. The cost of the ending finished goods inventory under each costing approach is:
*23. (L.O. 10) When units produced are less than units sold, income under absorption costing will be:
a. higher than under variable costing.
b. the same as under variable costing.
c. lower than under variable costing.
d. indeterminate compared to variable costing.
*24. (L.O. 10) In the Hermes Company, sales are $800,000, cost of goods under absorption costing is $600,000 and total operating expenses are $120,000. If cost of goods sold is 70% variable and total operating expenses are 60% fixed, what is the contribution margin under variable costing?
a. $380,000.
b. $332,000.
c. $308,000.
d. $260,000.
*25. (L.O. 10) Variable costing is:
a. not compatible with responsibility accounting.
b. acceptable under generally accepted accounting principles.
c. acceptable for income tax purposes.
d. only acceptable for internal use by management.
![]()
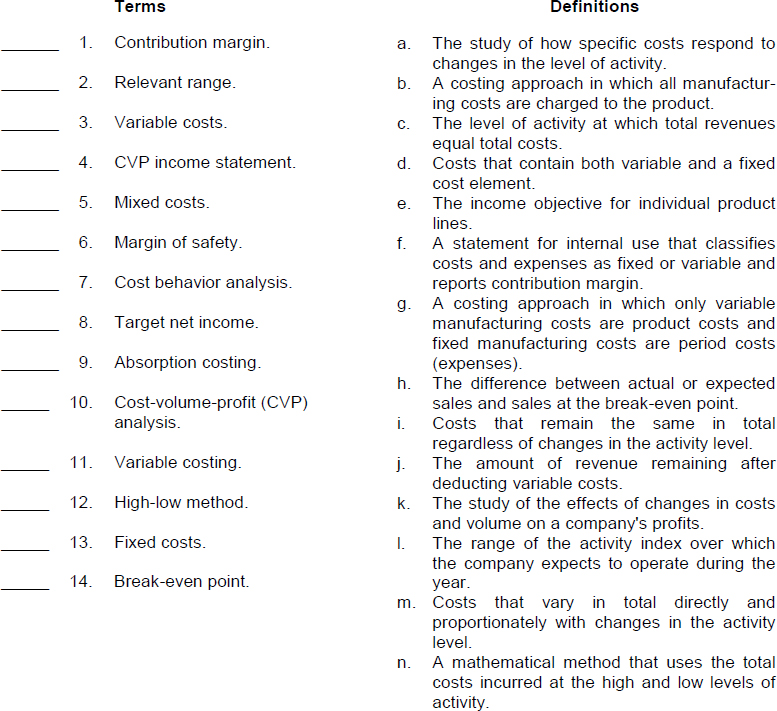
Match each term with its definition by writing the appropriate letter in the space provided.
![]()
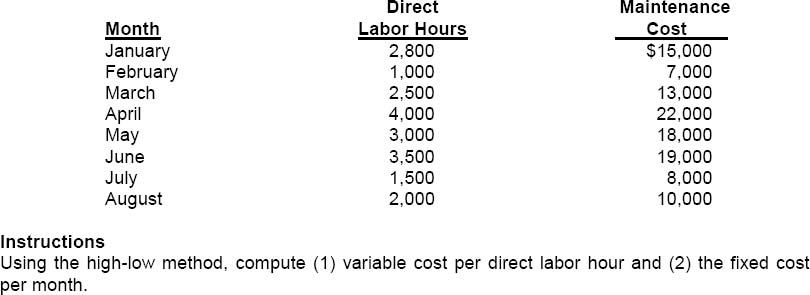
EX. 22-1 (L.O. 3) Galliano Company has accumulated the following information pertaining to maintenance costs for the last eight months.

EX. 22-2 (L.O. 5, 6, 7, and 8) Rykiel Company sells radios. For the year its revenues and costs were: sales $550,000 (11,000 units), variable costs $330,000, and fixed costs $150,000.
Instructions
(a) Compute the contribution margin per unit.
(b) Compute the contribution margin ratio.
(c) Compute the break-even point in dollars using the contribution margin ratio.
(d) Compute the break-even point in units using the unit contribution margin.
(e) Compute the number of units that must be sold to earn net income of $100,000.
(f) Compute the margin of safety ratio.


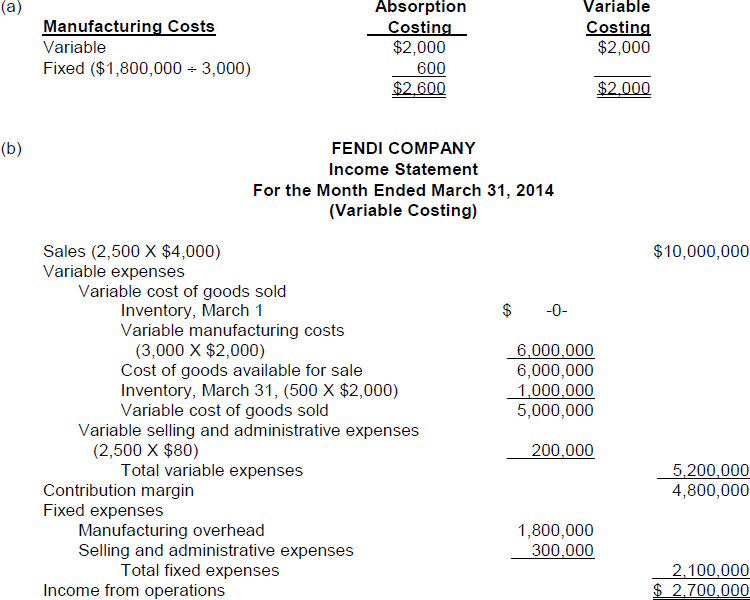
*EX. 22-3 (L.O. 10) During March of 2014, Fendi Company produced 3,000 units but only sold 2,500 units. The company had no beginning inventory. The unit selling price was $4,000. Manufacturing costs were: variable $2,000 per unit produced and fixed $1,800,000. Selling and administrative expenses were: variable $80 per unit of sales and fixed $300,000.
Instructions
(a) Compute the manufacturing cost of one unit of product using (1) absorption costing and (2) variable costing.
(b) Prepare an income statement for March using the variable costing approach.

![]()
SOLUTIONS TO REVIEW QUESTIONS AND EXERCISES
| 1. (T) | |
| 2. (F) | A variable cost remains the same per unit at every level of activity. |
| 3. (T) | |
| 4. (F) | Because of increased use of automation and less use of the work force, the trend in most companies is to have more fixed costs and fewer variable costs. |
| 5. (F) | Within the relevant range, costs are assumed to be linear. |
| 6. (F) | For most companies, operating at almost zero or 100 percent capacity is the exception rather than the rule. |
| 7. (T) | |
| 8. (T) | |
| 9. (T) | |
| 10. (F) | One assumption of CVP analysis is that changes in activity are the only factors that affect costs. |
| 11. (T) | |
| 12. (F) | The contribution margin per unit is the unit selling price less the variable costs per unit. |
| 13. (F) | The contribution margin ratio of 30% means that 30 cents of each sales dollar is available to cover fixed costs and to produce a profit. |
| 14. (T) | |
| 15. (T) | |
| 16. (T) | |
| 17. (T) | |
| 18. (T) | |
| 19. (F) | The margin of safety is the difference between actual or expected sales and sales at the break-even point. |
| 20. (T) | |
| *21. (F) | The approaches only differ concerning fixed manufacturing overhead costs which are a product cost under absorption costing and a period cost under variable costing. |
| *22. (F) | In this circumstance, income is higher under absorption costing than under variable costing. |
| *23. (T) | |
| *24. (T) |

MATCHING
- j
- l
- m
- f
- d
- h
- a
- e
- b
- k
- g
- n
- i
- c
EXERCISES
EX. 22-1
(1) Variable cost per unit is computed by dividing the change in total costs by the high minus low activity index. ($22,000 − $7,000) ÷ (4,000 − 1,000) = $5.00
(2) The fixed cost per month can be computed by subtracting the total variable cost at either activity level from the total cost at that activity level.
Low $ 7,000 − ($5.00 × 1,000) = $2,000.
High $22,000 − ($5.00 × 4,000) = $2,000.
(a) Contribution margin per unit is: $220,000 ÷ 11,000 = $20.
(b) Contribution margin ratio is: $220,000 ÷ $550,000 = 40%.
(c) The break-even point in dollars is: $150,000 ÷ .40 = $375,000.
(d) The break-even point in units is: $150,000 ÷ $20 = 7,500.
(e) The number of units to earn net income of $100,000 is: ($150,000 + $100,000) ÷ $20 = 12,500.
(f) The margin of safety is: $550,000 − $375,000 = $175,000.
The margin of safety ratio is: $175,000 ÷ $550,000 = 32% (rounded).
EX. 22-3