
Chapter 13. Performance
One aspect of working with big data is the chance to regularly exercise computer science performance theory. Desktop computers are so powerful that sometimes application developers can get away with inefficient designs without affecting performance to the extent that users notice. When you work with many terabytes of data, performance and efficient design once again become paramount.
Scalable applications that interact with large numbers of users often need to respond to requests very quickly, in under a second. Jakob Nielsen suggests acknowledging time limits that affect how users perceive an application:1
0.1 second is about the limit for having the user feel that the system is reacting instantaneously, meaning that no special feedback is necessary except to display the result.
1.0 second is about the limit for the user’s flow of thought to stay uninterrupted, even though the user will notice the delay. Normally, no special feedback is necessary during delays of more than 0.1 but less than 1.0 second, but the user does lose the feeling of operating directly on the data.
10 seconds is about the limit for keeping the user’s attention focused on the dialogue. For longer delays, users will want to perform other tasks while waiting for the computer to finish, so they should be given feedback indicating when the computer expects to be done. Feedback during the delay is especially important if the response time is likely to be highly variable, since users will then not know what to expect.
Some useful questions with regard to performance include:
-
What performance is acceptable or expected of the application?
-
What operations does the application need to perform and how much work is required to do them?
-
Can some of the work to answer queries be performed at ingest time rather than query time (precomputation)? How might this affect ingest performance?
The answers to these questions can help guide the application designer to determine how data should be processed and organized so that the required access patterns can be supported in a way that meets the performance requirements and the semantic rules of the application.
Understanding Read Performance
Application designers must understand the capabilities of the hardware and subsystems on which their application must run in order to reason about performance and develop designs to meet performance requirements. As far as understanding hardware is concerned, Google Bigtable author Jeffrey Dean compiled a list of what he called Numbers Everyone Should Know, shown in Table 13-1. Hardware performance may change as technology improves, but these are good order-of-magnitude estimates. Of those, a few are of special interest to Accumulo application developers.
Main memory reference |
0.0001 ms |
Send 2K bytes over 1 Gbps network |
0.020 ms |
Read 1 MB sequentially from memory |
0.25 ms |
Round trip within same datacenter |
0.5 ms |
Disk seek |
10 ms |
Read 1 MB sequentially from network |
10 ms |
Read 1 MB sequentially from disk |
30 ms |
To help application designers understand how using Accumulo affects application performance, it is useful to apply the information on how hardware performs to an understanding of how Accumulo operations use hardware.
Accumulo reads, or scans, involve doing some lookups in the Accumulo client’s cache, then communicating with a tablet server to read out the data requested.
One important thing to note when modeling queries is that in our earlier calculations, the number and size of key-value pairs has a linear effect on the time it takes to read data off of disk, sort it in memory, and transfer it over the network—the more data read, the longer it takes. But the total number of key-value pairs in the table has a much smaller effect. The bigger the table, the more servers it will take to store the data. When querying, however, a single scan will usually involve only one tablet server and a small number of files containing the requested data, no matter how big the table gets.
The first step—finding the right tablet server for a scan—requires doing a binary search among tablet extents stored in memory. The time to do this search grows logarithmically with the number of tablets. This means that if finding the right tablet among 100 tablets takes 5 microseconds on average, finding the right tablet when there are 1,000 tablets should only take an average of 10 microseconds, not 50. We introduce this concept in depth in “Fast Random Access”.
Sometimes the blocks referenced as part of a scan will be cached in memory already, because Accumulo employs caching of blocks read from HDFS. However, Accumulo is designed to perform fast scans even when data is not cached and does so by minimizing disk seeks. This design is crucial to scaling to handle large amounts of data in a cost-effective way, because disk is many times cheaper than memory. More information on how Accumulo works is in Chapter 10.
Of course, an application can itself reference memory, disk, other services over the network. Performing back-of-the-envelope calculations about how an application should perform is helpful in determining viable design alternatives.
Understanding Write Performance
When we talk about write performance we often address two things: throughput and latency, which are sometimes at odds. By throughput we mean writing a number of items, or mutations, over time; throughput is the rate of writes. We often seek to achieve high throughput.
Latency refers to the time between when a write is ready to be written, and when it is available for query. We often seek to achieve low latency.
Applications can write data to Accumulo in two ways: by bundling mutations into batches via the BatchWriter, or by importing files from HDFS via bulk import.
These methods allow application developers to balance throughput and latency to meet their requirements.
BatchWriters
High throughput when the BatchWriter is used depends on the ability to amortize network overhead by grouping mutations together before shipping them to tablet servers.
The BatchWriter does this by waiting for several mutations to become available so it can group them together and send them all at once.
This way, it only has to pay the network overhead for every hundred or thousand or so mutations, rather than every mutation.
Seen another way, the network cost of writing a mutation can be reduced by a hundred or a thousand times via batching.
The time the BatchWriter spends waiting to gather some number of mutations contributes to latency.
If the BatchWriter is able to gather 1,000 mutations, throughput will be higher, but latency will also be higher.
Applications can choose therefore to configure the BatchWriter to send smaller batches of mutations more frequently so that latency is kept low.
This configuration allows applications to choose where they want to reside in the spectrum between high throughput and low latency.
Applications could choose to optimize for low latency at the cost of throughput by configuring the BatchWriter to wait for only a short time to gather a batch of mutations or by explicitly calling flush() to immediately send pending mutations.
These settings are detailed in “Committing Mutations”.
Bulk Loading
An alternative to ingesting data via clients using the BatchWriter is to prepare key-value pairs into files and bulk-load them to Accumulo tables.
Using bulk loading to write data to Accumulo tables represents sliding all the way to the high-throughput end of the spectrum.
Bulk loading employs the MapReduce framework, which is optimized to process data at very high throughput. The data is only available for query after all the data has been processed and the MapReduce job completes, representing higher latency.
To understand how bulk loading works, it’s helpful to know how data for Accumulo tables is stored in HDFS. An Accumulo table consists of a set of files in HDFS and metadata describing which files belong to which tablets and which key ranges each tablet spans. When data is ingested via an Accumulo client, RFiles are created and stored in HDFS as part of the minor compaction process. After tablets are split, they can share RFiles until a major compaction process writes out a separate set of RFiles for each tablet.
Eventually, Accumulo will end up having one or a small number of RFiles for each tablet, and each RFile will only contain data for one tablet. This represents a kind of equilibrium state for Accumulo in which no more compactions are necessary.
Users who want to get data into Accumulo at a very high rate of throughput can use MapReduce to create the RFiles such that they closely resemble the set of RFiles that Accumulo would create on its own if the data were to be ingested via streaming clients.
Creating RFiles via MapReduce can be faster because a data set can be organized into the optimal set of RFiles in one MapReduce job rather than via several rounds of compaction on intermediate RFiles. The downside of bulk loading is that none of the data is available for query until the entire data set is done being processed by MapReduce. It also requires that all the data to be loaded is staged in HDFS.
Bulk loading is an option for quickly loading a large data set into Accumulo when it is possible to stage the data in HDFS and when the latency requirements are such that the data can be unavailable until the MapReduce job is complete.
“Bulk-loading files from a MapReduce job” discusses additional factors to consider when bulk loading, including how to handle key timestamps.
Hardware Selection
Accumulo is designed to run on commodity-class servers. In general, using more-expensive hardware will not dramatically improve Accumulo’s performance or reliability and in some cases will work against Accumulo’s availability features.
What do we mean by commodity class? Basically commodity here refers to servers that are widely available for a large number of uses, such as servers that can be used for serving web pages, handling email, etc. Using these general-purpose machines has several advantages. First, when architecting the first MapReduce and BigTable clusters, Google calculated2 that it would get the most compute power per dollar using this hardware:
Combining more than 15,000 commodity-class PCs with fault-tolerant software creates a solution that is more cost-effective than a comparable system built out of a smaller number of high-end servers.
Second, because these types of servers are so widely used, many vendors are competing to sell them, which helps keep prices low and provides enough demand for hardware manufacturers to keep improving performance.
Typical hardware for an Accumulo tablet server is as follows:
- CPU
-
2x 4-core or 6-core CPUs
- RAM
-
16–96 GB RAM
- Disks
-
2-12x 1–3 TB disks
- Networking
-
1-2x Gb Ethernet or 10 Gb Ethernet cards
If these servers will also be hosting TaskTrackers for running MapReduce jobs, additional RAM and or CPU cores will come in handy.
Buying hardware with many more CPU cores and much more RAM—scaling up vertically—may not result in higher performance, because a single tablet server process is limited in some ways. Accumulo is designed to scale horizontally, meaning adding more servers rather than increasing the resources of each server.
Storage Devices
Unlike some databases, Accumulo is designed to keep most of the data managed on disk. As much data as will fit is cached into RAM as data is read from disk, but even reads that request data that is not cached in RAM are designed to be fast, because Accumulo minimizes disk seeks by keeping the data organized and reading fairly large chunks at a time.
Hard disk drives
Because Accumulo relies on HDFS to distribute and replicate blocks of data, it is recommended that storage consist primarily of inexpensive hard disk drives (HDDs), such as 1–3 TB SATA 7,200–15,000 RPM drives, mounted separately (as JBOD, i.e., Just a Bunch of Disks) rather than via RAID. HDFS essentially implements a RAID-1 data redundancy scheme, replicating entire disk blocks rather than using erasure coding, so employing RAID in addition to HDFS replication is unnecessary. The upsides of keeping full replicas are that there is no recovery time when a single hard drive is lost, and any of the replicas can be used for reading the data.
Storage-area networks
Storage-area networks (SANs) are not as well suited to providing storage for Accumulo because the scaling, independence, and failure characteristics are different from the shared-nothing, unreliable hardware Accumulo and HDFS are designed for. SANs provide an abstraction layer that defeats the attempts by HDFS to reason about data locality. If for some reason Accumulo must be run on a SAN, it is preferable that HDFS be configured to keep only one replica of each block, because the SAN will often provide its own replication.
Solid-state disks
Solid-state disks (SSDs) have presented an interesting development for databases in general because many databases require a high number of random-access reads and writes. SSDs provide a much higher number of random reads per second because there is no disk platter to rotate as with HDDs. However, because Accumulo is designed to reduce seeks by performing sequential disk accesses as much as possible, the advantages of SSDs over HDDs are not as pronounced with Accumulo as they would be with databases that perform a high number of seeks per user request. SSDs may work well in an environment where the ratio of the read request rate to the total stored data is very high, such as 25,000 random reads per second per terabyte of data.
One fact to keep in mind when considering databases to use with SSDs is that random writes can exacerbate an effect known as write amplification. Write amplification refers to the case when a single write from an application perspective can result in more physical writes as the SSD attempts to find or create an empty spot in which to write the data. Accumulo’s write patterns, which are append-only and sequential, should result in a minimal level of write amplification.
Networking
Accumulo is a networked application and its storage layer, HDFS, is a networked file system. Clients connect directly to tablet servers to read and write data. Tablet servers will try to read data from local disks when possible, avoiding reading data across the network, but will also often end up reading blocks of data from an HDFS DataNode over the network.
Having enough network bandwidth is fairly important to Accumulo. Even data read from disks local to a tablet server must still be transferred over the network to clients on other machines. For most clusters, servers with one or two 1-Gb Ethernet cards are sufficient. If there is more than one network interface card (NIC), they should be bonded in Linux to improve performance and availability. Currently Hadoop cannot utilize more than one NIC. Many clusters’ networks consist of a 10 Gb switch atop each rack of servers and a 10 Gb switch connecting a row of racks together.
Virtualization
Accumulo can be run on virtualized hardware, with a few caveats. HDFS makes some assumptions about the physical location of data in order to achieve good performance. If the virtual environment supports access to local disks, then these assumptions can remain valid. If, however, the physical storage of data is abstracted away onto remote media, the efforts by HDFS to reduce network I/O will be pointless. This may or may not be a problem, depending on the total I/O available.
Another consideration is server responsiveness. Accumulo continually attempts to determine the status of its processes. If server response time is highly variable due to unpredictable access to underlying physical resources, Accumulo’s timeouts may need to be increased to avoid dropping servers that are alive but don’t respond quickly enough. This increases the time that data may be unavailable before Accumulo recovers from a true server failure.
Finally, there is the issue of independence and availability. The shared-nothing architecture Accumulo is built on relies on trying to reduce dependence among hardware components in order to minimize the effect of an individual failure so that the overall system can continue functioning. In a virtual environment, a physical failure may affect more than one virtual server if those virtual servers happen to share any hardware, which can result in less availability than one might expect from separate physical machines. If these issues can be managed, Accumulo can be run successfully in a virtual environment.
Running in a Public Cloud Environment
In Amazon’s Elastic Compute Cloud (EC2) environment, for example, it is recommended that tablet server processes be run on instances with ephemeral storage, because that allows access to local disks. Some EC2 users recommend picking the largest instance type in a family, because supposedly this means that the virtual instance resources match the physical resources and that there will be only one virtual machine on a particular physical server, which can make access to the physical hardware less variable and services more responsive.
Amazon Elastic Block Store (EBS) volumes are recommended for storing the NameNode’s data, preferably across several volumes in a RAID configuration for higher availability, but not for primary HDFS storage because this increases the interdependence between servers. Alternatively, a cluster could utilize multiple NameNodes running in a high-availability (HA) configuration using local ephemeral disk.
Amazon EC2 uses Security Groups to restrict network access to specific ports and hosts. See “Network Security” for a list of ports that must be open.
Cluster Sizing
Several factors affect how much hardware is required for a particular use of Accumulo.
The best way to gather information on cluster performance starts with gathering empirical measures. Accumulo is designed so that aggregate write and read performance scales with the number of machines participating in the cluster. The perfect theoretical limit is to scale linearly, meaning that by doubling the cluster size you get double the aggregate performance. But, as Amdahl’s Law describes, because there is some overhead in operations that can’t be parallelized, performance increases will be less than perfectly linear.
Informal testing shows that doubling the number of machines in an Accumulo cluster results in roughly an 85 percent increase in aggregate write performance. Several factors contribute to the efficiency of the performance increase seen when the cluster is doubled, including network hardware and application design.
Modeling Required Write Performance
For the purposes of cluster planning using back-of-the-envelope calculations, a good practice is to prototype an application and measure the performance against a single server, and then against two servers, and look for the percentage increase in read and write performance. You may have to write several gigabytes of data or more in order to test the splitting and migration properties of tables before seeing an increase in aggregate write and read rates.
Based on these rates, you can estimate the number of machines required to reach a target number of user requests to read or write application data by multiplying one or two server aggregate rates by 1.85 until the target number of requests is reached.
For example, say we needed to be able to write a million key-value pairs per second, which would allow a theoretical MapReduce job writing to Accumulo to keep up with some reporting requirements.
Testing of an application prototype on some particular hardware reveals that the single-server write rate is 120,000 key-value pairs per second. Multiplying this by 1.85, we get an estimate of 222,000 pairs per second using two servers. We continue to multiply by 1.85 until we reach 1,000,000 writes per second, doubling the number of servers in our cluster each time. At four servers we have a theoretical write rate of 760,000 key-value pairs per second. At eight servers we have a rate of 1.4 million, so we need somewhere in between four and eight servers.
A direct formula for estimating the number of servers required to reach a target write rate is as follows:
![]()
m - estimated number of machines
a - target aggregate write rate in key-value pairs per second
s - measured single server performance in key-value pairs per second
On the other hand, if you want to measure the total expected read or write rate of an existing set of servers, you can measure application performance against one or two servers and extrapolate to the size of the cluster to get the aggregate write rate.
For example, if we measure an application as being able to write 5,000 user requests per second against 1 server (where each user request translates into several key-value pairs), and we have 20 servers, we can expect to see an aggregate write rate of about 71,000 key-value pairs on 20 servers, or about 14 times the single-server write rate.
To estimate the aggregate write performance of a cluster given the number of machines and single-server performance, the following formula can be used:
![]()
a - estimated aggregate write rate in key-value pairs per second
s - measured single server write rate in key-value pairs per second
m - number of machines
Cluster Planning Example
Let’s imagine we are going to set up a Twitter clone that gets just as much traffic. Assume Twitter ingests 500 million tweets a day and each tweet is about 2,500 bytes on average. That would be about 1.25 terabytes of new data per day. Our incoming data might increase by 100 percent over the year so that by the end we’re storing 2.5 terabytes of new data per day. We need to store a year’s worth of data online and make it available for queries on this system. Data older than one year old can be deleted because it is stored on another archival system (perhaps another HDFS cluster).
So we expect to have about 685 TB of data over the course of the next year.
Estimated total volume of data
To start, knowing how much data you need to store for a particular period of time can help determine the size of your cluster. Accumulo uses Gzip compression by default. It also compresses sets of keys by using a technique called relative key encoding (see “Relative key encoding”).
These techniques can often result in a 3–4:1 compression ratio. This is convenient because HDFS replicates data by a factor of three by default. So even though HDFS will increase storage requirements by a factor of three, compression brings the amount of storage required for raw data closer to a 1:1 ratio of raw data ingested to data stored on disk.
This means that to store 1 TB of data in Accumulo you will need at least 1 TB of disk space, but usually not 3 TB. But keep in mind that this is before building any secondary index tables, which will require additional space.
For our 685 TB of original data we know we’ll need at least that much raw storage.
Types of user requests and indexes required
If your application is designed to do lookups only one way—perhaps taking advantage of a natural hierarchy in the data elements (see “Single-Table Designs”)—your data can be stored in a single table. In this case the table will likely require about as much space to store the data in an Accumulo table as the storage size of the data in the original format. If additional lookup methods are required, a secondary index table will need to be built.
Typically, a single index table will suffice for any combination of equality expressions ANDed together. Some users will want to query ranges of values in multiple fields simultaneously, which can require additional index tables. Depending on your query requirements, knowing the number and type of additional index tables can help you plan to have enough storage. See “Secondary Indexing” for details on building secondary indexes.
If users need to be able to query all fields, the uncompressed size of the terms in the index would equal that of the original data, and that doesn’t include the size of the unique identifiers that the index would use to point to the original data. Accumulo’s compression and relative-key encoding are very efficient, so the disk storage needed for a full index might not actually exceed the original data size. However, if you find your indexes are larger than you want, you may want to index only a subset of the fields.
For our example, let’s assume that our desired index size is half the size of the original data, adding 50 percent to our storage needs, bringing the total to 1,028 TB, or a little over 1 PB.
Compactions
As new data is ingested into files in HFDS, periodically Accumulo compacts multiple files into a single file to make opening and reading files simpler and faster. During the compaction process, tablet servers copy several files into one new file. The compaction process requires additional temporary storage and I/O resources. Just as with a MapReduce cluster, an Accumulo cluster will need some free space in which to operate. Let’s estimate that 20 percent more storage is required for this purpose.
This increases the total to 1,234 TB.
Rate of incoming data
We’ve estimated the storage required to hold the initial data and the data added each day. To store the data in additional secondary indexes, and to perform compactions, the number of servers we’ll need depends on the amount of storage per machine. Modern servers can support 12 or more disks. At 3 TB per disk, a single server can store 36 TB or more. If we buy 2 TB hard drives and can fit 12 drives into each server, in addition to the disks used to support the operating system, we’ll eventually need about 52 servers for our 1,234 TB of total data.
But maxing out the storage per server may not be adequate to support the ingest rate of the data. Ingestion depends on having not only enough raw storage, but also enough compute capacity and I/O to sort and manage the data. Let’s calculate how many servers are needed to support the ingest rate we require.
For key-value pairs that are about 1 KB in size, a single tablet server on typical hardware can ingest 30,000–100,000 key-value pairs per second or more, depending on the number of CPU cores, the number of drives, the size of the key-value pairs, and how Accumulo is configured. See “Tablet Server Tuning” for information on tuning Accumulo for high ingest rates.
You will also have to adjust the number of ingest processes to achieve the best throughput for your system; a single ingest client may not be able to push Accumulo’s tablet servers to their highest possible ingest rate.
As the size of the cluster increases, the per-server rate will drop somewhat, simply because clients are forced to split their batches over more and more servers, which increases network overhead. Informal testing indicates that you can increase the aggregate write rate of a cluster by about 85 percent when the cluster hardware is doubled.
Let’s estimate how many servers will be needed to support our initial rate of 500 million tweets per day.
Each tweet has about 30 fields. Let’s imagine that on average about half of those are empty. Just to ingest the data we will be writing 15 x 500 million = 7.5 billion key-value pairs per day, if we store each field as a separate key-value pair in a common row. If we index 10 fields per tweet, including a separate entry for each word of text in the tweet, on average say 15 words, that’s roughly another 25 x 500 million = 12.5 billion key-value pairs.
So we’ll need to be able to ingest 20 billion key-value pairs per day if we write 40 key-value pairs per tweet. That’s an average of 231,500 key-value pairs per second.
Using the formula from “Modeling Required Write Performance” we’ll need between 3 and 14 servers to get started, depending on whether our per-server write performance is 100,000 or 30,000 writes per second, respectively. If the data arrives nonuniformly throughout the day, and peaks at, say, 2 p.m. at two times the average, we’ll need as many as 8 of the higher-end servers to handle peak load. To handle a peak as high as 140,000 tweets per second, we might need as many as 192 servers.
If we want to store 1,234 TB by the end of the year, we’ll need to add a new server every seven days. If we only buy 10 servers to start with, we’ll have to buy more in less than three months.
If we buy half the cluster today, that’s 26 machines. We may want to do this, because in six months hardware may be slightly improved and we can get the best performance per dollar.
Age-off strategy
The final consideration in our exercise is how we plan to age-off the data. Aging off old data can reduce our total storage requirements.
We can use Accumulo’s AgeOffIterator to automatically remove key-value pairs that are over a year old. Accumulo’s files are immutable, so to do this we need to make sure we compact the tables periodically to create new files in which the old data is absent, and that we garbage-collect the old files.
This will cause all files to be processed and iterators, such as the AgeOffIterator, to be applied in the creation of new files.
See “Data Lifecycle” for more on managing the data lifecycle.
Analyzing Performance
Accumulo is designed to support high rates of ingest and fast reads across a large number of servers and a large number of user requests. Applications that are designed properly can take advantage of these features, and analyzing performance will reveal whether any design decisions need to be changed.
Using Tracing
Detailed timing information on what Accumulo is doing behind the scenes can be obtained by enabling a process called tracing. Tracing is generally only turned on temporarily while analyzing an application’s behavior, because it increases the load on Accumulo by generating data that is stored in an Accumulo trace table.
Traces can be enabled programmatically in Java or in the Accumulo shell.
The Java client code is in the accumulo-core module under org.apache.accumulo.core.trace.
Here is an example that uses tracing in Java:
DistributedTrace.enable(instance,zooReader,hostname,"someApplication");TracescanTrace=Trace.on("descriptiveString");BatchScannerscanner=conn.createBatchScanner(...);for(Entry<Key,Value>entry:scanner){...}longtraceId=Trace.currentTrace().traceId();Trace.off();
After running the trace in Java, you can either go to the Recent Traces in the monitor page or scan the trace table directory using the traceId as the row ID:
user@accumulo> scan -t trace -r traceId
Note that the trace table has the org.apache.accumulo.core.trace.TraceFormatter class configured, so the output will be more readable.
Here is an example in the shell, which returns tracing information after a pause when tracing is turned off. You can still use the monitor page or scan the trace table directly to retrieve the tracing information:
user@accumulo> trace on
user@accumulo> scan -t tablename -r rowId
user@accumulo> trace off
Waiting for trace information
Waiting for trace information
Time  Start  Service@Location       Name
 5469+0      shell@hostname shell:root
    1+5        tserver@localhost listLocalUsers
    1+2667     shell@hostname client:getTableConfiguration
    1+2674     tserver@localhost getTableConfiguration
    1+2679     tserver@localhost getTableConfiguration
    1+2686     shell@hostname client:getUserAuthorizations
   82+2723     shell@hostname scan
   41+2723       shell@hostname scan:locateTablet
    3+2743         shell@hostname client:startScan
    2+2746         tserver@localhost startScan
    2+2761         tserver@localhost startScan
    1+2761           tserver@localhost metadata tablets read ahead 4
   41+2764       shell@hostname scan:location
   39+2765         tserver@localhost startScan
   37+2766           tserver@localhost tablet read ahead 9
    1+2767             tserver@localhost open
The time column of numbers shows the length of a particular operation in milliseconds, and the start column shows how many milliseconds elapsed between the start of the entire trace and the start of a particular operation. Note that operations are nested so that the time number for one operation is greater than the sum of the times taken by the operations it initiates, i.e., those nested under it. The nesting is shown by indentation. Tracing is useful for finding operations that are taking longer than expected.
Using the Monitor
The Accumulo monitor is a convenient way to see metrics of cluster performance and diagnose problems. The monitor page shows several graphs of interest to performance analyses. Application designers can check these to see what kind of aggregate performance an application is achieving, and to verify how an application will scale when run against an increasing number of servers. For these graphs to be used effectively, estimates for the theoretical performance of individual hardware components must be known, or else any comparison to empirical performance numbers is meaningless.
In particular, looking at the aggregate ingest rate (Figure 13-1) and aggregate number of scans (Figure 13-2) will provide a good notion of how busy the cluster is.

Figure 13-1. Aggregate ingest rate in key-value pairs per second
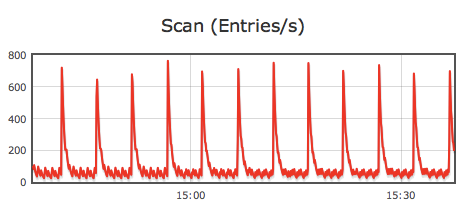
Figure 13-2. Aggregate scan rate in key-value pairs per second
Next most useful are the graphs describing the raw amount of data written or read, in megabytes (Figure 13-3 and Figure 13-4).

Figure 13-3. Aggregate ingest rate in megabytes of data per second

Figure 13-4. Aggregate scan rate in megabytes of data per second
Monitoring CPU load can also be useful in determining how busy the cluster is (Figure 13-5).

Figure 13-5. Aggregate CPU load
Looking at caching information in the graphs at the bottom of the list is useful for seeing whether index or block caching is having the desired effect (Figure 13-6 and Figure 13-7).

Figure 13-6. Number of index block cache misses (i.e., when Accumulo has to read an index block from HDFS)
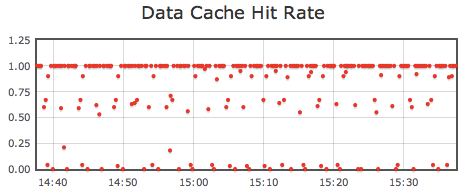
Figure 13-7. Number of data block cache misses (i.e., when Accumulo has to read a data block from HDFS)
In addition, you can measure the number of items that are being processed by Accumulo clients, which may be converting individual user requests into several key-value pairs. Knowing how to convert the number of user write or read requests into the number of key-value pairs or megabytes of data read and written will help verify that the cluster is performing optimally.
For example, if every user request to write a record of application data involves writing the original record as one key-value pair to one table, and several key-value pairs for index entries of individual fields in the record, the ratio of application records to key-value pairs written may be 1 to 10 or more.
Getting familiar with these metrics will help in reasoning about performance and tuning decisions discussed in the next few sections.
We cover the types of exceptions that Accumulo applications can expect and some ways to handle them in “Handling Errors”. When you troubleshoot an application, it is also important to be able to get information on the health of the tablet servers and master in order to determine whether the application is doing something wrong or simply experiencing issues due to hardware problems or misconfiguration.
Tablet servers forward log messages of severity WARN and above to the Accumulo monitor that displays them in one convenient location (Figure 13-8).
Checking these logs can be helpful if a failure occurs within a tablet server.
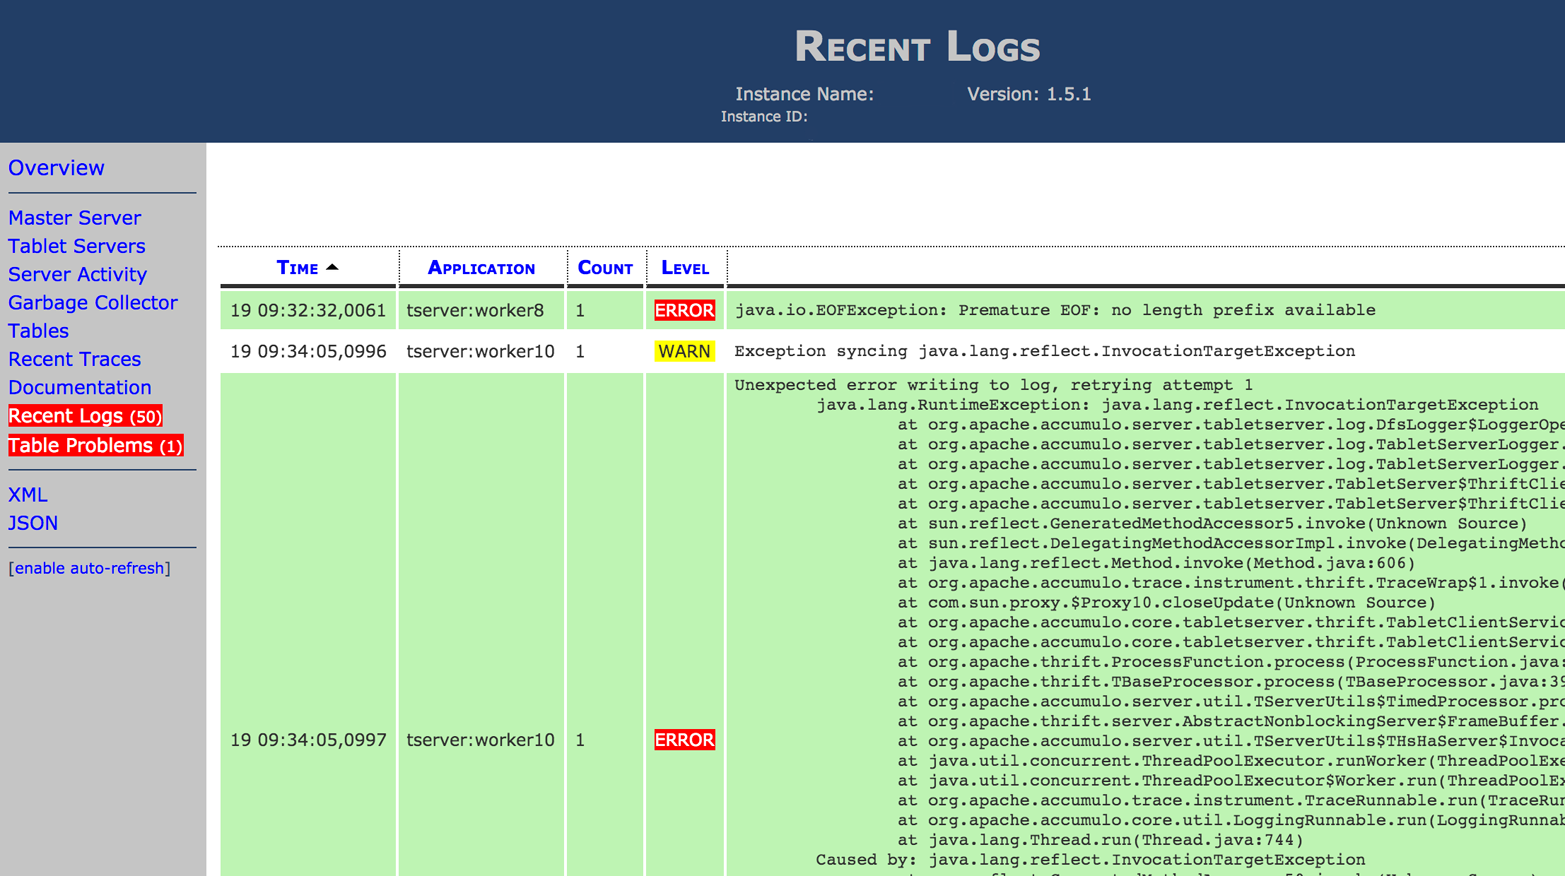
Figure 13-8. Logs in monitor
When you are for hotspots, viewing the page of the monitor that shows the amount of data written or read per server is useful (Figure 13-9). If one or two servers are handling the majority of the reads and writes, versus roughly the same number of reads or writes across most of the servers, it may indicate a hotspot.

Figure 13-9. Server statistics
Further drilling down into the individual tablets hosted by a server can reveal the range of keys that reads and writes are using (Figure 13-10).
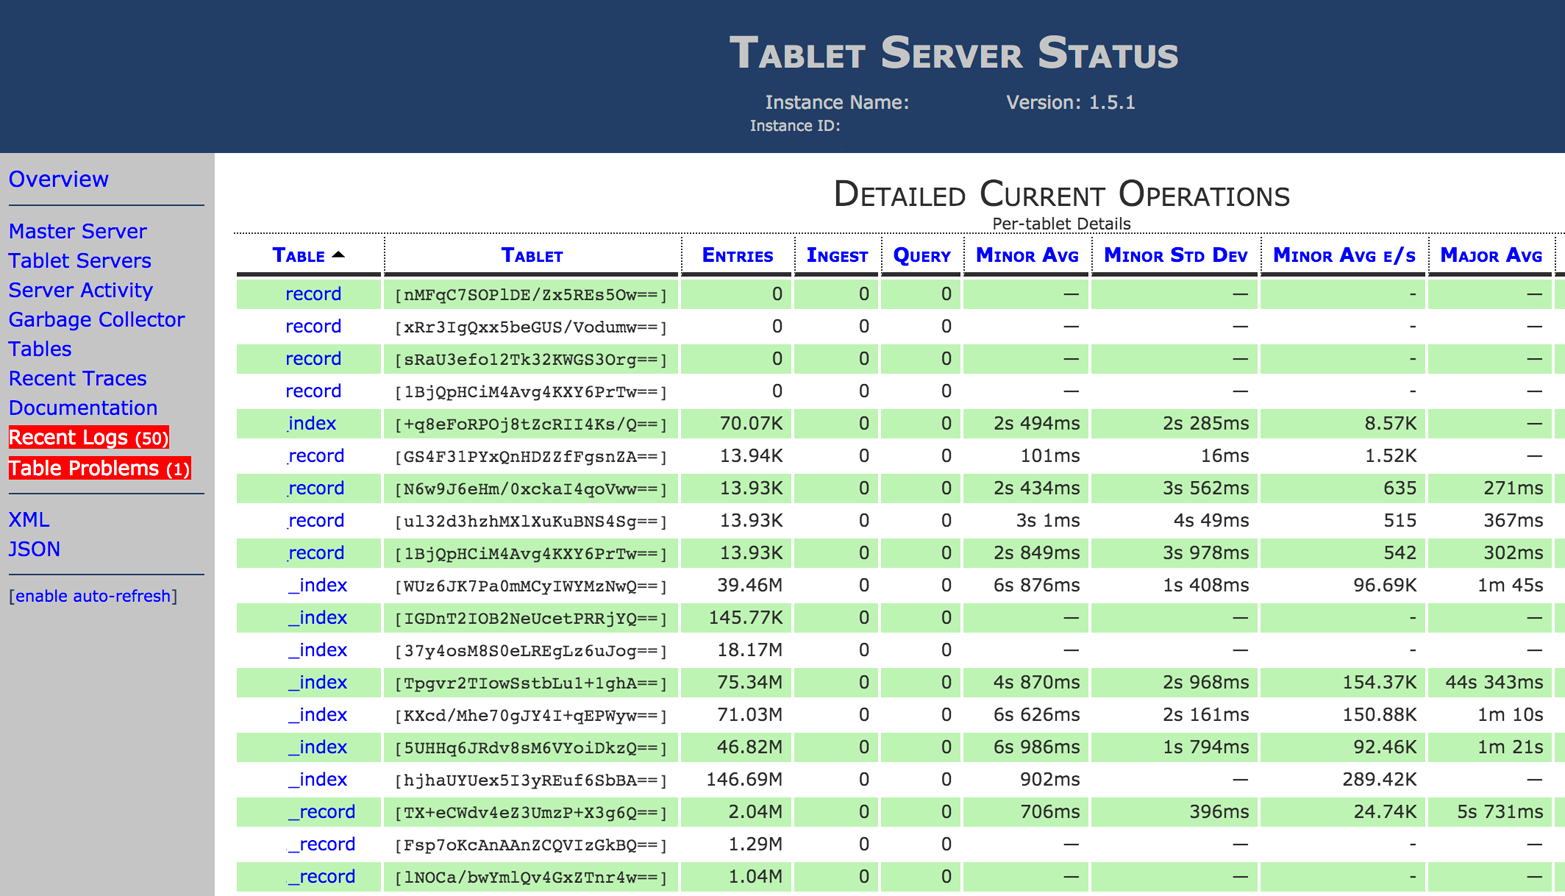
Figure 13-10. Tablet statistics
A hotspot in a particular range of keys can be a feature of some external data being loaded, over which the application has no control, or it can be the result of a deliberate key design.
In the former case, application designers can consider transforming external data into a set of keys that avoids hotspots by using techniques described in “Avoiding Hotspots”.
For more tips on troubleshooting, see “Troubleshooting”.
Using Local Logs
In addition to forwarding WARN and ERROR level messages to the monitor, tablet servers write to several logfiles on the local machine, which can include log messages of lower severity that may be useful for debugging.
These are typically found in either $ACCUMULO_HOME/logs or /var/log/accumulo.
See “Logging” for details on configuring logs.
Tablet Server Tuning
Tablet servers are multithreaded and will take advantage of multiple cores on a server. Additional tuning should be done according to the particular hardware on which tablet servers will run and what other processes are present.
We discuss table-specific properties in depth in “Configuring Table Properties” for tuning table behavior. Here we address remaining properties that are specific to tablet server operations.
External Settings
A number of settings external to Accumulo must be configured for Accumulo to work properly. In addition to the settings described in “Kernel Tweaks” and “Software Dependencies”, the following are some settings to examine when you are tuning for performance.
HDFS threads used to transfer data
Depending on your version of HDFS, you may or may not need to increase the number of threads that can be used to transfer data.
If the version you are using has the dfs.datanode.max.transfer.threads property, which defaults to 4096, you do not need to adjust it.
If HDFS is still using dfs.datanode.max.xcievers, its value should be increased to 4096:
<property><name>dfs.datanode.max.xcievers</name><value>4096</value></property>
HDFS durable sync
For Accumulo 1.5 and later, HDFS durable sync must be enabled because Accumulo uses HDFS for its write-ahead log.
Older versions of Hadoop may need dfs.support.append set to true, but newer versions default dfs.durable.sync to true, so that value merely needs to remain unchanged.
In newer versions of Hadoop, the dfs.datanode.synconclose property should also be set to true to ensure that data in Accumulo RFiles is synced to disk when the files are closed.
In older versions of Hadoop:
<property><name>dfs.support.append</name><value>true</value></property>
In newer versions:
<property><name>dfs.durable.sync</name><value>true</value></property><property><name>dfs.datanode.synconclose</name><value>true</value></property>
Memory Settings
Tablet servers are designed to serve data from disk efficiently, but they are also designed to use memory to optimize reads and writes as much as possible. Memory settings are among those that have the most significant performance impact. There are a few things to consider when configuring the amount of memory dedicated to various components of tablet servers.
tserver.memory.maps.max
The in-memory map is where new writes are stored and sorted in memory, in addition to be written to disk in a write-ahead log, until they are flushed to disk in a minor compaction.
The amount of memory that each tablet server reserves for in-memory maps is controlled via the tserver.memory.maps.max setting, and increasing this can improve write speed and decrease the number of individual compactions.
Memory is divided among all tablets actively receiving writes on the same tablet server, so this property may need to be increased significantly to have a noticeable effect.
If the in-memory map size is increased, the number of write-ahead logfiles should also be adjusted.
When a tablet has a given number of write-ahead logs, it will automatically be flushed, even if memory is not full.
So, the number of write-ahead logs (table.compaction.minor.logs.threshold) times the size of each log (tserver.walog.max.size) should be at least as big as the amount of memory given for in-memory maps (tserver.memory.maps.max):
table.compaction.minor.logs.threshold×tserver.walog.max.size≥tserver.memory.maps.max
For example, if we are setting tserver.memory.maps.max to 12GB, and tserver.walog.max.size is set to 4GB, we would want to increase table.compaction.minor.logs.threshold to be greater than 3.
Increasing the size of the write-ahead logs via tserver.walog.max.size can cause recovery to take longer and should be done with caution.
tserver.memory.maps.native.enabled
In all but trivial testing systems, native in-memory maps should be built, if necessary, and enabled by leaving the tserver.memory.maps.native.enabled property set to true.
See “Building native libraries” for details on building native maps.
To ensure that native in-memory maps are being used, make sure the libraries exist in $ACCUMULO_HOME/lib/native.
If not, they can be built by running the make command in $ACCUMULO_HOME/server/src/main/c++/.
At startup time, tablet server logs in $ACCUMULO_HOME/logs/tserver*.log will show whether native maps are enabled:
[server.Accumulo] INFO : tserver.memory.maps.native.enabled = true
And whether they were not found:
[tabletserver.NativeMap] ERROR: Failed to load native map library ..
Cache settings
In general, more memory dedicated to caches will provide better query performance.
However, Java garbage collection may then take longer to reclaim memory from objects no longer in use, decreasing tablet server responsiveness and interfering with ZooKeeper’s attempts to determine server online status.
The cache size properties are tserver.cache.index.size and tserver.cache.data.size and they govern the amount of memory used to cache RFile index blocks and RFile data blocks, respectively.
Ideally, the index cache size should be chosen so that all index blocks for the tablets hosted by a tablet server fit in memory. To estimate this size, the number of files per tablet and tablets per tablet server must be determined, as well as the average index size per file (see “Inspect RFiles” for information on inspecting individual RFiles).
Any amount of memory dedicated to the data cache will be utilized, so its size can be made as large as makes sense for your application and your hardware. The more memory that can be used to hold data blocks in the data cache, the greater the number of disk accesses that can be avoided when Accumulo fetches key-value pairs that were recently accessed or key-value pairs that are sorted close together in a tablet to recently accessed data.
Java heap size
The tablet server heap size is an environment variable, ACCUMULO_TSERVER_OPTS, set in the accumulo-env.sh file.
It should be large enough to cover the total size given to caches, plus some overhead.
If native maps are not enabled (which is not recommended), the heap size must also include the size of the in-memory maps.
Tablet servers will error out if the memory allocation does not add up when native maps are turned off.
The in-memory maps and caches are not the only things the tablet server stores in memory, but they are generally the values that are tuned larger when there is more memory available, and their values therefore are potentially the largest contributors to a tablet server’s memory usage.
Tip
Processes other than the tablet server only need sufficient memory to operate and don’t benefit from increased memory. A potential exception is the Accumulo garbage collector. If you have a lot of tablets, files, and servers, making the garbage collection memory allocation larger will keep collection efficient. If it can’t keep the list of all files that are candidates for deletion in memory, it has to use multiple passes to reclaim files.
tserver.mutation.queue.max
This is the number of bytes of write-ahead log data to store in memory before it is flushed to disk.
Setting the value too low reduces Accumulo’s throughput, but setting it too high can result in memory exhaustion if there are many concurrent writers.
Values of 2M or 4M may be reasonable. (See the ACCUMULO-1905 and ACCUMULO-1950 Jira pages for a more detailed analysis.)
Additional settings are listed in Table 13-2.
Setting |
Description |
tserver.default.blocksize |
Size of blocks used in caches |
tserver.dir.memdump |
Local directory to store temporary files used by long-running scans. If an in-memory map is ready to be deleted (its contents having been flushed in HDFS in a minor compaction) but is still being used by a long-running scan, a copy of the data needed by the scan will be stored on a local disk until it is no longer needed. This allows the memory to be freed sooner. |
tserver.memory.manager |
Implementation of memory manager; default is |
tserver.server.message.size.max |
Maximum allowable message size a tablet server will accept |
tserver.sort.buffer.size |
Amount of memory to use when sorting write-ahead logs for recovery |
Write-Ahead Log Settings
The write-ahead log currently limits the speed of writes via the BatchWriter because all mutations must be committed in an append-only fashion to the write-ahead log in order to be considered successful.
Therefore, tuning the write-ahead log settings is usually worth the effort.
The following are the settings that impact performance the most:
tserver.wal.replication
Write-ahead logs are stored in HDFS as of Accumulo version 1.5, and as such they are replicated for availability should a server fail. By default, write-ahead logs are replicated according to the default policy set for HDFS in $HADOOP_HOME/conf/hdfs-site.xml, but this setting can be overridden for tablet servers in general and specific tables as well.
Reducing the number of replicas for write-ahead logs can increase performance when safety demands allow.
tserver.wal.sync
By default in Accumulo 1.6, tablet servers are configured to use the SYNC_BLOCK flag when closing blocks written to write-ahead logs.
In addition, the sync method is called on the underlying filesystem when data is written to a write-ahead log.
The particular sync method called depends on the tserver.wal.sync.method in Accumulo 1.6.1 and newer.
tserver.wal.sync.method
When tserver.wal.sync is used as just described, this setting controls the particular sync method used.
The default is hsync, which waits until writes are completed to disk.
Using the hsync method prevents the loss of data in Accumulo tables even in the event of a sudden power outage.
In environments where uninterruptible power supplies are applied to allow systems to be shut down gracefully in the event of a power outage, this setting can be set to hflush, which does not wait.
Using hflush can result in up to a 30 percent increase in write performance.
Note that this setting is only in Accumulo version 1.6.1 and newer.
Table 13-3 contains additional write-ahead log settings.
Setting |
Description |
tserver.archive.walogs |
Controls whether to keep copies of write-ahead logs for debugging purposes. |
tserver.wal.blocksize |
Size of HDFS block used for write-ahead logs. |
tserver.walog.max.size |
Maximum size for each write-ahead log. Related to |
Resource Settings
Tablet servers use system resources to respond to client requests and to perform background operations. These resources include open files, threads, and memory. We discuss memory settings specifically in “Memory Settings”.
The following is a list of settings that control the number of threads dedicated to various tasks. Consider adjusting one of these upward if the particular operation associated appears to be lagging and system resources allow. Changing the number of resources allocated to one activity may require reducing resources allocated to other activities.
tserver.compaction.major.concurrent.max
This setting controls the maximum number of concurrent major compactions that a tablet server will carry out. Because major compactions involve reading multiple files and writing out one new merged file, this setting can impact overall I/O usage. If resources allow and major compactions appear to be queueing up in the tablet server view of the monitor, this setting can be increased.
tserver.readahead.concurrent.max
This limits the number of long-running scans a tablet server will support concurrently.
Additional resources settings are listed in Table 13-4.
Setting |
Description |
tserver.bloom.load.concurrent.max |
Threads used to load bloom filters in the background |
tserver.bulk.assign.threads |
Threads used to communicate with other servers during bulk loading |
tserver.bulk.process.threads |
Threads used to process files for bulk loading |
tserver.compaction.major.thread.files.open.max |
Number of files that can be opened during major compactions |
tserver.recovery.concurrent.max |
Threads used for sorting logs during recovery |
tserver.scan.files.open.max |
Maximum number of open file handles that can be used for scans |
tserver.server.threads.minimum |
Minimum number of threads for handling requests |
tserver.workq.threads |
Threads used for copying failed bulk loading files |
tserver.metadata.readahead.concurrent.max |
Number of metadata scans that can execute |
tserver.migrations.concurrent.max |
Number of concurrent allowed tablet migrations |
tserver.tablet.split.midpoint.files.max |
Number of index files to open when looking for a midpoint at which to split a tablet |
tserver.monitor.fs |
Whether to monitor local filesystems and exit on detecting failure |
Timeouts
Tablet servers keep resources around for certain periods of time to allow tasks to reuse them and avoid the overhead of setting up resources anew. These settings control how aggressively tablet servers reclaim those resources. Some of them are used to control how long to wait before determining a failure.
Timeout settings are listed in Table 13-5.
Setting |
Description |
tserver.bulk.retry.max |
Times a server will try to assign a file to a tablet that is migrating or splitting. |
tserver.bulk.timeout |
Time to wait for a bulk loading task to complete. |
tserver.client.timeout |
Time to wait for additional scans from a client before closing a session. |
tserver.compaction.major.delay |
Time to sleep between checking whether major compaction is needed. |
tserver.compaction.warn.time |
Time before a warning is logged to note a compaction that has not made progress. |
tserver.files.open.idle |
Time that an open file is left open for future queries before being closed. |
tserver.hold.time.max |
Time to wait for functional disk I/O after memory is full before exiting. This is used to detect local failures. |
tserver.server.threadcheck.time |
Time to wait between adjustments to the thread pool. |
tserver.session.idle.max |
Time to wait before closing an idle session. |
Scaling Vertically
Adding more memory and CPU to a single server will help a single tablet server process cope with more concurrent queries and writes. Modern servers can have up to 12 or more disks, which can increase the amount of CPU and RAM required to keep those disks busy.
Write-ahead logs can become a bottleneck for ingest because tablet servers each use one, albeit replicated, write-ahead log.
If the ingest rate of a server is dominated by the time spent flushing mutations to the write-ahead log, adding more disks or CPU to each server will not increase the write rate.
Adding more RAM and increasing the tserver.mutation.queue.max and tserver.memory.maps.max will improve performance up to a point.
For this reason, it may be more cost effective to have more individual servers, each with fewer resources so that a greater portion of available disks is devoted to write-ahead logs.
This is consistent with Accumulo’s design to run well on relatively cheap servers.
On individual servers that have extensive resources, including 256 GB of RAM or more and 12 or more disks, it may be possible to improve performance by running multiple tablet server processes on a single physical server. When doing so, it is important that each tablet server listen on a separate set of network ports.
Cluster Tuning
Performance bottlenecks can occur in several places in an Accumulo application. It is important to make sure that Accumulo applications are taking advantage of all the hardware resources available and that each hardware component is being used efficiently.
Potential bottlenecks include:
- The number of clients writing or reading data
-
If not enough clients are available to ship new data to or scan data from the cluster, tablet servers will be underutilized.
- The number of tablets available
-
If not enough tablets are available, some tablet servers will be idle, neither accepting writes nor serving queries. If performance is unsatisfactory for a given table and the number of tablets the table is split into is less than the number of available tablet servers, adding additional split points or turning down the split threshold temporarily will cause there to be enough tablets for every server to have one and participate in serving requests for the table.
- The number of operations per second that a single HDFS NameNode can support
-
At very large scales, the sheer number of filesystem operations can become the bottleneck of a cluster. A single HDFS NameNode is limited to a few thousand update operations per second because each operation is synced to disk.
- The throughput of the network
-
As clusters grow, the network can become the bottleneck if it isn’t scaled up along with the number of servers. In some cases upgrading from Gigabit Ethernet to 10 Gigabit Ethernet or upgrading the switches connecting racks is required to avoid the network becoming a bottleneck.
- The distribution of keys being read from or written to in tables (hotspots)
-
Even if there are tablets on each server, it may be the case that all of the incoming keys end up going to a small number of tablets, if there are common keys that appear frequently.
- The relative amount of CPU, RAM, and hard drives available per server
-
For example, servers may have lots of CPU but not enough disks, or vice versa.
- The number of servers participating in the cluster
-
This is the ideal bottleneck. Performance of the application can be increased by adding more machines.
Cluster tuning will consist of balancing these resources relative to one another. In order to maximize reads and writes, applications should start by considering three numbers:
-
The number of tablet servers
-
The number of tablets
-
The number of client processes writing to tablet servers
Before tablet servers can all participate in servicing requests for a particular table, there have to be at least as many tablets in the table as tablet servers in order for the Accumulo master to be able to assign at least one tablet to each server.
Once each server has at least one tablet from the table to which an application wants to send a request, there must also be enough client processes available to avoid artificially limiting the aggregate read or write rate. If the theoretical limit of the tablet servers in the Accumulo cluster is 1,000,000 writes per second, and if client processes max out at 100,000 writes per second, we’ll need at least 10 client processes to reach our cluster maximum.
Once these are roughly balanced, the next things to address are the load-balancing strategy used by the master, and whether we have hotspots in our table, as described in the next few sections.
Splitting Tables
Brand new tables in Accumulo start out as a single tablet.
Accumulo automatically splits tablets when they reach a certain threshold known as the table.split.threshold setting in the tablet configuration.
We discuss performing tablet splits programmatically in “Tablet Splits”.
Here we discuss splitting tablets using the shell and additional considerations.
Some applications might be bottlenecked by the number of tablets until there are enough tablets for every tablet server to host one or more. You can choose to either wait until there is enough data ingested for the table to split automatically into the desired number of tablets, turn down the split threshold temporarily to cause automatic splits to happen sooner, or presplit the table using a set of known split points.
Lowering the split threshold temporarily has the advantage of allowing Accumulo to still pick the split points uniformly, no matter what kind of distribution of keys exists within a table. This still assumes that the splits that will occur on the initial amount of data ingested are representative of the split points that would have been chosen after all the data is ingested. For example, if we are importing a list of users that has been sorted alphabetically, the initial split points will only occur within the first few letters of the alphabet and will not be representative of how the data would be split after the entire list is imported. Users can try to obtain a representative sample of their data for the purpose of ingesting it and allowing Accumulo to find good split points early.
To lower the split threshold for a table, users can configure the table in the shell like this:
config -t tableName -s table.split.threshold=1G
Tip
If your application has a table with a small amount of data, consider splitting it as well. Such tables could be filled with lookup information, or generated from another part of your application, and so on. If these tables are on one tablet server, the application is not taking advantage of Accumulo’s distributed abilities and may be creating artificial hotspots.
One way to split a small table is the break the range up in one part for every node in your cluster that hosts tablet servers. This may not distribute it very well if data is not evenly distributed by row ID.
Another way is to compact the table and look at the size of the current RFile.
Then in the table config, set table.split.threshold roughly equal to the RFile size divided by the number of tablet servers.
Wait until tablet servers have created the desired number of splits.
Be sure to set the table.split.threshold back to the original value afterward.
Rather than lowering the split threshold, users can submit a list of split points to Accumulo to use to create multiple tablets. The advantage of this is that the table will be distributed onto more servers before any data is ingested. The onus of picking good split points rests with the user.
To presplit a table from a list of points, the split points should first be put into a text file, with one point per line. For example:
e
j
o
t
Adding these split points to a single-tablet table would result in five tablets: (-infinity, e], (e, j], (j, o], (o, t], and lastly (t, infinity) (Figure 13-11). The special tablet with end point at infinity exists for every table and is called the default tablet.
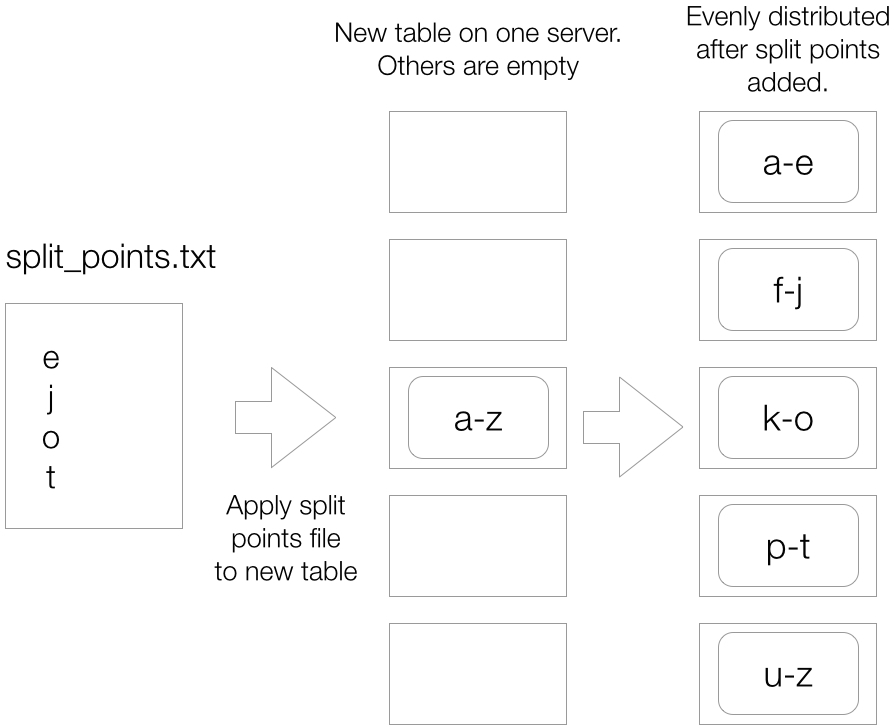
Figure 13-11. Adding split points
Then the split points file can be submitted to Accumulo for splitting via the shell:
user@accumulo> addsplits -t tableName -sf fileName
A file with split points can also be provided when first creating a table through the shell. To copy the split points from an existing table, use:
user@accumulo> createtable myPreSplitTable --copy-splits existingTable
To use a file do the following:
user@accumulo> createtable myPreSplitTable --splits-file mySplitsFile.txt
A small set of specific split points can be added directly in the shell:
user@accumulo> addsplits e j o t -t mytable
Splits can be added via the Java API as well:
ZooKeeperInstanceinst=newZooKeeperInstance(myInstance,zkServers);Connectorconn=inst.getConnector(principal,passwordToken);SortedSet<Text>splitPoints=newTreeSet<>();splitPoints.add(newText("e"));splitPoints.add(newText("j"));splitPoints.add(newText("o"));splitPoints.add(newText("t"));conn.tableOperations().addSplits("mytable",splitPoints);
If a set of split points are to be used to presplit a table from time to time, or to be distributed along with an application for use with multiple sources of data, care should be taken to ensure that the split points used on a table are representative of the distribution of the data to be loaded. The distribution of keys within a data set may change over time, and may not be the same from one data source to another.
Accumulo can also merge tablets, which is covered in “Merging Tablets”.
Balancing Tablets
Once a table is split into some number of tablets, the Accumulo master can use different load balancers to achieve a good distribution of tablets across tablet servers. By default, each table’s tablets are balanced separately and are assigned evenly and randomly to tablet servers. This load balancer will likely suffice for the majority of applications.
However, some applications may require more fine-tuned control over their tablets. Some key design patterns require not only that a table’s tablets are distributed evenly, but that specific subsets of tablets are also distributed evenly.
An example might be a table with a row key containing a date. Suppose an application built on top of this table frequently accesses dates falling within the same month at the same time. Using the default load balancer could end up assigning all the tablets for a month to a single server, limiting the insert and query capabilities across that group of tablets. Instead, this table could employ a custom load balancer to ensure that tablets falling within the same month are distributed evenly to tablet servers.
To write a custom load balancer, implement a class that extends TabletBalancer as described in “Additional Properties”.
Add a JAR containing the new balancer to Accumulo’s CLASSPATH on at least the master nodes, and configure a table to use this balancer by setting the table.balancer property for the table.
Balancing Reads and Writes
Accumulo allows users to dedicate system resources to writes or reads as necessary. By default, Accumulo does not throttle writes in order to keep some resources available for reads, so query performance can suffer if clients are using too much of Accumulo’s resources for writing.
One method of throttling writes and improving read performance is to decrease the maximum number of files Accumulo is allowed to create per tablet.
This is controlled with the per-table setting table.file.max, which defaults to 15.
When the maximum number of files has been reached for a tablet, Accumulo will merge new data with data from one of the existing files instead of creating a new file for that tablet.
The new, merged file will then replace the existing file.
This process is called a merging minor compaction.
When merging minor compactions are occurring, the overall write rate of the cluster may begin to decrease, because a minor compaction to free up memory for new writes may be waiting for a merging minor compaction to complete.
While this is happening, any new writes to the server cannot proceed and clients are told to wait.
Increasing the table.file.max setting or decreasing the table.compaction.major.ratio setting will ensure that enough background compactions occur so that minor compactions will not end up having to wait and block clients.
Data Locality
In MapReduce jobs, the notion of physical data locality, in terms of the distance between data to be processed and the CPU and RAM elements in which it will be processed, is extremely important. Many types of MapReduce jobs are run on data that is so large that reading it from some storage medium over a network would limit the performance in an unacceptable way. The primary innovation of MapReduce versus many other types of data processing is that it sends the computation to the data, rather than moving the data to the computation.
When key-value pairs are processed in a MapReduce job, the key-value pairs are read from a local disk by a copy of the map or reduce process that has been sent to the machine holding the data. This allows the overall job to be limited by the aggregate throughput of all the hard drives in the cluster, which is often much higher than the aggregate throughput rate of the network connecting machines in the cluster.
Data for MapReduce jobs is stored beforehand in HDFS, which automatically distributes it over many machines, handles replication, and helps programs find a particular piece of data by exposing the IP address of the physical machine on which it is stored.
For Accumulo, the concept of physical data locality is still important but not paramount. Because Accumulo uses HDFS to store files, each time a tablet server flushes a new file to HDFS as part of the minor compaction process, one copy of that file is stored locally on the machine hosting the tablet server process. Subsequent reads can then simply read from local disk rather than pulling data from a remote machine over a network.
Over time, as the Accumulo master performs load balancing of tablets, some tablets may reference files for which there is no local copy, forcing reads to pull data from a remote machine over the network. But eventually the major compaction process will tend to create new files for each tablet, merging several old files into one new file, which will cause a local copy to be created. Good physical data locality is something Accumulo achieves eventually and asynchronously.
Accumulo has a utility for checking the level of data locality in a cluster.
It can be run via the accumulo command:
accumulo org.apache.accumulo.server.util.LocalityCheck -u root -p secret
Server         %local  total blocks
 10.10.100.1 100.0        7
 10.10.100.2 100.0       10
 10.10.100.3 100.0       10
If for some reason a cluster has poor data locality, increasing the frequency of major compactions or scheduling a major compaction can cause files to be rewritten.
To compact a table, use the compact command from the shell:
accumulo@cluster> compact myTable
Note that this will completely rewrite all files in a table. When stopping and restarting a cluster, Accumulo tries to reassign tablets to the same tablet servers that were previously hosting them before shutting down, so that physical locality is preserved.
Sharing ZooKeeper
Some other applications running on or close to the Accumulo cluster might also make use of ZooKeeper. In particular, Apache Kafka is a popular distributed queue used to stream data to and from applications. Some Accumulo clients can make use of Kafka to stream data to Accumulo or from Accumulo to other applications.
Similarly, Apache Storm, a popular streaming data processing framework, relies on ZooKeeper for configuration information.
Be cognizant of the load placed on ZooKeeper by these other systems. (See the ZooKeeper documentation on monitoring.) Although ZooKeeper itself is a distributed application, one machine of the quorum serves as master, meaning that all writes go to it, whereas reads can go to any member of the quorum. The ZooKeeper quorum master has to handle all writes and replicate those writes synchronously to other members of the quorum, so the scalability of writes isn’t improved by adding more machines; rather, it makes each write more expensive, reducing the total write throughput of the ZooKeeper instance.
If ZooKeeper can’t keep up with operations, Accumulo will not function properly. It is possible to run multiple separate ZooKeeper instances on a cluster, each one consisting of one, three, or five nodes, as long as applications are configured to use different instances.
1 Jakob Nielsen, Usability Engineering (Boston: Academic Press, 1993), Chapter 5.
2 Luiz André Barroso, Jeffrey Dean, and Urs Hölzle, “Web Search for a Planet: The Google Cluster Architecture”, Micro, IEEE, 23, no. 2, 22–28.