

Appendix A
GUI Systems and Source Code
A.1 Introduction
For the sake of better understanding GP and its ex tensions, software de-
scribed in this book can be downloaded from the website of the author’s
laboratory (http://www.iba.t.u-tokyo.ac.jp/). They a re LGPC for Art, TSP
by GA, GP, PSO, etc.
The intention of making these software packag e s available is to allow users
to “play” with emergent sy stems. We re quest interested rea d e rs download these
packages and experience the emer gent properties. The web pages contain (1)
instructions for downloading the packages, (2) a user’s manual, and (3) a
bulletin board for posting questions. Readers are invited to use these facilities.
Users who download and use these programs should bear the following
items in mind:
(1) We ac c e pt no responsibility for any damag e that may be caused by
downloading these programs.
(2) We ac c e pt no responsibility for any damag e that may be caused by
running these programs o r by the re sults of executing such programs.
(3) We own the copyright to these progra ms .
(4) We reserve the right to alter, add to, or re move these programs without
notice.
In order to download the software mentioned in this book, please follow
the following link, which contains further instructions:
http://www.iba.t.u-tokyo.ac.jp/english/BeforeDownload.htm
If inappropriate values are used for the parameters (for instance, elite size
greater than population size), the program may crash. Please rep ort a ny bugs
found to stroganoff@iba.t.u-tokyo.ac.jp.
257
258 Agent-Based Modeling and Simulation with Swarm
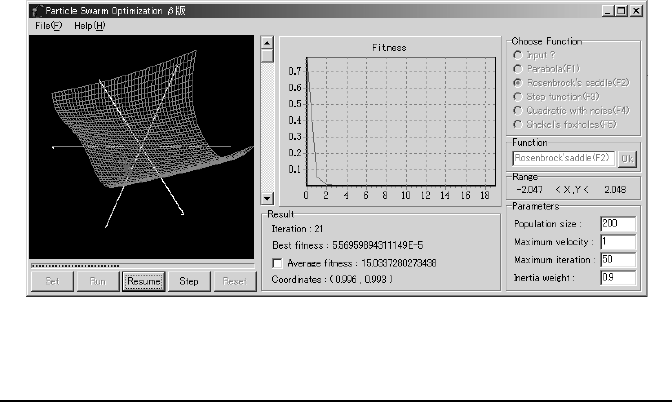
FIGURE A.1: PSO simulator.
A.2 PSO simulator and benchmark functions
The PSO search process could be observed using this simulator (se e
Fig. A.1). The user is able to freely define the functions for the search.
In addition, this simulator uses De Jong’s standard functions. De Jong’s
standard functions are benchmark tests for GAs, and are used for determining
the minimum value. The definitions of these functions, along with the defi-
nition fields and optimum values, are shown in Ta ble A.1. The form of the
functions and plots projected on the x
1
− x
2
plane are shown in Fig . A.2.
Benchmark functions F 4 and F 5 seem to be more difficult than the o thers.
The +GAUSS(0, 1) of F 4 shows the addition of values from the normal dis -
tribution w ith average 0 and dispersion 1. In other words, noise is included in
the various points in F 4 . With F 5, there is a series of 5 × 5 valleys lined up
in a g rid alignment, but the valleys do not have a uniform depth. The trough
of the valley at the lowermost left is the minimum value (≈ 1), while the local
minimum values of the remaining troughs increase sequentially from left to
right and from bottom to top, as 2, 3, etc. When leaving these tro ughs, it
rapidly approaches the maximum value of 500. Note that the coordinates of
a
ij
are as follows:
int a[2][25] = {
{-32, -16, 0, 16, 32, -32, -16, 0, 16, 32, -32, -16, 0, 16, 32,
-32, -16, 0, 16, 32, -32, -16, 0 16, 32},
{-32, -32, -32, -32, -32, -16, -16, -16, -16, -16, 0, 0, 0, 0,
0, 16, 16, 16, 1 6, 16, 32, 32, 32, 32, 32}
};
Originally, F 1, F 2, and F 3 can have generalized definitions with three or

GUI Systems and Source Code 259
(a) F 1 (b) F 2
(c) F 3 (d) F 4
(e) F 5
FIGURE A.2: Benchmark functions.

260 Agent-Based Modeling and Simulation with Swarm
TABLE A.1: De Jong’s standard functions.
Function Definition Domain Optimum
Name Value
F 1
P
3
i=1
x
2
i
−5.11 ≤ x
i
< 5 .12 0
Paraboloida l surface
F 2 100(x
2
1
− x
2
)
2
+ (1 − x
1
)
2
−2.047 ≤ x
i
< 2 .048 0
Rosenbrock’s saddle
F 3
P
5
i=1
⌊x
i
⌋ −5.11 ≤ x
i
< 5 .12 −30
Step function
F 4
P
30
i=1
ix
4
i
+ GAUSS(0, 1) −1.27 ≤ x
i
< 1 .28 0
Quartic function with noise
F 5
"
1
500
+
P
25
j=1
1
j+
P
2
i=1
(x
i
−aij)
6
#
−1
−65.535 ≤ x
i
< 6 5.536 1
Shekel’s foxholes
more variables, but here we reduced the number of dimensions in the functions
to make two-variable problems that are much simpler to work with.
For convenience, the Z axis was greatly compressed in the view of F 5 in
the PSO simulation, so it looks somewhat different from the previous figure.
Download and unzip the file “Particle Swarm Optimization ver1.0” (402
kB). It contains 3 files: EquToDbl.dll, EquToDbl.txt, and PSO.exe. Click
PSO.exe to start the simulator.
The following co mmands allow the user to make basic use of the simulator:
• Set button
When pressed, an initial population is generated.
• Run button
When pressed, execution is initiated.
• Stop button
Pressing this button halts calculations. It is used when the user wants
to observe the movement of individuals during the simulation.
• Step button
This button can be used after pressing the Stop button to sequentially
observe motions at each generation.
• Reset button
After a simulation has been completed, pressing this will re-sta rt execu-
tion.
The following parameters can be set by the user.
GUI Systems and Source Code 261
• Population size
Number of individuals in the population.
• Maximum veloc ity
The maximum velocity of any individual in motion. All individuals are
prevented from moving any faster.
• Maximum itera tion
Maximum number of replications o f the simulation.
• Inertia weight
Attenuation coefficient. The default value is 0.9, causing the speed to
gradually decre ase with time.
• Input?
If this box is checked, the user is able to freely define the functions.
After ex e c utio n is star ted, the fitness transition is plotted in the chart area
at the center of the screen. The following items are displayed in the “Result”
panel beneath the plot:
• Iteration
Number of the current replication. This corresponds to the number of
generations in a GA.
• Best fitness
Best (minimum) fitness value among all individuals.
• Average fitness
Average fitness value of all individuals. If this box is checked, the average
fitness is plotted in the above graph.
• Co ordinates
This shows the coordinates of the be st fitness.
A.3 TSP simulator by a GA
The TSP simulator works as follows.
(1) Set values for number of city, po pulation size , max generation in the
text boxes next to the labels C ity, Population Size and Max Generation,
respectively.
(2) Also set crossover and mutation rates. Select “selection method” and
“replacement strategy” by clicking the choice provided. If you choose
elitism replacement, provide the percentage value for elite replacement.
If none is changed, default values are used.
..................Content has been hidden....................
You can't read the all page of ebook, please click here login for view all page.