Chapter 21. Communicating about Plans
“The more elaborate our means of communication, the less we communicate.”
—Joseph Priestley
In this chapter, we will look at some specific ways to communicate about plans. However, more important than specifically what we communicate is how we approach the work of communicating about estimates and plans. We want all communication, but especially communication about estimates and plans, to be frequent, honest, and two-way.
Frequent communication about plans is important because of how often an agile plan is updated. For example, even if a team does rolling lookahead planning (as described in Chapter 18, “Planning the Multiple-Team Project”), their release plan may show only what will be developed in the next few iterations. The user stories that will be developed through the rest of the release may be included in the release plan, but they will not be sequenced beyond the horizon of the lookahead plan and may be listed only as broad themes.
We cannot (and do not want to) produce a plan on the first day and leave it alone for three to six months. Plans are updated throughout the project, and these updates need to be communicated. Failing to do so ignores the valuable feedback loops that can improve the desirability and success of the product and the usefulness of the plan. During the short timebox of an iteration, it is important for team members to see daily variations in the iteration burndown chart so that they can make adjustments to complete all the work of the iteration. Over the longer period of a release, project stakeholders and participants need insight into progress against and revisions to the release plan.
Honest communication is important if the development team and customer team are to trust each other. If the developers learn, for example, that the product owner has been telling them artificial dates, they will no longer trust her. Similarly, if developers give estimates that the product owner knows are unrealistic, trust will disappear here as well. I worked with a team recently that told me their executives ask for more work than can reasonably be expected because “That way, if they get 80%, they’re happy.” The theory was that the executives would get 80% of whatever they asked for, so they knew to ask for more than needed.
Without trust, it is hard to have honest communication, so the loss of trust must be taken very seriously. If a developer knows that a given task will take much longer than currently expected, she needs to feel safe sharing that knowledge with the rest of the team, including her manager. If this type of honest communication is discouraged, problems such as this will remain hidden longer.
It is important that communication about estimating and planning be two-way, because we want to encourage dialogue and discussion about the plan so that we make sure we always have the best possible plan (given current knowledge) for delivering value to the organization. We want to iterate and refine plans based on feedback and new knowledge. Because of this, we need dialogue about plans, not one-way presentations.
Finally, make it your responsibility to make sure that all recipients understand the message you are delivering. They need not only to hear the message, but also to understand it. If you are a project manager delivering the message that the project is behind schedule, do it in such a manner that no one can fail to understand. This is one of the reasons that agile teams favor big, visible charts as a way of communicating—with no more than a handful of big, visible charts hanging in the team’s workspace, it is likely that everyone on the project team will understand the significance of each. To the contrary, if the news that a project is behind is “clearly” shown on page thirty-two of a forty-page weekly status report, it’s quite likely that no one knows it.
With these goals in mind, the rest of this chapter provides some specific guidance and tips on how to communicate about estimates and plans.
Communicating the Plan
When asked about the schedule for a project, it is tempting to sum the number of story points to be delivered, divide by a guess of velocity, and say something like “We’ll ship on June 14, which is 7.2 iterations from now.” This is wrong because it gives the impression that the knowledge from which we construct the plan is sufficiently precise as to support this type of estimate. When possible, include with your communication of a target date either your degree of confidence in the estimate, a range of possible dates, or both. For example, you may say:
• I am 90% sure we’ll complete the planned functionality by July 31.
• Based on our assumptions about the project size and team performance, the project will take three to four months.
As an example of this type of communication, Ron Jeffries (2004) of www.XProgramming.com has suggested saying something like this:
Right now, this appears to be a 200-point project. Based on our performance on other projects (or a random guess), with N programmers on it, and your intimate involvement in the project, a project of this size will take between four and six months. However, we will be shipping software to you every two weeks, and we’ll be ticking off these feature stories to your satisfaction. The good news is that if you’re not satisfied, you can stop. The better news is that if you become satisfied before all the features are done, you can stop. The bad news is that you need to work with us to make it clear just what your satisfaction means. The best news is that whenever there are enough features working to make the program useful, you can ask us to prepare it for deployment, and we’ll do that. As we go forward, we’ll all see how fast we’re progressing, and our estimate of the time needed will improve. In every case, you’ll see what is going on, you’ll see concrete evidence of useful software running the tests that you specify, and you’ll know everything as soon as I know it.
Some companies have become accustomed to communicating project schedules through the familiar Gantt chart, as shown in Figure 21.1. Gantt charts have earned a bad reputation, but this is because of how they are often used to predict, schedule, and coordinate tasks. Despite these challenges in their use, Gantt charts can be great tools for showing the allocation of features to iterations.
Figure 21.1. Showing iteration contents in a Gantt chart.
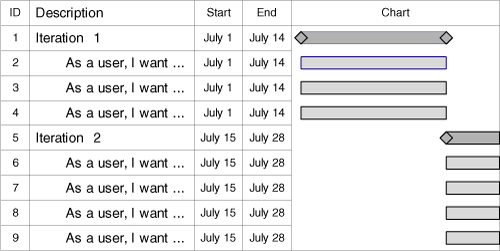
There are a couple of minor but key differences between what is shown in Figure 21.1 and a more traditional Gantt chart. First, Figure 21.1 stops at the feature level and does not decompose each user story into its constituent tasks. What is shown then is a feature breakdown structure rather than a work breakdown structure of the project. Because it is the completion of features, rather than the completion of the tasks that add up to a feature, that adds value to a product, the Gantt chart is drawn showing features.
Second, each feature is shown to take the full length of the iteration into which it is scheduled. A feature may be done midway through an iteration, but it is not made available to the organization until the end of the iteration, so that is what the Gantt chart reflects.
Third, no resource allocations are shown in Figure 21.1. Because the whole team is responsible for the delivery of all features, there is no benefit in putting Mary’s name next to one feature and Vadim’s next to another. Of course, if you’re producing a Gantt chart showing the work of multiple teams, you may want to indicate whole-team responsibility by assigning features (or really entire iterations) to Team 1 or Team 2, and so on.
Communicating Progress
Naturally, the release burndown charts of Chapter 19, “Monitoring the Release Plan,” are a primary way of communicating progress. Progress on a release burndown chart is a function of the amount of work remaining and the velocity of the team. The simple way to predict the number of iterations remaining is to take the number of points remaining to be developed, divide this by the team’s velocity, and then round up to next whole number. So if there are 100 points remaining and the team’s velocity is 10, we could say there are 10 iterations remaining.
However, measures of velocity are imprecise, and we expect velocity to fluctuate. If a team has determined their average velocity is ten, it is not inconceivable that it averages nine or eleven for the next few iterations. In fact, it’s not inconceivable for velocity to be seven or thirteen over the next few iterations. In those cases, there could be as few as eight or as many as fifteen iterations left. When forecasting the number of iterations remaining, it generally is best to use a range of probable velocities.
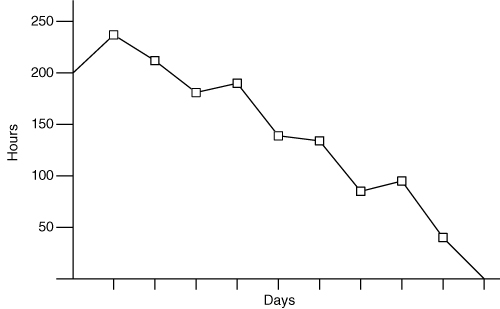
To see one way of selecting the range of velocities, consider Figure 21.2, which shows a team’s velocity over their preceding eight iterations. Velocity in the most recent iteration was nineteen. However, the average velocity over the past eight iterations is seventeen, and the average of this team’s worst three iterations is fourteen. Each of these values will lead to a different expectation about when all of the currently planned work will be complete. This is why it is often best to use more than one velocity value and to present conclusions as a range of likely outcomes.
Figure 21.2. Velocity as measured for the last eight iterations.
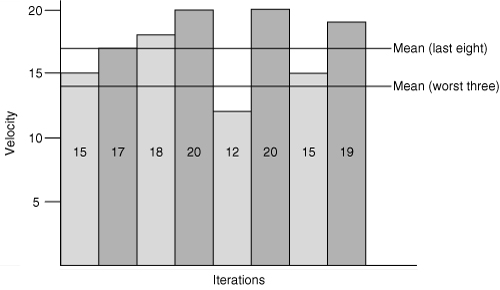
In selecting a range of velocity values, I typically consider up to the last eight iterations. Many teams stay together that long, but going back beyond eight iterations starts to feel like ancient history to me. If you don’t have eight iterations, use what you have. From these previous iterations, I look at three values.
1. The velocity of the most recent iteration
2. The average (mean) velocity
3. The average (mean) velocity of the three slowest iterations
These three values present a good picture of what just happened, a “long term” average, and a worst-case of what could happen. I use these three different velocity values to forecast approximately how much more work may be completed by a given date. For example, if we would like to release the product after five more iterations, and the team’s most recent velocity was 19, we can predict that the team might complete another 95 points. Similar math can be done with the other measures of velocity. Doing so results in a range of the likely amount of work the team will complete. I usually summarize this as shown in Table 21.1.
Table 21.1. The Expected Number of Points Based on Velocities in Figure 21.2

Although I look for trends in velocity, many projects have too few iterations for velocity trends to become either apparent or relevant. If I notice what appears to be a trend toward an increasing velocity, I am pleased but don’t act on it. I would never draw a trend line through Figure 21.2, for example, and predict that the team’s velocity will be twenty in the next iteration. Similarly, if velocity appeared to be headed downward, I would figure out and remove the cause of the decline rather than plan on velocity continuing to drop.
Calculating the three expected velocity values (as shown in Table 21.1) allows the product owner and team to make predictions about the amount of work that can be completed before a planned release date. Based on Table 21.1, for example, a product owner should feel comfortable that at least seventy additional story points will be added during the next five iterations. However, the product owner probably should not take out advertising space on a blimp about anything beyond eighty-five more story points.
An End-of-Iteration Summary
Yes, it may not seem agile to suggest writing an end-of-iteration summary report. But almost every manager I talk to asks me if I do so. After I answer in the affirmative, I am almost always asked to share the template I use. You’ll have to decide for yourself whether you want to take the time to do this. I find that I can complete this summary document in less than thirty minutes per iteration. I tend to favor two-week iterations on most projects, so this means I invest at most fifteen minutes per week in this.
The following sections present a sample iteration summary for the SwimStats project. I tend to include most of this information for most projects, but you may want to drop or add sections as appropriate.
Context
Dates

Personnel
The following personnel were available during the iteration. Also listed are the days they were expected to work and the number of days they did work.
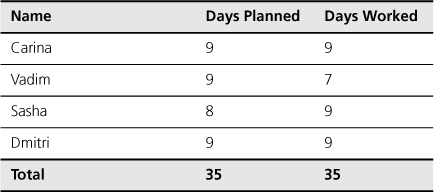
Because holidays reduce the number of working days in an iteration, the number of planned working days may vary in some iterations. In this example, Vadim worked two days fewer than planned. He may have been sick. On the other hand, Sasha worked one day more than planned. Perhaps she’d tentatively planned a vacation day that she didn’t take.
Metrics
Nightly Build Results
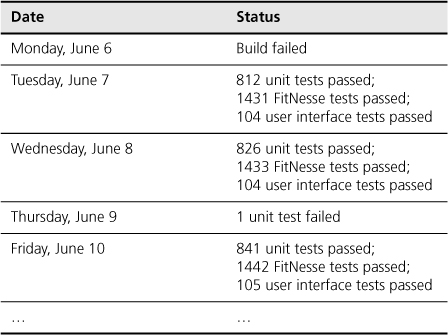
The rows in this table are usually colored: green for a successful build and red for one that failed for any reason. Notice that the status column reports the number of successful tests only if all tests are successful. If any test fails, all that is shown is the number of failing tests. If one test fails, it doesn’t matter how many tests pass. Reporting that 99 of 100 tests passed leads to the temptation to think that because 99% of the tests passed, we must be doing well. I want to avoid that temptation, so I report either the number of tests that passed (if they all did) or the number that failed otherwise.
Iteration Burndown
Velocity
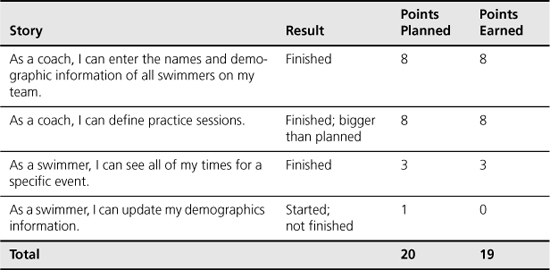
Contents and Assessment
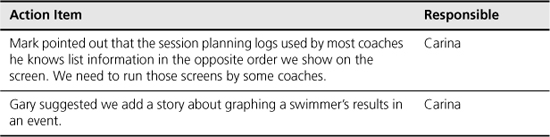
Iteration Review
The iteration review was held at 9:00 on September 15. The following items were identified:
Summary
We want communication about estimates and plans to be frequent, honest, and two-way. A Gantt chart can be a useful tool for communicating about a plan. However, it should not be taken below the feature breakdown level, and features on it should be shown as in process for the entire duration of the iteration.
Burndown charts are the primary method for communicating about progress, but they are often accompanied by a chart showing the development team’s velocity per iteration. It is to useful to think of velocity as a range of values rather than one value. A good way to do this is to use the velocity of the most recent iteration, the average of the previous eight iterations, and the average of the lowest three of the previous eight iterations. These three values present a good picture of what just happened, a long-term average, and a worst case of what could happen.
On some projects an end-of-iteration summary can be useful, both in disseminating current information and as a historical document for use in the future.
Discussion Questions
1. Suppose a project has 150 points of work remaining to be done. Over the last 10 iterations the team have achieved a velocity of 10, 12, 13, 5, 14, 7, 6, 12, 16, and 14. You are asked when the project will be done. What do you say?
2. Is the deadline for your current project talked about as a specific date (September 18) or a range? Why?
3. Within what range of iterations or dates will your current project finish?