Chapter 16. Estimating Velocity
“It is better to be roughly right than precisely wrong.”
—John Maynard Keynes
One of the challenges of planning a release is estimating the velocity of the team. You have the following three options:
There are occasions when each of these approaches is appropriate. However, regardless of which approach you are using, if you need to estimate velocity you should consider expressing the estimate as a range. Suppose you estimate that velocity for a given team on a given project will be 20 ideal days per iteration. You have a very limited chance of being correct. Velocity may be 21, or 19, or maybe even 20.0001. So instead of saying velocity will be 20, give your estimate as a range, saying perhaps instead that you estimate velocity will be between 15 and 24.
In the following sections, I’ll describe each of the three general approaches—using historicals, running an iteration, and making a forecast—and for each, I’ll also offer advice on selecting an appropriate range.
Use Historical Values
Historical values are great—if you have them. The problem with historical values is that they’re of the greatest value when very little has changed between the old project and team and the new project and team. Any personnel or significant technology changes will reduce the usefulness of historical measures of velocity. Before using them, ask yourself questions like these:
• Is the technology the same?
• Is the domain the same?
• Is the team the same?
• Is the product owner the same?
• Are the tools the same?
• Is the working environment the same?
• Were the estimates made by the same people?
The answer to each question is often yes when the team is moving onto a new release of a product they just worked on. In that case, using the team’s historical values is entirely appropriate. Even though velocity in a situation like this is relatively stable, you should still consider expressing it as a range. You could create a range by simply adding and subtracting a few points to the average or by looking at the team’s best and worst iterations over the past two or three months.
However, if the answer to any of the preceding questions is no, you may want to think twice about using historical velocities. Or you may want to use historical velocities but put a larger range around them to reflect the inherent uncertainty in the estimate. To do this, start by calculating the team’s average velocity over the course of the preceding release. If they completed 150 story points of work during 10 iterations, their average (mean) velocity was 15 points.
Before showing how to convert this to a range, take a look at Figure 16.1. This figure shows the cone of uncertainty that was introduced back in Chapter 1, “The Purpose of Planning.” The cone of uncertainty says that the actual duration of a project will be between 60% and 160% of what we think it is. So to turn our single-point, average velocity into a range, I multiply it by 60% and 160%.[1] So if our average historical velocity is 15, I would estimate velocity to be in the range of 9 to 24.
Figure 16.1. The cone of uncertainty around schedule estimates.
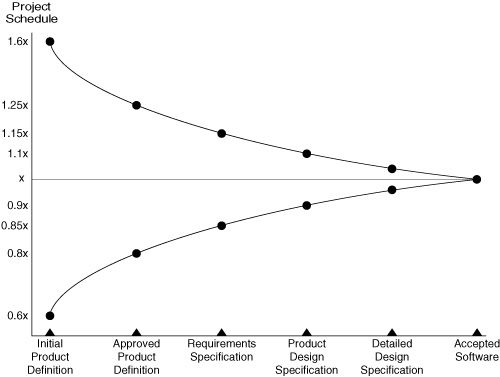
This range may feel large, but given the uncertainty at this point, it is probably appropriate. Constructing a range in this way helps the project team heed the advice offered in the quote at the start of this chapter that it is better to be roughly right than precisely wrong. A large range around the expected velocity will allow the team to be roughly right about it.
Run an Iteration
An ideal way to forecast velocity is to run an iteration (or two or three) and then estimate velocity from the observed velocity during the one to three iterations. Because the best way to predict velocity is to observe velocity, this should always be your default approach. Many traditional projects get under way with the developers working on the “obvious” requirements or infrastructure, the analysts “finalizing” the requirements, and the project manager putting together a comprehensive list of tasks that becomes the project plan. All of this takes time—often, as long as a few iterations on an agile project.
I was with a development director recently who said that deadlines are not set on traditional projects in his company until about two months into a year-long project. It takes them that long to get the requirements “locked down” and a plan created. He told me that even after that much effort, their project plans were always off at least 50% and often more. We agreed that instead, he would use this up-front time to turn the team loose on the project, observe their velocity over two or three iterations, and then use that to plan a release date.
For similar reasons, as was the case with this development director, most project managers can hold off giving an estimate for at least one iteration. If that’s your case, use the time to run an iteration and measure the velocity. Then create a range around that one data point, using the cone of uncertainty. So if you ran one iteration and had a velocity of 15, turn it into a range by multiplying by 0.60 and 1.6, giving a range of 9 to 24.
If a team can run three or more iterations before being giving an estimate of velocity, they have a couple of additional options for determining a range. First and easiest, they can simply use the range of observed values. Suppose the team has completed three iterations and had velocities of 12, 15, and 16. They could express velocity as likely to be within the range 12 to 16.
Alternatively, they could again use the cone of uncertainty. Although there’s no solid empirical basis for the approach I’m about to describe, it does work, and it makes sense. Here’s the approach: Calculate the average velocity for the iterations you’ve run. Then, for each iteration completed, move one step to the right on the cone of uncertainty. So for a team that has run one iteration, use the range for the “initial product definition” milestone. If the team has run two iterations, use the range for the “approved product definition” milestone (80% to 120%), and so on. For convenience, these numbers are shown in Table 16.1.
Table 16.1. Multipliers for Estimating Velocity Based on Number of Iterations Completed
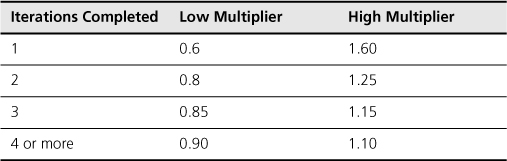
Suppose that a team has run three iterations with an average velocity of twenty during that period. For three iterations the appropriate range is 85% to 115%. This means that if the team’s average velocity is twenty after three iterations, their actual true velocity by the end of the project will probably be in the range seventeen to twenty-three.
I normally don’t extend this analysis past three or four iterations. I don’t use the cone of uncertainty, for example, to pretend that after six iterations, the team precisely knows their velocity, and it won’t waver through the end of the project.
Some organizations will resist starting a project without having a more specific idea how long it will take. In such cases, stress that the need to run a few iterations first stems not from a desire to avoid making an estimate, but to avoid giving an estimate without adequate foundation. You’ll want to stress that the purpose of these initial iterations is to assess the dark corners of the system, better understand the technologies involved, refine the understanding of the requirements, and measure how quickly the team can make progress.
Make a Forecast
There are times when we don’t have historicals, and it is just not feasible to run a few iterations to observe velocity. Suppose the estimate is for a project that won’t start for twelve months. Or suppose the project may start soon, but only once a client signs a contract for the work. There are two key differences in cases like this. First, you want to minimize the expenditure on the project so you won’t actually start running iterations on a project that may not happen or that is too far in the future. Second, any estimate of velocity on these projects must reflect a high degree of uncertainty.
In cases like these, we need to forecast velocity. Forecasting velocity is rarely your first option, but it’s an important option and one you should have in your bag of tricks. The best way to forecast velocity involves expanding user stories into their constituent tasks, estimating those tasks (as we do when planning an iteration), seeing how much work fits into an iteration, and then calculating the velocity that would be achieved if that work were finished in an iteration. This involves the following steps:
1. Estimate the number of hours that each person will be available to work on the project each day.
2. Determine the total number of hours that will be spent on the project during the iteration.
3. Arbitrarily and somewhat randomly select stories, and expand them into their constituent tasks. Repeat until you have identified enough tasks to fill the number of hours in the iteration.
4. Convert the velocity determined in the preceding step into a range.
Let’s see how this works through an example.
Estimate the Hours Available
Almost everyone has some responsibilities outside of the specific project that is their primary responsibility. There are emails to be answered, phone calls to be returned, company meetings to attend, and so on. The amount of time this takes differs from person to person and organization to organization. What it amounts to, though, is that project participants generally do not spend 100% of their time working on the project.
From observation and discussion with colleagues, my opinion is that most individuals who are assigned full time to a project spend between four and six hours per day on that project. This fits with reports that individuals spend 55% (Ganssle 2004) to 70% (Boehm 1981) of their time on project activities. At the high end, Kennedy (2003) reports that engineers in Toyota—with its highly efficient, lean process—are able to spend 80% of their time on their designated projects.
Use these numbers as parameters in estimating the amount of time individuals on your project team will be able to dedicate each day to the project. If you are part of a large bureaucracy, you will most likely be at the low end of the scale. If you are part of a three-person start-up in a garage, you’ll probably be at the high end. For the purposes of this example, let’s assume that the SwimStats team estimates they will each be able to dedicate six hours per day to the project.
Estimate the Time Available in an Iteration
This step is simple: Multiply the number of hours available each day by the number of people on the team and the number of days in each iteration. Suppose the SwimStats team includes one analyst, one programmer, one database engineer, and one tester. Four people each working six hours per day is twenty-four hours each day. In a ten-day iteration they put about 240 hours toward the project.
When I introduce this approach to some teams, they want to factor in additional adjustments for vacations, sick time, and other such interruptions. Don’t bother; it’s not worth the extra effort, and it’s unlikely to be more accurate anyway. These events are part of the reason why we don’t plan on a team’s being 100% available in the first place.
Getting More Time on Your Project
Regardless of how many hours team members are able to put toward a project each day, you’d probably like to increase that number. The best technique I’ve found for doing so was invented by Francesco Cirillo of XPLabs. Cirillo coaches teams to work in highly focused thirty-minute increments (Cirillo 2005). Each thirty-minute increment consists of two parts: twenty-five minutes of intense work followed by a five-minute break. These thirty-minute increments are called “pomodori,” Italian for tomatoes and deriving from the use of tomato-shaped timers that ring when the twenty-five-minute period is complete.
Cirillo introduced this technique to Piergiuliano Bossi, who has documented its success with multiple teams (Bossi 2003; Bossi and Cirillo 2001). These teams would plan on completing ten pomodori (five hours) per day. If you find yourself with less productive time per day than you’d like, you may want to consider this approach.
Expand Stories and See What Fits
The next step is to expand stories into tasks, estimate the tasks, and keep going until we’ve filled the estimated number of available hours (240, in this case). It is not necessary that stories be expanded in priority order. What you really want is a fairly random assortment of stories. Do not, for example, expand all the one- and two-point stories and none of the three- and five-point stories. Similarly, do not expand only stories that involve mostly the user interface or the database. Try to find a representative set of stories.
Continue selecting stories and breaking them into tasks as long as the tasks selected do not exceed the capacity of the individuals on the team. For the SwimStats team, for example, we need to be careful that we don’t assume the programmer and analyst are also fully proficient database engineers. Select stories until one skill set on the team can’t handle any more work. Add up the story points or ideal days for the work selected, and that is the team’s possible velocity.
Suppose we get the planned team together (or a proxy for them if the project will not start for a year), and we expand some stories as shown in Table 16.2. If we felt that the four-person SwimStats team could commit to this but probably no more, we’d stop here. This 221 hours of work seems like a reasonable fit within their 240 hours of available time. Our point estimate of velocity is then twenty-five.
Table 16.2. Hours and Points for Some SwimStats Stories

Put a Range Around It
Use whatever technique you’d like to turn the point estimate of velocity into a range. As before, I like to multiply by 60% and 160%. For the SwimStats team, this means our estimate of twenty-five story points per iteration becomes an estimate of fifteen to forty.
A Variation for Some Teams
Some teams—especially those with a significant number or part-time members—should not plan with a single number of hours that everyone is available. These teams may have members who are allocated for dramatically smaller portions of their time. In these cases, it can be useful to create a table like the one shown in Table 16.3.
Table 16.3. Calculating Availability on a Team with Part-Time Members
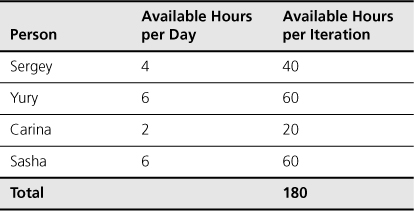
For the SwimStats team, as shown in Table 16.3, Yury and Sasha are dedicated full time to the project. SwimStats is Sergey’s only project, but he has some other managerial and corporate responsibilities that take up some of his time. Carina is split between SwimStats and another project. She has very few responsibilities beyond the two projects, and so she could put close to six hours per day on them. However, she needs to move back and forth between the two projects many times each day, and this multitasking affects her productivity, so she is shown as having only two productive hours on SwimStats per day.
Keep in mind that the reason we’re forecasting velocity in this way is that it is either impossible or impractical for the team to run an iteration, and they do not yet have any historical observations. This may be the case because the team doesn’t yet exist, and you are tasked with planning a project that starts a few months from now.
If, for example, you are in an environment where you are doing strategic planning and budgeting well in advance of initiating a project, forecasting velocity in this way can be your best approach.
Which Approach Should I Use?
Determining which approach to use is often simpler than this variety of choices may make it appear. Circumstances often guide you and constrain your options. In descending order of desirability, follow these guidelines to estimate velocity:
• If you can run one or more iterations before giving an estimate of velocity, always do so. There’s no estimate like an actual, and seeing the team’s actual velocity is always your best choice.
• Use the actual velocity from a related project by this team.
• Estimate velocity by seeing what fits.
Regardless of which approach you use, switch to using actual, observed values for velocity as soon as possible. Suppose that you choose to estimate velocity by seeing what fits in an iteration because the project is not set to begin for six months and the organization needs only a rough guess of how long the project will take. Once the project begins and you are able to measure actual velocity, begin using those actuals when discussing the project and its likely range of completion dates.
Summary
There are three ways of estimating velocity. First, you can use historical averages if you have them. However, before using historical averages, you should consider whether there have been significant changes in the team, the nature of the project, the technology, and so on. Second, you can defer estimating velocity until you’ve run a few iterations. This is usually the best option. Third, you can forecast velocity by breaking a few stories into tasks and seeing how much will fit into an iteration. This process is very similar to iteration planning.
Regardless of which approach you use, estimates of velocity should be given in a range that reflects the uncertainty inherent in the estimate. The cone of uncertainty offers advice about the size of the range to use.
Discussion Questions
1. In Table 16.2, stories that were estimated to have the same number of story points did not have the same number of task hours. Why? (If you need a refresher, see the section “Relating Task Estimates to Story Points” in Chapter 14, “Iteration Planning.”
2. Complete a table like Table 16.3 for your current project. What might you try to increase the amount of time each person is able to devote to the project?