
6.6 Graphs of Transformed Sine and Cosine Functions
-
Graph transformations of y=sin x and y=cos x in the form
y=A sin(Bx−C)+D
and
y=A cos(Bx−C)+D
and determine the amplitude, the period, and the phase shift.
-
Graph sums of functions.
-
Graph functions (damped oscillations) found by multiplying trigonometric functions by other functions.
Variations of Basic Graphs
In Section 6.5, we graphed all six trigonometric functions. In this section, we will consider variations of the graphs of the sine and the cosine functions. For example, we will graph equations like the following:
In particular, we are interested in graphs of functions in the form
and
where A, B, C, and D are constants. These constants have the effect of translating, reflecting, stretching, and shrinking the basic graphs. Let’s first examine the effect of each constant individually. Then we will consider the combined effects of more than one constant.
The Constant D
Let’s observe the effect of the constant D in the graphs below.
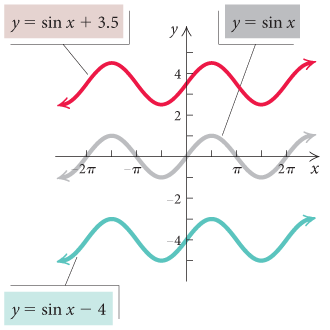

Example 1
Sketch a graph of y=sin x+3.
Solution
The graph of y=sin x+3 is a vertical translation of the graph of y=sin x up 3 units. One way to sketch the graph is to first consider y=sin x on an interval of length 2π, say, [0, 2π]. The zeros of the function and the maximum and minimum values can be considered key points. These are
These key points are transformed up 3 units to obtain the key points of the graph of y=sin x+3. These are
The graph of y=sin x+3 can be sketched on the interval [0, 2π] and extended to obtain the rest of the graph by repeating the graph on intervals of length 2π,

The Constant A
Next, we consider the effect of the constant A. What can we observe in the following graphs? What is the effect of the constant A on the graph of the basic function when (a)0<A<1? (b)A>1? (c)−1<A<0? (d) A<−1
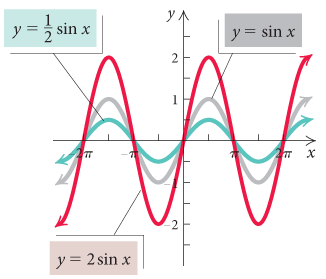

Example 2
Sketch a graph of y=2 cos x. What is the amplitude?
Solution
The constant 2 in y=2 cos x has the effect of stretching the graph of y= cos x. vertically by a factor of 2. Since the function values of y= cos x. are such that −1≤cos x≤1, the function values of y=2 cos x are such that −2≤2 cos x≤2. The maximum value of y=2 cos x is 2, and the minimum value is −2. Thus the amplitude is
We draw the graph of y= cos x and consider its key points,
on the interval [0, 2π]
We then multiply the second coordinates by 2 to obtain the key points of y=2 cos x. These are
We plot these points and sketch the graph on the interval [0, 2π]. Then we repeat this part of the graph on adjacent intervals of length 2π,.

The amplitude of a graph can also be determined by finding |A| from equations of the form y=A sin (Bx−C)+D or y=A cos (Bx−C)+D. In Example 2, y=2 cos x, A=2. Thus the amplitude is |2| or 2.
Example 3
Sketch a graph of y=−12 sin x. What is the amplitude?
Solution
The amplitude of the graph is |−12|, or 12 The graph of y=−12 sin x is a vertical shrinking and a reflection of the graph of y=sin x across the x-axis. In graphing, the key points of y=sin x,
are transformed to

The Constant B
Next, let’s consider the effect of the constant B. Changes in the constants A and D do not change the period. But what effect, if any, does a change in B have on the period of the function? Let’s observe the period of each of the following graphs.


Example 4
Sketch a graph of y=sin 4x. What is the period?
Solution
The constant B has the effect of changing the period. The graph of y=sin 4x is obtained from the graph of y=sin x by shrinking the graph horizontally. The period of y=sin 4x is |2π/4|, or π/2. The new graph is obtained by dividing the first coordinate of each ordered-pair solution of y=sin x by 4. The key points of y=sin x are
These are transformed to the key points of y=sin 4x, which are
We plot these key points and sketch in the graph on the shortened interval [0, π/2].
Then we repeat the graph on other intervals of length π/2

The Constant C
Next, we examine the effect of the constant C. The curve in each of the following graphs has an amplitude of 1 and a period of 2π but there are six distinct graphs. What is the effect of the constant C?


Example 5
Sketch a graph of y=sin (x−π2).
Solution
The amplitude is 1, and the period is 2π. The graph of y=sin (x−π/2) is obtained from the graph of y=sin x by translating the graph horizontally—to the right C units if C>0 and to the left |C| units if C<0. The graph of y=sin (x−π/2) is a translation of the graph of y=sin x to the right π/2 units. The value π/2 is called the phase shift. The key points of y=sin x,
are transformed by adding π/2 to each of the first coordinates to obtain the following key points of y=sin (x−π/2):
We plot these key points and sketch the curve on the interval [π/2,5π/2]. Then we repeat the graph on other intervals of length 2π.

To define phase shift, it is helpful to rewrite
Sketch a graph of y=cos (2x−π). The graph of is the same as the graph of The amplitude is 1. The factor 2 shrinks the period by half, making the period |2π/2|, or π. The phase shift π/2 translates the graph of y=cos 2x to the right π/2 units. Because D=0, there is no vertical translation. Thus, to form the graph, we first graph y=cos x, followed by y=cos 2x and then y=cos [2(x−π/2)].Example 6
Solution

Let’s now summarize the effect of the constants. When graphing, we carry out the procedures in the order listed. Be sure that the horizontal stretching or shrinking based on the constant B is done before the translation based on the phase shift C/B.
Example 7
Sketch a graph of y=3 sin (2x+π/2)+1. Find the amplitude, the period, and the phase shift.
Solution
We first note that
Then we have the following:
Amplitude=|A|=|3|=3,
Period=|2πB|=|2π2|=π,
Phase shift=CB=−π/22=−π4.
To create the final graph, we begin with the basic sine curve, y=sin x. Then we sketch graphs of each of the following equations in sequence.
y=sin 2x
y=3 sin 2x
y=3 sin [2(x−(−π4))]
y=3 sin [2(x−(−π4))]+1

Now Try Exercise 27.
All the graphs in Examples 1–7 can be checked using a graphing calculator. Even though it is faster and more accurate to graph using a calculator, graphing by hand gives us a greater understanding of the effect of changing the constants A, B, C, and D.
Graphing calculators are especially convenient when a period or a phase shift is not a multiple of π/4.
Example 8
Graph y=3 cos 2πx−1. Find the amplitude, the period, and the phase shift.
Solution
First we note the following:
Amplitude=|A|=|3|=3,
Period=|2πB|=|2π2π|=|1|=1,
Phase shift=CB=02π=0.
There is no phase shift in this case because the constant C=0. The graph has a vertical translation of the graph of the cosine function down 1 unit, an amplitude of 3, and a period of 1, so we can use [−4,4,−5,5] as the viewing window.

Now Try Exercise 31.
The transformation techniques that we learned in this section for graphing the sine and the cosine functions can also be applied in the same manner to the other trigonometric functions. Transformations of this type appear in the synthesis exercises in Exercise Set 6.6.
An oscilloscope is an electronic device that converts electrical signals into graphs like those in the preceding examples. These graphs are often called sine waves. By manipulating the controls of the oscilloscope, we can change the amplitude, the period, and the phase shift of sine waves. The oscilloscope has many applications, and the trigonometric functions play a major role in many of them.

Graphs of Sums: Addition of Ordinates
The output of an electronic synthesizer used in the recording and playing of music can be converted into sine waves by an oscilloscope. The graphs at left illustrate simple tones of different frequencies. The frequency of a simple tone is the number of vibrations in the signal of the tone per second. The loudness or intensity of the tone is reflected in the height of the graph (its amplitude). The three tones in the diagrams at left all have the same intensity but different frequencies.

Musical instruments can generate extremely complex sine waves. On a single instrument, overtones can become superimposed on a simple tone. When multiple notes are played simultaneously, graphs become very complicated. This can happen when multiple notes are played on a single instrument or a group of instruments, or even when the same simple note is played on different instruments.
Combinations of simple tones produce interesting curves. Consider two tones whose graphs are y1=2 sin x and y2=sin 2x. The combination of the two tones produces a new sound whose graph is y=2 sin x+sin 2x, as shown in the following example.
Example 9
Graph: y=2 sin x+sin 2x.
Solution
We graph y=2 sin x and y=sin 2x using the same set of axes.

Next, we graphically add some y-coordinates, or ordinates, to obtain points on the graph that we seek. At x=π/4, we transfer the distance h, which is the value of sin 2x, up to add it to the value of 2 sin x. Point P1 is on the graph that we seek. At x=−π/4, we use a similar procedure, but this time both ordinates are negative. Point P2 is on the graph. At x=−5π/4, we add the negative ordinate of sin 2x to the positive ordinate of 2 sin x. Point P3 is also on the graph. We continue to plot points in this fashion and then connect them to get the desired graph, shown below. This method is called addition of ordinates, because we add the y-values (ordinates) of y=sin 2x to the y-values (ordinates) of y=2 sin x. Note that the period of 2 sin x is 2π and the period of sin 2x is π. The period of the sum 2 sin x+sin 2x is 2π, the least common multiple of 2π and π, or 2π.

Now Try Exercise 47.
Damped Oscillation: Multiplication of Ordinates
Suppose that a weight is attached to a spring and the spring is stretched and put into motion. The weight oscillates up and down. If we could assume falsely that the weight will bob up and down forever, then its height h after time t, in seconds, might be approximated by a function like
Over a short time period, this might be a valid model, but experience tells us that eventually the spring will come to rest. A more appropriate model is provided by the following example, which illustrates damped oscillation.
Example 10
Sketch a graph of f(x)=e−x/2 sin x.
Solution
The function f is the product of two functions g and h, where
Thus, to find function values, we can multiply ordinates. Let’s do more analysis before graphing. Note that for any real number x,
Recall from Chapter 5 that all values of the exponential function are positive. Thus we can multiply by e−x/2 and obtain the inequality
The direction of the inequality symbols does not change since e−x/2>0. This also tells us that the original function crosses the x-axis only at values for which sin x=0. These are the numbers kπ, for any integer k.
The inequality tells us that the function f is constrained between the graphs of y=−e−x/2 and y=e−x/2. We start by graphing these functions using dashed lines. Since we also know that f(x)=0 when x=kπ, k an integer, we mark these points on the graph. Then we use a calculator and compute other function values. The graph is as follows.

Now Try Exercise 55.
Visualizing the Graph
Match the function with its graph.
Answers on page A-34
f(x)=−sin x

f(x)=2x3−x+1

y=12 cos (x+π2)

f(x)=cos (12x)

y=−x2+x

y=12log x+4

f(x)=2x−1

f(x)=12sin (12x)+1

f(x)=−cos (x−π)

f(x)=−12x4

6.6 Exercise Set
Determine the amplitude, the period, and the phase shift of the function and sketch the graph of the function.
1. y=sin x+1
2. y=14 cos x
3. y=−3 cos x
4. y=sin (−2x)
5. y=12 cos x
6. y=sin (12x)
7. y=sin (2x)
8. y=cos x−1
9. y=2 sin (12 x)
10. y=cos (x−π2)
11. y=cos (−12x)
12. y=sin (−14x)
13. y=12 sin (x+π2)
14. y=cos x−12
15. y=3 cos (x−π)
16. y=−sin (14x)+1
17. y=13 sin x−4
18. y=cos (12x+π2)
19. y=−cos (−x)+2
20. y=12 sin (2x−π4)
Determine the amplitude, the period, and the phase shift of the function.
21. y=2 cos (12 x−π2)
22. y=4 sin (14 x+π8)
23. y=−12 sin (2x+π2)
24. y=−3 cos (4x−π)+2
25. y=2+3 cos (πx−3)
26. y=5−2 cos (π2 x+π2)
27. y=−12 cos (2πx)+2
28. y=−2 sin (−2x+π)−2
29. y=−sin (12 x−π2)+12
30. y=13 cos (−3x)+1
31. y=cos (−2πx)+2
32. y=12 sin (2πx+π)
33. y=−14 cos (πx−4)
34. y=2 sin (2πx+1)
In Exercises 35–42, match the function with one of the graphs (a)–(h) that follow.


35. y=−cos 2x
36. y=12 sin x−2
37. y=2 cos (x+π2)
38. y=−3 sin 12 x−1
39. y=sin (x−π)−2
40. y=−12 cos (x−π4)
41. y=13 sin 3x
42. y=cos (x−π2)
In Exercises 43–46, determine the equation of the function that is graphed.
43.

44.

45.

46.

Graph using addition of ordinates.
47. y=2 cos x+cos 2x
48. y=3 cos x+cos 3x
49. y=sin x+cos 2x
50. y=2 sin x+cos 2x
51. y=sin x−cos x
52. y=3 cos x−sin x
53. y=3 cos x+sin 2x
54. y=3 sin x−cos 2x
Graph each of the following.
55. f(x)=e−x/2 cos x
56. f(x)=e−0.4x sin x
57. f(x)=0.6x2 cos x
58. f(x)=e−x/4 sin x
59. f(x)=x sin x
60. f(x)=|x| cos x
61. f(x)=2−x sin x
62. f(x)=2−x cos x
Skill Maintenance
Classify the function as linear, quadratic, cubic, quartic, rational, exponential, logarithmic, or trigonometric.
63. f(x)=x+4x [4.5]
64. y=12 log x−4 [5.3]
65. y=x4−x−2 [4.1]
66. 34x+12y=−5 [1.3]
67. f(x)=sin x−3 [6.6]
68. f(x)=0.5ex−2 [5.2]
69. y=25 [1.3]
70. y=sin x+cos x [6.6]
71. y=x2−x3 [4.1]
72. f(x)=(12)x [5.2]
Synthesis
Find the maximum and the minimum values of the function.
73. y=2 cos [3(x−π2)]+6
74. y=12 sin (2x−6π)−4
The transformation techniques that we learned in this section for graphing the sine and the cosine functions can also be applied to the other trigonometric functions. Sketch a graph of each of the following.
75. y=−tan x
76. y=tan (−x)
77. y=−2+cot x
78. y=−32 csc x
79. y=2 tan 12x
80. y=cot 2x
81. y=2 sec (x−π)
82. y=4 tan (14x+π8)
83. y=2 csc (12x−3π4)
84. y=4 sec (2x−π)
85. Satellite Location. A satellite circles the earth in such a way that it is y miles from the equator (north or south, height not considered) t minutes after its launch, where

 y(t)=3000[cos π45 (t−10)].
What are the amplitude, the period, and the phase shift?
86. Water Wave. The cross-section of a water wave is given by
y=3 sin (π4 x+π4),where y is the vertical height of the water wave and x is the distance from the origin to the wave.


What are the amplitude, the period, and the phase shift?
87. Damped Oscillations. Suppose that the motion of a spring is given by
d(t)=6e−0.8t cos (6πt)+4,where d is the distance, in inches, of a weight from the point at which the spring is attached to a ceiling, after t seconds. How far do you think the spring is from the ceiling when the spring stops bobbing?
