6
Cyber Course of Action (COA) Strategies
This chapter examines how decision‐making in cyber defense may benefit from Modeling and Simulation (M&S). The cyber domain presents scale and scope issues that require decision aids to meet the accuracy and timeliness demands for securing the network. The use of “models,” for cyber decision support spans from longer‐term decision support, in categorizing projected network events, to real‐time visualization of developing threats, and using these models to analyze attack graphs and projected second‐ and third‐order effects for each COA candidate.
Developing COAs to respond to cyberattacks is especially challenging with the rise of threat capability, and the number of nefarious actors (Mandiant 2014). Cyber actors have the ability to coordinate (e.g. via botnets [Kotenko 2005]) and scale an attack at time constants potentially much faster than standard human cognition. M&S, in Decision Support Systems (DSS), can enhance situational awareness (SA) through training. The knowledge imparted by M&S, used in the design and development of DSS, trades directly against the technical advantages and experience of a cyber attacker. Understanding how a DSS’ COA effectiveness will be measured is therefore key in DSS design.1
6.1 Cyber Course of Action (COA) Background
6.1.1 Effects‐Based Cyber‐COA Optimization Technology and Experiments (EBCOTE) Project
In 2004, DARPA developed a cyber test bed for real‐time evaluation of COA impact, evaluating performance and effectiveness, for time‐critical targeting systems (Defense Advanced Research Projects Agency [DARPA] 2004). A fundamental challenge for modern Battle Management/Command, Control, and Communications (BMC3) systems is to withstand attacks against their constituent computer and communication subsystems. However, measures to safeguard or respond to a cyberattack against a BMC3 system invariably disrupt the processing flow within that system. Thus, disruptions may ultimately affect mission effectiveness, and a prudent strategy is to predict those impacts before committing to a specific response or safeguard.
EBCOTE studied the problem of quality of service (QoS) assurance in BMC3 systems in the context of a Time Critical Targeting (TCT) scenario, focusing on the mission as a workflow, and determining mission effectiveness based on how the degradation of the underlying IT system affected the mission.
As shown in Figure 6.1, the three research phases of EBCOTE included both offline and on‐line evaluation of mission impact due to BMC3 workflow disruption, including on‐line generation/optimization of cyber COAs.

Figure 6.1 Three research phases in the evolution of the EBCOTE system.
Figure 6.1’s EBCOTE, an early mission modeling success, was expanded on with the broader mission evaluation capability of the “Analyzing Mission Impacts of Cyber Actions” (AMICA) prototype (Noel et al. 2015), more recently promoted by MITRE.
6.1.2 Crown Jewels Analysis
In addition to AMICA, MITRE developed “Crown Jewels Analysis” (CJA) (MITRE), a process for identifying the cyber assets most critical to the accomplishment of an organization’s mission. CJA is also an informal name for Mission‐Based Critical Information Technology (IT) Asset Identification. It is a subset of broader analyses that identify all types of mission‐critical assets (Figure 6.2).
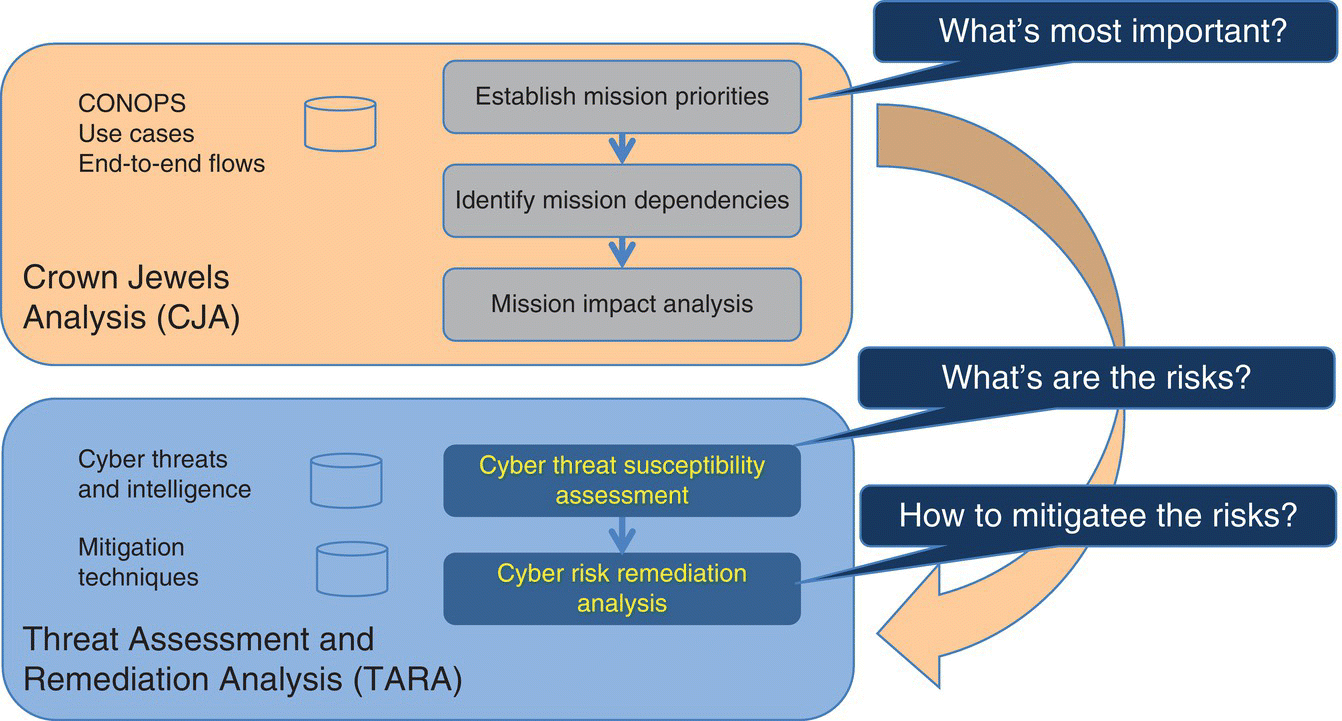
Figure 6.2 The Mission Assurance Engineering (MAE) Process.
Mission Assurance Engineering (MAE) offers a common, repeatable, risk management process that is part of building secure and resilient systems. The underlying premise for performing a CJA, as part of the MAE, is that protection strategies focused entirely on “keeping the adversary out” are challenged by advanced cyber attackers; requiring defenders to maintain vigilance through processes like MAE, informed by a periodic CJA. Because it is difficult and costly to design every component of a system to be hardened against all conceivable attacks, a CJA helps identify the most important cyber assets to an organization’s mission – providing a baseline for systems engineers, designers, and operators to focus on, to ensure that these critical components are secure.
6.1.3 Cyber Mission Impact Assessment (CMIA) Tool
In addition to CJA, the Cyber Mission Impact Assessment (CMIA) is one approach for performing a cyber mission risk assessment (Musman et al. 2013). From a systems engineering perspective, CMIA makes it possible to perform system assessments by simulating the application of potential security and resilience methods to a system within the mission context. Since effective resilience methods either prevent or mitigate the impacts of cyber incidents, when combined with the probability that bad events will occur, the impacts computed by CMIA address the “amount of loss” part of the risk equation. The CMIA tool extensions include combining it with a topological attack model to support mission assurance assessments and return‐on‐investment calculations.
The creators of CMIA have developed their own cyber mission impact business process modeling tool. Although it implements only a functional subset of business process modeling notation (BPMN), it has, unlike the more generic COTS tools, been specifically designed for the representation of cyber processes, resources, and cyber incident effects. As such, it more naturally supports the functionality needed for CMIAs and makes it unnecessary for modelers to clutter a model with extraneous content that ends up making those models harder to develop, comprehend, or maintain, once they have been built.
Business process models can be used to represent mission systems in the context of their execution of mission threads. A mission thread represents a precise, objective description of a task. In other words, a mission thread is a time‐ordered, operational event description that captures discrete, definable interactions among mission resources, such as human operators and technological components. After defining testable measures of effectiveness (MOE), measures of performance (MOP), and key performance parameters (KPP) for the modeled mission, the process model captures how the performance of mission activities contributes to achieving them (Figure 6.3).
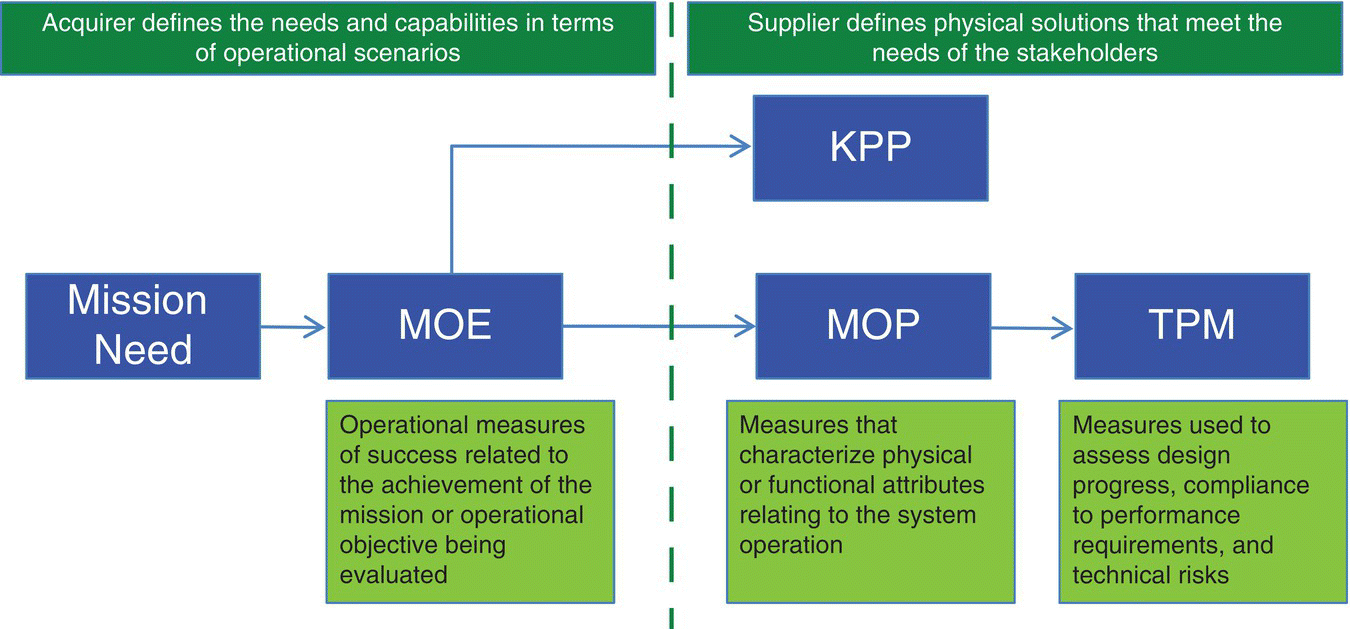
Figure 6.3 Mission needs, MOPs, MOEs, and KPPs.
Since a process model captures activity, control, and information flows, it is possible to evaluate alternate variants of resource assignments, information, and control flows in order to assess potential architecture improvements. For example, flexibly increasing nodal capacity, by leveraging the cloud (Hariri et al. 2003), might improve resiliency for defensive scenarios. Another example might be to develop an MOP for trained operators increasing consistency in security practices, ensuring good housekeeping keeps the local network in good working order.
6.1.4 Analyzing Mission Impacts of Cyber Actions
Analyzing Mission Impacts of Cyber Actions (AMICA) provides an approach for understanding the broader mission impacts of cyberattacks (MITRE 2015; Noel et al. 2015). AMICA combines process modeling, discrete‐event simulation, graph‐based dependency modeling, and dynamic visualizations. This is a novel convergence of process modeling/simulation and automated attack graph generation.
6.1.4.1 AMICA and Process Modeling
As shown in Figure 6.4, AMICA, similar to EBCOTE, models a mission and includes the respective mission entity IT dependencies via a multilayered architecture. Network mapping tools (e.g. NMAP, Nessus, etc.) are used in the real world to validate the dependencies between the respective mission nodes and supporting IT infrastructure.
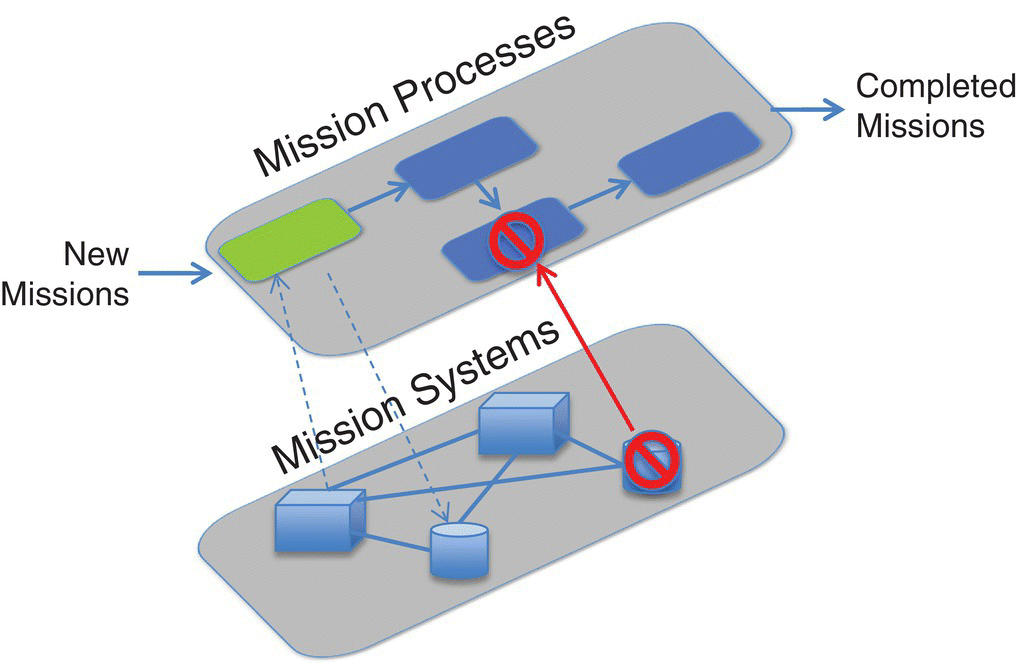
Figure 6.4 AMICA – Information Technology (IT) to mission simulator.
AMICA’s ability to evaluate COA possibilities is similar to the EBCOTE work in evaluating mission impacts due to supporting IT anomalies.
6.1.4.2 AMICA and Attack Graphs
Attack graphs focus purely on the supporting IT layer’s nodes, as described in Figure 6.4. One of the goals of using attack graph analysis is to find the “reachability,” or potentially vulnerable connections, in the supporting IT system. A formal attack graph is defined in Equation (6.1) (Wang et al. 2006; Jajodia et al. 2015).
As shown in Figure 6.4, mission processes are dependent on underlying mission systems, often in the form of a computer system that is vulnerable to cyber attack. AMICA therefore provides the mission impact, often in the form of availability, due to an underlying system’s cyber compromise.
6.2 Cyber Defense Measurables – Decision Support System (DSS) Evaluation Criteria
While Cyber “Observe Orient Decide Act” (OODA) loops (Gagnon et al. 2010) have been explored in previous research, identifying the observables remains a challenge in DSS development. For example, the cyber defender, for whom the DSS is designed to serve, is tasked with securing the network over a range of performance metrics, for a given attack scenario. If the threat is unknown, or in a large system, and the impact of a certain COA is uncertain, M&S contributes by looking at the impact of an attack and determining mitigation strategies from there. As shown in Table 6.1, COAs can leverage Table 6.1’s metrics in determining how to evaluate models at different abstraction levels.
Table 6.1 Cyber Decision Support System (DSS) metrics and example use.
| Metric | Example use | Collectible |
| Measure of Policy Effectiveness (MOPE) |
|
|
| Measure of Enterprise Effectiveness (MOEE) |
|
|
| Measure of System Effectiveness (MOSE) |
|
|
| Measure of Performance (MOP) |
|
|
Policy Effectiveness, somewhat novel to a technical audience, is an approach that has worked for industrial, automobile, and aircraft safety (Economist). In addition, Table 6.1 shows that there are a variety of approaches for evaluating a given system, based on the level of decision making the DSS is designed to provide. DSS COAs have the somewhat conflicting requirements of being fast, accurate, and current. Meeting these objectives implies focusing respective DSSs on the right abstraction level, measured in the right way (Table 6.1).
Determining the correct level of abstraction, and associated metric(s), is a recurring challenge. One approach is to leverage use cases, or scenarios, to evaluate DSS use. Evaluating possible scenarios at each of these levels is amenable to “Data Farming,” or design of experiments (DOE), for rapid prototyping for different possible scenarios.
As shown in Table 6.1, system metrics provide the DSS developer an opportunity to specify, or evaluate, system performance, in terms of measurables, during the project’s design phase. Other considerations during the DSS’ design include the cognition enhancements that the system will provide. For example, cyber SA is commonly denominated in “network events,” activity monitored by Security Information and Event Management (SIEM) tools, thereby distilled to a current system state representation.
6.2.1 Visual Analytics
In modern defense and security operations, analysts are faced with ever‐growing data sets, widely scoped, that cause significant information overload problems and prevent good situation awareness. Visual Analytics (VA) is a way of handling and making sense of massive data sets by using interactive visualization technologies and human cognitive abilities. Defense R&D Canada conducted a review (Lavigne and Gouin 2014) of the applicability of VA to support military and security operations.
6.2.1.1 Network Data – Basic Units of Decision Support Systems (DSSs)
Network events, data centric, the common currency of monitoring and control, are the basis for SIEM tools. While SIEM can be comprehensive, by including insider threat integration (Callahan 2013), the scale of current IT systems (i.e. the number and variety of events) makes event monitoring for administrators a “Big Data” issue (Grimaila et al. 2012).
6.2.1.2 Big Data for Cyber DSS Development and Evaluation
While SIEM tools naturally use large data sets collected on a system of interest, the broader concept of quality stems from focused application of data resources to manufacturing. For example, the basics of data evaluation, popularized by quality control (Deming 1967; Deming 2010), provides a basis for the collection and manipulation of evidence for cyber domain decision making2; as it does for other domains. The application of Deming’s work, popularized by the success of the Japanese auto industry, led to the revolutionizing of both the auto industry and manufacturing in general.
While Deming’s use of data for manufacturing quality management is well known, now, this was a very complicated subject only a few decades ago, when computers were first being introduced to front offices and the factory floor. Similar to contemporary “cyber,” getting a handle on “quality” was a seemingly qualitative and semi‐subjective pursuit, requiring the development of policies and processes to solidify lessons learned.3 This innovative use of computers, and data, led to unprecedented improvements across society.
6.2.1.3 COMPSTAT and People Data
In addition to manufacturing quality, early successes of “big data” include COMPSTAT (Henry 2002), a tool that law enforcement uses to evaluate urban zones for specific crime increases, with the idea of prescribing the right kinds of policing via data‐based decision making. COMPSTAT’s use of “hot spots” to direct emergency responders, led to geometric crime decreases in New York, Chicago, Los Angeles, and Washington DC immediately after adoption in the 1990s.
While cluster evaluation is common to data analysis, “hot spots” give an additional frequency, recency, and likelihood view of empirical data. In the case of cyber, this information is log data, describing legitimate and nefarious user interaction with the system of interest. COMPSTAT’s lesson for cyber practitioners is the mixing of policy with technical collection, sometimes a challenge in the computer science‐centric community of cyber practitioners.
Leveraging empirical data for DSS development complements cyber defense via ease of on‐line data collection. In addition, due to the widely scoped nature of cyber threats, both open‐source centers and information analysis centers are popular data sources. An example commercial cyber DSS that spans from data collection to intelligence reporting is provided in Figure 6.5.

Figure 6.5 Cyber decision support system.
Figure 6.5’s DSS will require continual updating and leveraging of cyber counterintelligence capabilities (Duvenage and von Solms 2013) to stay current with the threat. Industry publications, examples of which are shown in Section 12.1.3, provide valuable updates concerning the cyber threat, and how it may be changing. Understanding the data is a challenge – visualization may provide insight into relationships in threat data.
6.2.2 Managing Cyber Events
Figure 6.5’s longer‐term system evaluation is complemented by leveraging the “hot spot” multidimensional description of the event. This is a near real‐time approach for enabling response teams to understand as much information as possible when responding to an event. In addition, these data sets can be used as an evaluation system for understanding progress of the remediation COA. Longer‐term analysis will require more advanced data evaluation, such as data farming.
6.2.2.1 Data Farming for Cyber
“Data Farming,” as used by the NATO Modeling and Simulation Group (NMSG)‐124, is another option for the examination of multiple variants of a scenario within a very short time frame; along with semi‐automatic analysis of extensive simulation experiments. Data Farming (Choo et al. 2008), one example for rapidly evaluating many possible alternatives, can be applied to:
- quantitative analysis of complex questions
- sensitivity studies
- stable system states and their transitions
- creating a “Big Picture” solution landscape
- enabling “what if” analyses
- gaining robust results
Valid models provide opportunities to anticipate the impacts of alternative COAs, comparing them before taking action – providing the “best” COA for a given scenario. The result may be a dynamic checklist showing different COAs and the expected gains (quality of mitigation) and losses (limitation of services).
In addition to using Data Farming to experiment with the possible COAs, the next natural question is how to understand the accuracy and bounds for a particular DSS. Given that a DSS is a software system, and we believe that indigenous system risk can be captured with PPPT (Chapter 10). Verification, Validation, and Accreditation (VV&A) is one approach for ensuring that a system meets its designed, and intended, use. Performing cyber DSS COA VV&A, while aspirational at this point due to the limited empirical data sets on both the threat and associated responses, is available via the recent General Methodology for Verification and Validation (GM‐VV) (Roza et al. 2013) for estimating the confidence level in candidate COAs.
6.2.3 DSS COA and VV&A
While COA simulations range from actual botnet evaluations (Kotenko 2005) to team‐based training, it is a useful exercise to determine, at the beginning of a DSS design, both how we will be evaluating the DSS and the boundaries of its intended use. Formal processes (Roza et al. 2013) exist to ensure that a system meets its intended use (Figure 6.6).

Figure 6.6 General Methodology for Verification and Validation (GM‐VV) technical framework design and operational use concept.
Figure 6.6 provides a standard approach for implementing VV&A on a DSS and its respective COAs. More general, M&S‐based approaches (Zeigler and Nutaro 2016) add flexibility that may be required in the cyber domain. Use of the GM‐VV will likely provide leadership the confidence that a given cyber defense measure has been clearly thought through.
6.3 Cyber Situational Awareness (SA)
While long considered an important aspect of strategic and theatre planning, SA is the linchpin for both cyber planning and execution. As stated in Joint Doctrine (Joint Chiefs of Staff 2014), before military activities in the information environment can be accurately and effectively planned, the “state” of the environment must be understood (Robinson and Cybenko 2012). At its core, cyber SA requires understanding the environment in terms of how information, events, and actions will impact goals and objectives, both now and in the near future. Joint Information Operations (IO) doctrine defines the three layers of information as the physical, informational, and cognitive, as shown in Figure 6.7 (Joint Chiefs of Staff 2014).
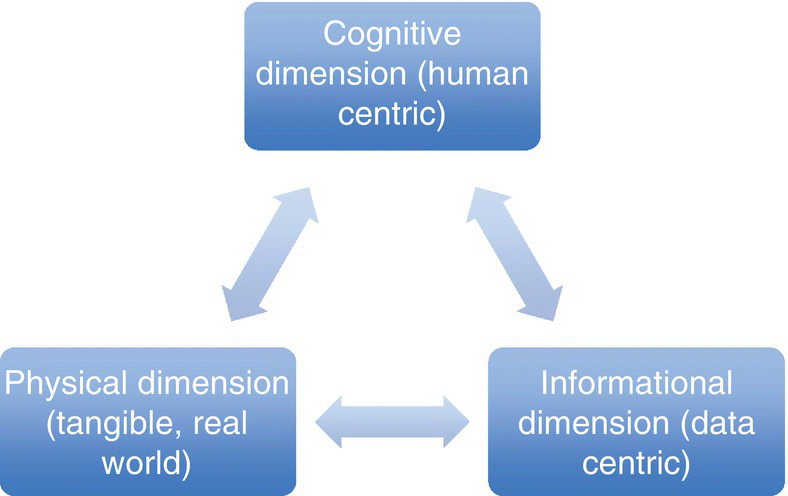
Figure 6.7 Three layers of Information Operations – physical, informational, and cognitive.
The majority of cyber work is currently focused on the physical and informational aspects of the network to inform cyber SA. This includes leveraging available network data for time saving, and high‐quality, analysis of current cyber events.
6.3.1 Active and Passive Situational Awareness for Cyber
A simple decomposition of SA modalities includes “active” and “passive,” as shown in Table 6.2.
Table 6.2 Situational Awareness and available M&S tools for improving cyber defense decision making.
| Situational Awareness (SA) modality | M&S decision support improvement tools |
| Passive (i.e. “collect and collate”) approaches | Understand network state via event rankinga and subsequent parsing (e.g. event management) Visual Analytics (VA) is a way of handling and making sense of massive data sets (e.g. Big Data) |
| Active approaches | Use of “spoofing” tools (e.g. mirror networks) to distract attackers and monitor their behavior Use of “Bots” to automatically respond, when authorized, to identified threats (Zetter 2014) |
a Experimental results indicated that when administrators are only concerned with high‐level attacks, impact assessments could eliminate a mean 51.2% of irrelevant data. When only concerned with high‐ and medium‐level attacks, a mean of 34.0% of the data was irrelevant. This represents a significant reduction in the information administrators must process (Raulerson et al. 2014).
As shown in Table 6.2, an example use of M&S assisting cyber is automating response (Raulerson et al. 2014) to events that are beyond an operator’s sensory or temporal capabilities. For example, while modern computer networks and subsequent cyberattacks grow more complex each year, analyzing associated network information can be difficult and time consuming. Network defenders, routinely unable to orient themselves quickly enough to determine system impact, might be helped by automated systems to find and execute event responses to minimize damage. Current automated response systems are mostly limited to scripted responses based on data from a single source.
6.3.2 Cyber System Monitoring and Example Approaches
Leveraging what we learned from Chapter 2’s assessments, these evaluations provide a ready baseline for developing the metrics and measures for situation awareness. Most of the risk assessment frameworks provide enough information for this first step in developing SA. For example, DHS CSET (Department of Homeland Security [DHS]) or NIST’s Baldridge Cybersecurity Excellence Builder process, in providing a cyber risk self‐assessment, provides users with a baseline for their current use of cybersecurity policies and frameworks, helping an organization to shore up its resilience strategy before moving on to the technical monitoring. One approach (Amina 2012) performs adaptive cyber‐security analytics that include a computer‐implemented method to report on network activity. A score, based on network activity, and using a scoring model, indicates the likelihood of a security violation.
An additional SA approach is provided by Siemens (Skare 2013), in providing an integrated command and control user interface to display security‐related data (e.g. log files, access control lists, etc.). In addition, this approach provides a system security level and interfaces with a user to update system security settings for an industrial control system based on the security‐related data collected. This includes remote updating of access controls.
While there are many more examples of patented approaches (e.g. in Chapter 12) for helping with cyber evaluation, we will keep our focus to more specific M&S tools; leveraging conceptual models (e.g. OODA) is one way to keep this focus.
6.4 Cyber COAs and Decision Types
If the threat is unknown, or in a large system, and the impact of a certain COA is uncertain, M&S contributes by looking at the impact of an attack and determining mitigation strategies from there. As shown in Table 6.1, COAs leverage Table 6.1’s metrics in determining the right level of model abstraction, and their associated metric(s). While Data Farming (Section 6.2.2.1) helps once the model and scenario are determined, it is still a challenge to decide which scenario best represents the future set of decisions, and associated COAs, for the projected cyber threat. Figure 6.8 provides an example “what, how, and why” diagram of the key cyber terrain, CSCs and SIEM data acquisition, for making decisions about protecting a cyber enterprise.
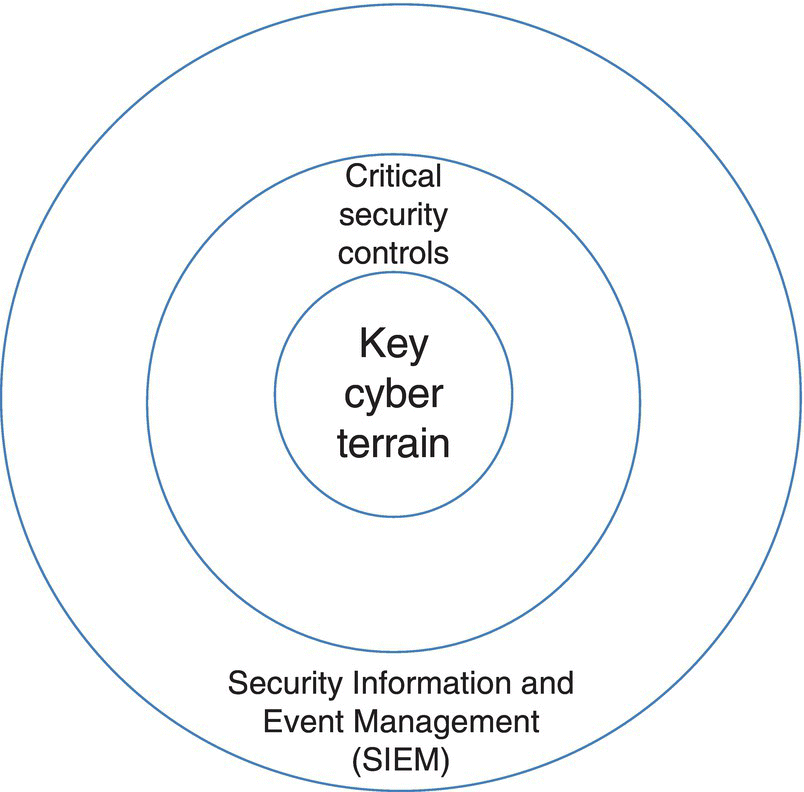
Figure 6.8 SIEM data, CSCs, and key cyber terrain – the what, how, and why of cyber decision making.
The dynamic nature of cyberattacks, their evolution in both frequency and effectiveness, requires a corresponding flexibility in security policy and associated technical responses to ensure real‐time effectiveness. While a Disaster Recovery/Continuity of Operations (DR/COOP) plan is a key part of an organization’s security planning, shorter‐term attacks require a persistent SA and rapid response capability; automating some courses of action. An overview of a COA structure is shown in Figure 6.9.
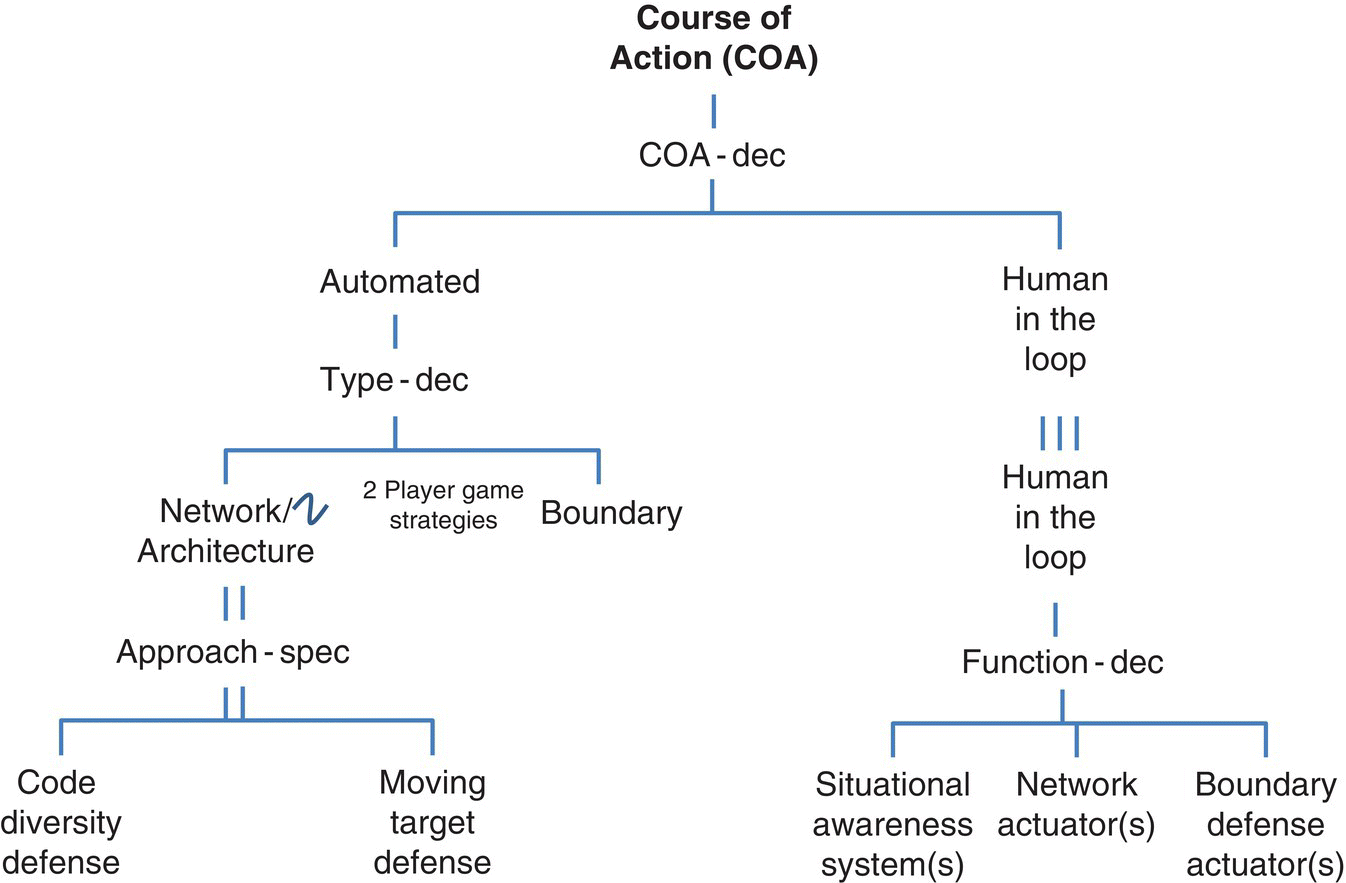
Figure 6.9 Course of Action implementations (automated and human assisted).
As shown in Figure 6.9, automated and human‐assisted COA implementations provide a simple demarcation between (i) the traditional human‐assisted system (e.g. SIEM, etc.) and (ii) automated systems, which are called out by the Critical Security Controls (CSCs) and described by tools.
6.5 Conclusions
An immediate application of COA understanding is the building of training simulators, leveraging legacy military training knowledge, and inserting cyber into computer‐assisted exercises (CAX) to determine COA effectiveness. Constructive simulation plays a role in developing CAX emulators and determining the high‐risk scenarios where training is required. In addition, current events (e.g. Estonia, Georgia, etc.) provide examples of threat scenarios where modeling and training are required for effective future response.
6.6 Further Considerations
Due to the broadly scoped cyber threat, formulating a defense can be a challenge. One approach to coordinating the multiple phenomenologies is to use a Network Tasking Order (Compton et al. 2010). The NTO, using known cyber metrics (Table 6.1) for DSS design, provides a measure for better understanding how secure we are over a particular threat scenario.
6.7 Questions
- 1 What is the difference between a COA for cyber and a COA for physical security defense planning?
- 2 What is the difference, in potential tools, between offline and on‐line tools in doing an evaluation for EBCOTE?
- 3 What are the two main elements of AMICA cyber evaluation?
- 4 How does an attack graph inform a COA?
- 5 Where do process models fit into Figure 6.5’s cyber DSS?
- 6 What are the key differences between passive and active SA?
- 7 How is a mirrored domain fundamentally different from a honey pot?
