3
Introduction to Cyber Modeling and Simulation (M&S)
Emergency responders (e.g. police, fire fighters, etc.) commonly use training exercises to develop both individual and team skills for known scenarios. These exercises, simulations of real events, are often categorized as “modeling and simulation,” with simulacra of real entities composing the “models” in these events. Cyber defenders’ use of M&S is relatively new.
As described in Chapter 2, analytic models are used to evaluate cyber system risk via assessment frameworks. Combining these legacy IA frameworks with developing cyber modeling theory provides a foundation for tools that perform the “what if” analyses enabling a science of cyber security.
3.1 One Approach to the Science of Cyber Security
Cyber M&S will be the tools through which future engineers and technologists practice a Science of Cyber Security. Kott (2014), for example, provides a cyber description based on a defense against malicious software with the following definition:
“… the domain of science of cyber security is comprised of phenomena that involve malicious software (as well as legitimate software and protocols used maliciously) used to compel a computing device or a network of computing devices to perform actions desired by the perpetrator of malicious software (the attacker) and generally contrary to the intent (the policy) of the legitimate owner or operator (the defender) of the computing device(s).”
In addition, Kott (2014) notes that the key objects of research in cyber security should be:
- Attacker, A, along with the attacker’s tools (especially malware) and techniques Ta.
- Defender, D, along with the defender’s defensive tools and techniques Td, and operational assets, networks, and systems Nd.
- Policy, P, a set of defender’s assertions or requirements about what event should and should not happen; simplifying to the cyber incidents, I, that should not happen.
Kott generalizes cyber security to Equation (3.1)’s 4‐tuple, M, as shorthand for expressing what we might expect to encounter in a cyber incident:
Equation 3.1: Network model taxonomy description.
- I: cyber incidents, events that should not happen
- Td: defender’s defensive tools and techniques
- Nd: defender’s operational assets, networks, and systems
- Ta: attacker’s tools (e.g. malware) and techniques
Equation (3.1) provides an extensible representation for an overall cyber modeling framework, accounting for a behavioral view of cyber security, at a higher level of abstraction than the current Confidentiality, Integrity, and Availability (CIA) models of network defense. The value of Equation (3.1) is that an analyst can see the entire cyber problem space without getting lost in details, a common challenge with constructive modeling.
Kott’s 4‐tuple compliments the recent National Academy of Sciences study (Millett et al. 2017) findings in looking at institutional improvements required to develop a science of cyber security. Key findings include:
- Enabling Research – current, high‐frequency, publishing rhythm can leave current literature conclusions a challenge to duplicate; the suggestion is to do longer‐term projects that provide results that enable the readers to replicate results.
- Cyber as an Interdisciplinary Field – social science aspects, in dealing with the human interface to computer‐based systems, affect all aspects of cyber security, from policy through technology; one suggestion is that new doctoral students should have a double major that includes both a technical and social science discipline, if working on cyber security.
In addition to Kott’s concise 4‐tuple, and the National Academies’ recommendations on cyber, Couretas (2017) provides an overview of M&S maturity for the developing science of cyber security in.
3.2 Cyber Mission System Development Framework
Kott’s 4‐tuple, outlining the space for modeling a science of cyber security, is complemented by a conceptual model that adds mission context for contemporary cyber operations. For example, cyber mission systems, elements covered in the DoD’s Cyber Science and Technology (S&T) Priority Steering Council Research Roadmap, are shown in Figure 3.1, and span from the effects desired (right‐side of Figure 3.1) to the sensors and situational awareness (left side of Figure 3.1). In addition, desired architectural characteristics (e.g. trust, assuredness, and agility) are described in a hierarchical fashion as the system builds through the center of the diagram.
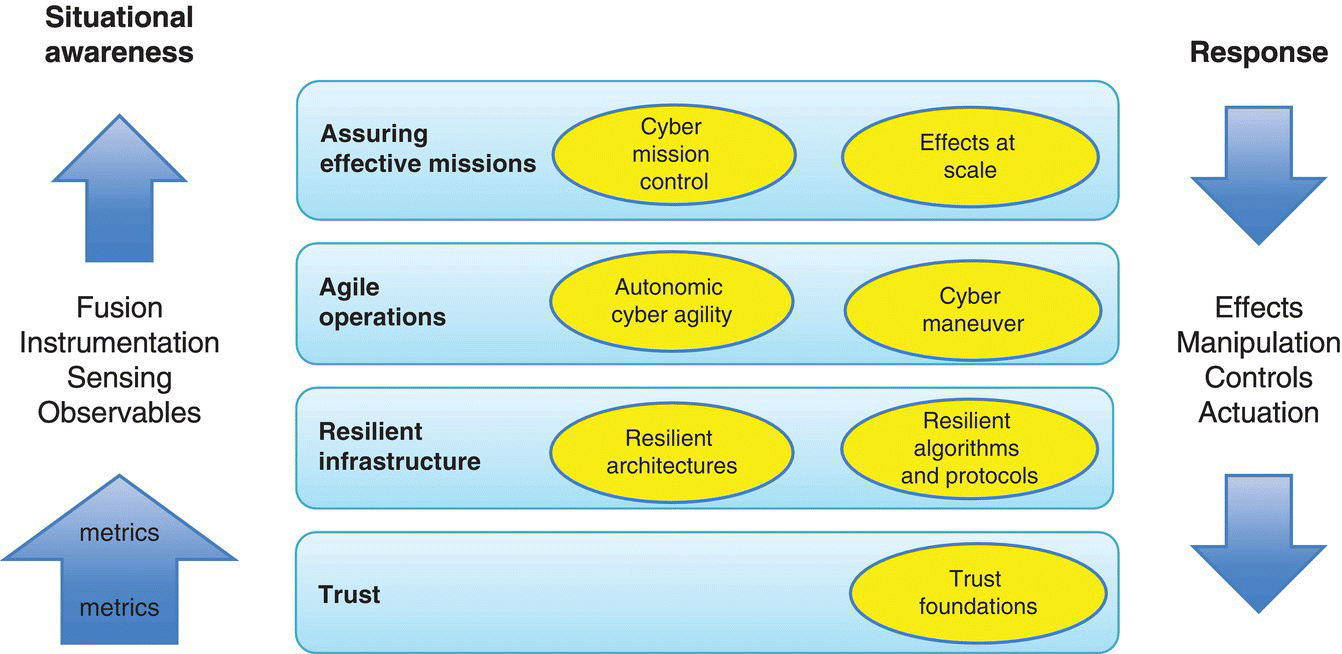
Figure 3.1 DoD’s cyber S&T priority steering council research roadmap (King 2011).
Figure 3.1’s cyber mission system components provide the high‐level elements and capabilities desired in an overall system. In addition, Figure 3.1 is a conceptual model, laying out the effects desired from a constructed system. The middle tiers provide example metrics that the system will be designed to accomplish. The left side is monitored via an experimental frame during development, through real‐world sensors in practice.
3.3 Cyber Risk Bow‐Tie: Likelihood to Consequence Model
One way to look at Figure 3.1 is as an overall architecture description, each instance of which will require a system security evaluation similar to Figure 3.2’s “bow‐tie,” which shows how different controls and countermeasures fit along hypothetical attack paths (Nunes‐Vaz et al. 2011, 2014).
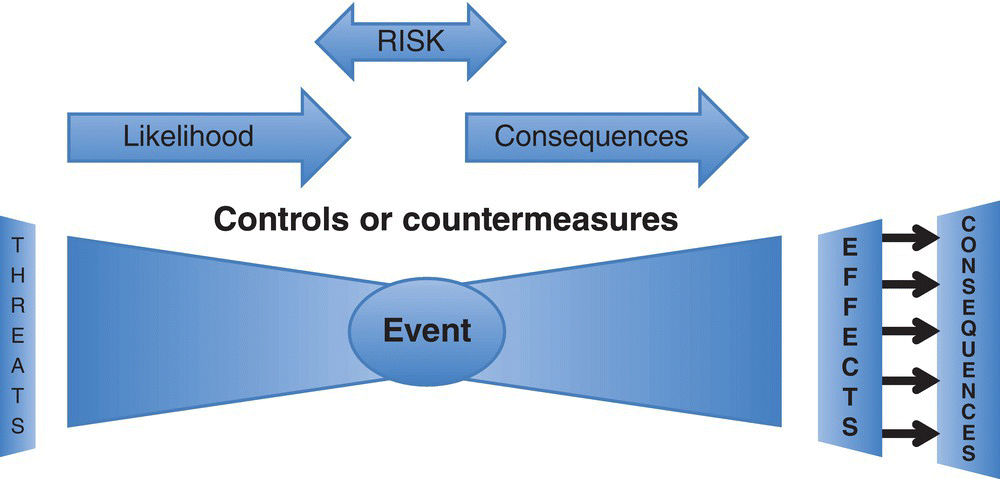
Figure 3.2 Cyber risk “bow‐tie” – prevention, attack, and remediation.
As shown, the left side of Figure 3.2 works to minimize the risk of a cyberattack, leveraging (Chapter 2, Table 2.1)’s system risk characterization, while the right side of Figure 3.2 provides the resilience, or consequence management, required to handle a cyberattack currently under way. In addition, Figure 3.2 was developed with the ISO 31000 risk standard in mind.
From either an attacker or a defender’s perspective, Figure 3.2’s “bow‐tie” provides an overview of the threats, events, and consequences of a cyberattack. In addition, Figure 3.2’s attack cycle will be informed over the course of an attack, with metrics defined by the enterprise’s policy prescription.
3.4 Semantic Network Model of Cyberattack
Figure 3.2 provides a method for looking at the life cycle of an attack, and the types of actions that will take place before, during, and after an attack. Figure 3.3 attempts to provide a semantic model (Yufik 2014) of the key entities leveraged throughout Figure 3.2’s bow‐tie.
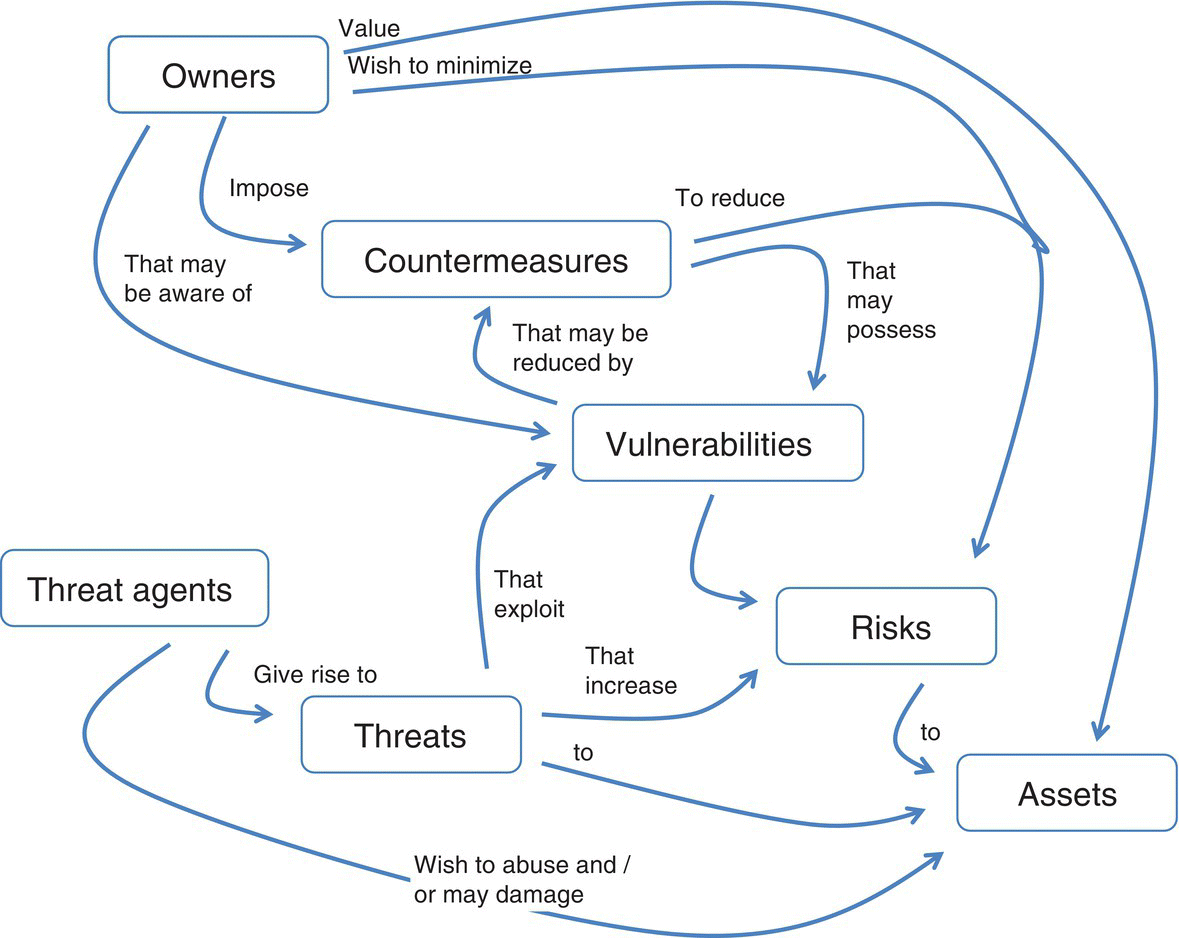
Figure 3.3 Semantic network of current and anticipated threats (Yufik 2014).
A goal, when putting together Figures 3.2 and 3.3’s descriptions, is to test each of the respective controls (Figure 3.2’s left side), or attack counter measures (Figure 3.2’s right side), as a means of Course of Action (COA) evaluation. This kind of testing, currently performed on real equipment, or emulators (e.g. a cyber range), is a key area where modeling may contribute to COA strategy evaluation (e.g. automated defenses, moving target representations) (Okhravi et al. 2013a, b). Leveraging the overall flow of Figure 3.2, we will use Figure 3.4 for cyber model construction efforts.

Figure 3.4 Scenarios through model development approach.
As shown in Figure 3.4, our approach begins with scenarios, looking at courses of action (COAs) and associated models that may apply. Scenarios, as provided in Figure 3.4, are proposed here as a more generalized structure than the use cases (Figure 3.5) that ideally guide the way for the categorizing and measuring cyber phenomena.

Figure 3.5 Cyber analysis elements.
While Figure 3.5 provides an idealized distillation of capturing cyber phenomena, an overall diagram that includes each of the cyber M&S elements is shown in Figure 3.6.
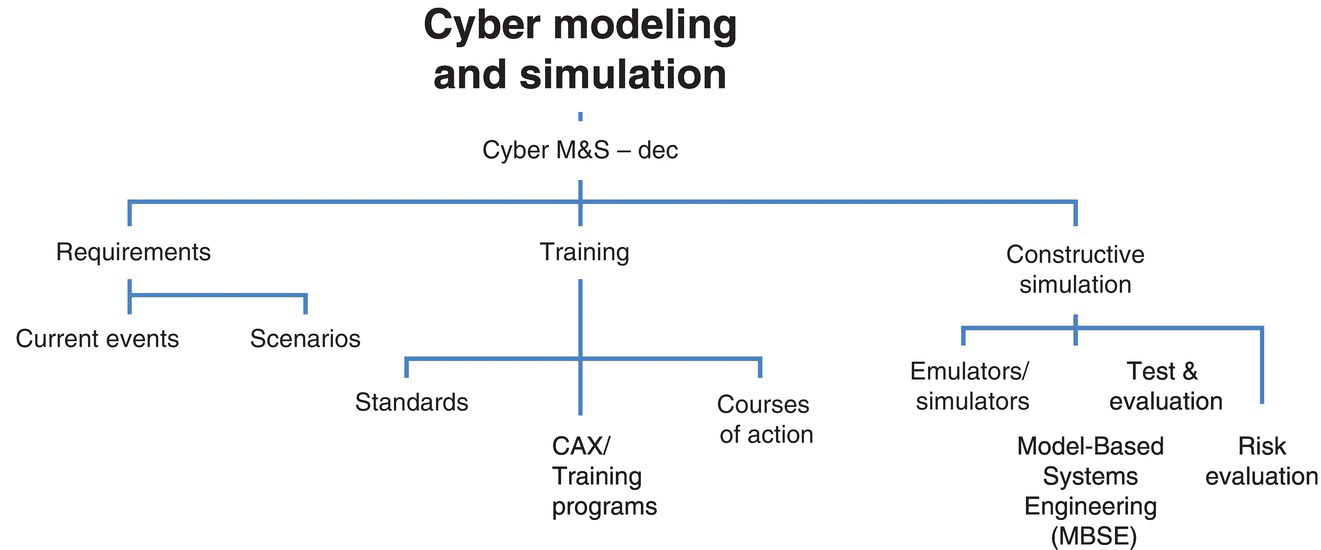
Figure 3.6 Cyber modeling and simulation elements.
Figure 3.6 brings out the overlapping, and complex, terrain that makes up cyber modeling and simulation. In most modeling, using current events for scenario construction is an ideal baseline to launch a simulation that provides COAs insights. Figure 3.7 is a behavioral depiction of state model for an attacker compromising the CIA of a network (Leversage and Byres 2007).
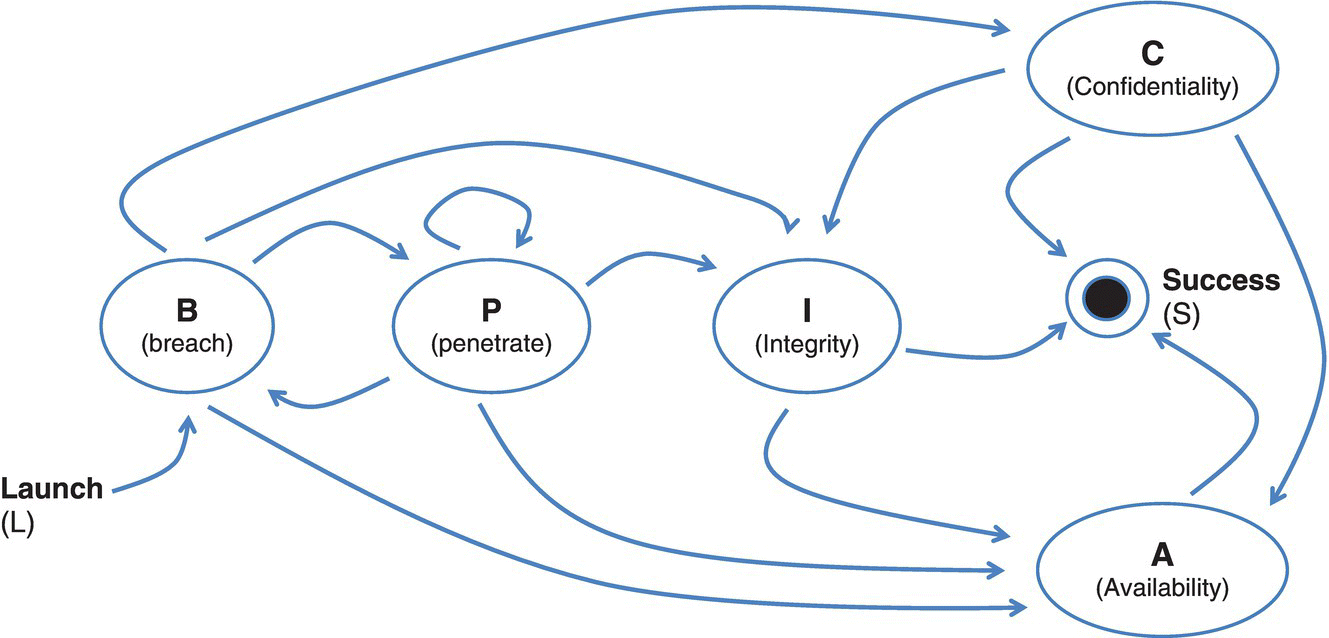
Figure 3.7 State model of attacker (behavioral example).
As shown in Figure 3.7, “modeling” may occur at a higher level of abstraction (e.g. behavioral), with scenarios/COAs expressed in the same context.
3.5 Taxonomy of Cyber M&S
A recent NATO taxonomy and literature review (Lange et al. 2017) for common types of models in cyber defense is shown in Table 3.1.
Table 3.1 Taxonomy and models for cyber defense.
| Modeling type | Description |
| Emulation | Emulation (often with simulation) of networks: actual hardware, software, and humans (e.g. cyber ranges) |
| Training | Training‐focused simulations: presenting to human trainees the effects of a cyberattack without modeling underlying processes |
| M&S of human cognitive processing of cyber events and situations | Perception, recognition, situational awareness (SA), and decision making |
| M&S of attack progress and malware propagation |
|
| Abstract wargaming | Game‐theoretic model of cyber conflict without modeling the underlying processes of cyberattack and defense |
| Business process models | Defense, offense, and business processes, along with business information technology architecture, simulated for observing effects |
| Statistical models of cyber events | Cyber processes represented as, for example, equations of stochastic processes, and coefficients learned from real events, or a training data set |
| Two classes of models that support cyber modeling, but do not model cyber aspects |
|
Table 3.1’s model summary provides an overview of the types of cyber M&S applications observed in the “Model‐Driven Paradigms for Integrated Approaches to Cyber Defense” (NATO IST‐ET‐094) study Lange et al. 2017). One implementation of a cyber model, a first step, is constructive modeling of a cyber system for situational awareness.
3.6 Cyber Security as a Linear System – Model Example
At a slightly lower level of abstraction, a cyber model is developed through leveraging dependencies. This includes modeling incomplete and noisy observations via integrating Bayesian network, Markov, and state space models (Cam 2015). Cam’s approach accounts for the inherent ambiguity in cyber environments and uses defined asset dependency and criticality to construct alternative mission paths. This includes leveraging observability to characterize the system state for assessing potential weaknesses and vulnerabilities; and proving the controllability to steer a network with some compromised components towards a desired state within finite time. For example, consider a network of N nodes/clients, where
Equation 3.2: Cyber as a linear systemG(t): the number of those nodes that do not have any known vulnerability at time t.
- V(t): the number of those nodes that have some known vulnerabilities at time t, but are not exploited yet.
- C(t): the number of those nodes that are compromised partially/fully through the exploitation of their vulnerabilities.
- E(t): the number of those nodes that are evicted due to their not being recoverable.
- F(t): the number of those nodes that have failed and do not operate due to physical failures.
We can control the states and operation of nodes by P(t) and R(t); we can measure C(t) and V(t).
- input 1: P(t); input 2: R(t).
- R(t): recovery support services rate.
- P(t): patching support services rate.
- o(t0): vulnerability occurrence rate.
- p(t0): vulnerability patching rate.
- e(t0): vulnerability exploitability rate.
- r(t0): compromised systems’ recovery rate.
- d(t0): cyber‐compromised node eviction rate.
- f(t0): physical failure rate.
Figure 3.8, which could be looked at as an epidemiology model, provides a high‐level view of system performance, with the potential for measuring both performance and effects based on current network state.
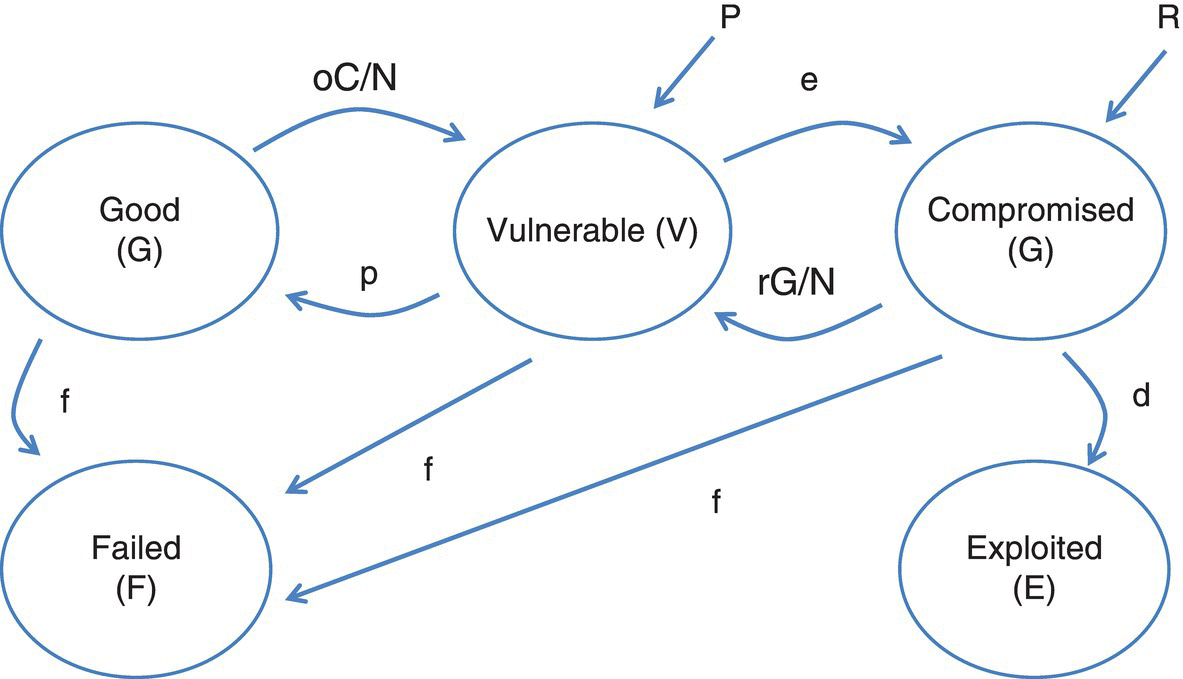
Figure 3.8 Cyber security as a linear system (Cam).
3.7 Conclusions
Dr. Cam’s constructive modeling approach is one example of a roll‐up description that provides for both system evaluation and situational awareness to ensure that system behavior is in‐line with expected performance. This example fits nicely with the span of developing cyber models, from training through analytic failure analysis. These models are a valuable step forward in the construction of a Science of Cyber Security, as proposed by both the National Academy of Sciences and Dr. Alexander Kott.
While the expanding scope of cyber modeling requires ongoing literature reviews to understand how the field is developing, significant progress has been made in recent years, as described by Dr. Kott’s n‐tuple model, more explicitly in Cam’s linear system description. These models, along with the broader understanding of the attack lifecycle provided by the risk bow‐tie, provide fertile terrain for the continuing use of M&S to leverage scenarios in testing, and evaluating proposed and operational systems.
3.8 Questions
- 1 Why is risk evaluation, as used in Information Assurance, not part of the standard domain of M&S?
- 2 Name two examples of resilient architectures and/or resilient algorithms and protocols that cyber M&S can help evaluate for effectiveness or performance?
- 3 How is cyber mission control achieved now? Situational Awareness?
- 4 How might the cyber risk bow‐tie (Figure 3.2) be modeled?
- A Analytically
- B With event‐based modeling
- C With knowledge elicitation techniques
- 5 In using the “state Model of an Attacker,” (Figure 3.7) is it true that “Success” is reachable from each of the C, I, or A phases of an attack?
- 6 How are the respective models in Table 3.1 related?
- A Input/output relations
- B Tradeable alternatives
- 7 How might Cam’s linear system model of cyber security be used to provide Situational Awareness for a network {%G, %V, %C, %E, %F}
- A How might this approach be used to talk about the maturity level (Chapter 2) of a proposed system?
