

Chapter Five
ACCUMULATED CHANGE: THE DEFINITE INTEGRAL
Contents
5.1 Distance and Accumulated Change
A Thought Experiment: How Far Did the Car Go?
Visualizing Distance on the Velocity Graph
Visualizing Distance on the Velocity Graph: Area Under Curve
Approximating Total Change from Rate of Change
Improving the Approximation: The Role of n and Δt
Writing Left- and Right-Hand Sums Using Sigma Notation
Taking the Limit to Obtain the Definite Integral
Estimating a Definite Integral from a Table or Graph
Rough Estimates of a Definite Integral
5.3 The Definite Integral as Area
Relationship Between Definite Integral and Area
5.4 Interpretations of the Definite Integral
The Notation and Units for the Definite Integral
5.5 Total Change and the Fundamental Theorem of Calculus
Marginal Cost & Change in Total Cost
The Definite Integral as an Average
How to Visualize the Average on a Graph
PROJECTS: Carbon Dioxide in Pond Water, Flooding in the Grand Canyon
Theorems About Definite Integrals
5.1 DISTANCE AND ACCUMULATED CHANGE
In Chapter 2, we used the derivative to find the rate of change of a function. Here we see how to go in the other direction. If we know the rate of change, can we find the original function? We start by finding the distance traveled from its rate of change, the velocity. For positive constant velocities, we can find the distance traveled using the formula
![]()
In this section we see how to estimate the distance when the velocity is not a constant.
A Thought Experiment: How Far Did the Car Go?
Suppose a car is moving with increasing velocity and that we measure the car's velocity every two seconds, obtaining the data in Table 5.1:
How far has the car traveled? Since we don't know how fast the car is moving at every moment, we can't calculate the distance exactly, but we can make an estimate. The velocity is increasing, so the car is going at least 20 ft/sec for the first two seconds. Since Distance = Velocity × Time, the car goes at least 20 · 2 = 40 feet during the first two seconds. Likewise, it goes at least 30 · 2 = 60 feet during the next two seconds, and so on. During the ten-second period it goes at least
![]()
Thus, 360 feet is an underestimate of the total distance traveled during the ten seconds.
To get an overestimate, we can reason in a similar way: During the first two seconds, the car's velocity is at most 30 ft/sec, so it moves at most 30 · 2 = 60 feet. In the next two seconds it moves at most 38 · 2 = 76 feet, and so on. Therefore, over the ten-second period it moves at most
![]()
Therefore,
![]()
There is a difference of 60 feet between the upper and lower estimates. A better estimate would be the average of the upper and lower estimates,
![]()
Visualizing Distance on the Velocity Graph
We can represent both upper and lower estimates on a graph of the velocity against time. The velocity can be graphed by plotting the data in Table 5.1 and drawing a curve through the data points. (See Figure 5.1.)
The area of the first dark rectangle is 20 · 2 = 40, the lower estimate of the distance moved during the first two seconds. The area of the second dark rectangle is 30 · 2 = 60, the lower estimate for the distance moved in the next two seconds. The total area of the dark rectangles represents the lower estimate for the total distance moved during the ten seconds.
If the dark and light rectangles are considered together, the first area is 30 · 2 = 60, the upper estimate for the distance moved in the first two seconds. The second area is 38 · 2 = 76, the upper estimate for the next two seconds. Continuing this calculation suggests that the upper estimate for the total distance is represented by the sum of the areas of the dark and light rectangles.

Figure 5.1: Shaded area estimates distance traveled. Velocity measured every 2 seconds
Visualizing Distance on the Velocity Graph: Area Under Curve
As we make more frequent velocity measurements, the rectangles used to estimate the distance traveled fit the curve more closely. See Figures 5.2 and 5.3. In the limit, as the number of subdivisions increases, we see that the distance traveled is given by the area between the velocity curve and the horizontal axis. See Figure 5.4. In general:
If the velocity is positive, the total distance traveled is the area under the velocity curve.
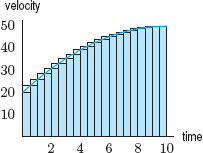
Figure 5.2: Velocity measured every 1/2 second

Figure 5.3: Velocity measured every 1/4 second

Figure 5.4: Distance traveled is area under curve
| Example 1 | With time t in seconds, the velocity of a bicycle, in feet per second, is given by v(t) = 5t. How far does the bicycle travel in 3 seconds? |
| Solution | The velocity is linear. See Figure 5.5. The distance traveled is the area between the line v(t) = 5t and the t-axis. Since this region is a triangle of height 15 and base 3
|

Approximating Total Change from Rate of Change
We have seen how to use the rate of change of distance (the velocity) to calculate the total distance traveled. We can use the same method to find total change from the rate of change of other quantities.
| Example 2 | The rate of sales (in games per week) of a new video game is shown in Table 5.2. Assuming that the rate of sales increased throughout the 20-week period, estimate the total number of games sold during this period.
Table 5.2 Weekly sales of a video game
|
| Solution | If the rate of sales is constant, we have
How many games were sold during the first five weeks? During this time, sales went from 0 to 585 games per week. If we assume that 585 games were sold every week, we get an overestimate for the sales in the first five weeks of (585 games/week)(5 weeks) = 2925 games. Similar overestimates for each of the five-week periods gives an overestimate for the entire 20-week period:
We underestimate the total sales by taking the lower value for rate of sales during each of the five-week periods:
Thus, the total sales of the game during the 20-week period is between 16,760 and 28,510 games. A good single estimate of total sales is the average of these two numbers:
|
Improving the Approximation: The Role of n and Δt
In general, to approximate total change from a function f(t) giving the rate of change at time t, we construct a sum. We use the notation Δt for the size of the t-intervals used. We use n to represent the number of subintervals of length Δt. In the following example, we see how decreasing Δt (and increasing n) improves the accuracy of the approximation.
| Example 3 | If t is in hours since the start of a 20-hour period, a bacteria population increases at a rate given by
Make an underestimate of the total change in the number of bacteria over this period using (a) Δt = 4 hours (b) Δt = 2 hours (c) Δt = 1 hour |
| Solution | (a) The rate of change is f(t) = 3 + 0.1t2. If we use Δt = 4, we measure the rate every 4 hours and n = 20/4 = 5. Using the formula to calculate f(t), we obtain Table 5.3. An underestimate for the population change during the first 4 hours is (3.0 million/hour)(4 hours) = 12 million. Combining the contributions from all the subintervals gives the underestimate:
The rate of change is graphed in Figure 5.6(a); the area of the shaded rectangles represents this underestimate. Notice that n = 5 is the number of rectangles in the graph. (b) If we use Δt = 2, we measure f(t) every 2 hours and n = 20/2 = 10. See Table 5.4. The underestimate is
Figure 5.6(b) suggests that this estimate is more accurate than the estimate made in part (a). Table 5.4 Rate of change with Δt = 2 using f(t) = 3 + 0.1t2 million bacteria/hour
(c) If we use Δt = 1, then n = 20 and a similar calculation shows that we have
The shaded area in Figure 5.6(c) represents this estimate; it is the most accurate of the three. |

Figure 5.6: More and more accurate estimates of total change from rate of change. In each case, f(t) is the rate of change, and the shaded area approximates total change. Largest n and smallest Δt give the best estimate.
Notice that as n gets larger, the estimate improves and the area of the shaded rectangles approaches the area under the curve.
Left- and Right-Hand Sums
Now we see how to express these sums for any function f(t) that is continuous for a ≤ t ≤ b. We divide the interval from a to b into n equal subdivisions, each of width Δt, so
![]()
We let t0, t1, t2, . . . , tn be endpoints of the subdivisions, as in Figures 5.7 and 5.8. We construct two sums, similar to the overestimates and underestimates earlier in this section. For a left-hand sum, we use the values of the function from the left end of the interval. For a right-hand sum, we use the values of the function from the right end of the interval. We have:

These sums represent the shaded areas in Figures 5.7 and 5.8, provided f(t) ≥ 0. In Figure 5.7, the first rectangle has width Δt and height f(t0), since the top of its left edge just touches the curve, and hence it has area f(t0)Δt. The second rectangle has width Δt and height f(t1), and hence has area f(t1)Δt, and so on. The sum of all these areas is the left-hand sum. The right-hand sum, shown in Figure 5.8, is constructed in the same way, except that each rectangle touches the curve on its right edge instead of its left.

Figure 5.7: Left-hand sum: Area of rectangles

Figure 5.8: Right-hand sum: Area of rectangles
Writing Left- and Right-Hand Sums Using Sigma Notation
Both the left-hand and right-hand sums can be written more compactly using sigma, or summation, notation. The symbol Σ is a capital sigma, or Greek letter “S.” We write

The Σ tells us to add terms of the form f(ti)Δt. The “i = 1” at the base of the sigma sign tells us to start at i = 1, and the “n” at the top tells us to stop at i = n.
In the left-hand sum we start at i = 0 and stop at i = n − 1, so we write

Problems for Section 5.1
1. Suppose that you travel 30 miles/hour for 2 hours, then 40 miles/hour for 1/2 hour, then 20 miles/hour for 4 hours.
(a) What is the total distance you traveled?
(b) Sketch a graph of the velocity function for this trip.
(c) Represent the total distance traveled on your graph in part (b).
2. Figure 5.9 shows the velocity of a car for 0 ≤ t ≤ 12 and the rectangles used to estimate the distance traveled.
(a) Do the rectangles represent a left or a right sum?
(b) Do the rectangles lead to an upper or a lower estimate?
(c) What is the value of n?
(d) What is the value of Δt?
(e) Give an approximate value for the estimate.

3. Figure 5.10 shows the velocity of a runner for 0 ≤ t ≤ 15 and the rectangles used to estimate the distance traveled.
(a) Do the rectangles represent a left or a right sum?
(b) Do the rectangles lead to an upper or a lower estimate?
(c) What is the value of n?
(d) What is the value of Δt?
(e) Give an approximate value for the estimate.
4. A car comes to a stop six seconds after the driver applies the brakes. While the brakes are on, the velocities recorded are in Table 5.5.
(a) Give lower and upper estimates for the distance the car traveled after the brakes were applied.
(b) On a sketch of velocity against time, show the lower and upper estimates of part(a).
5. A car starts moving at time t = 0 and goes faster and faster. Its velocity is shown in the following table. Estimate how far the car travels during the 12 seconds.

6. Graph the rate of sales against time for the video game data in Example 2. Represent graphically the overestimate and the underestimate calculated in that example.
7. Figure 5.11 shows the velocity, v, of an object (in meters/sec). Estimate the total distance the object traveled between t = 0 and t = 6.

8. Roger runs a marathon. His friend Jeff rides behind him on a bicycle and clocks his speed every 15 minutes. Roger starts out strong, but after an hour and a half he is so exhausted that he has to stop. Jeff's data follow:

(a) Assuming that Roger's speed is never increasing, give upper and lower estimates for the distance Roger ran during the first half hour.
(b) Give upper and lower estimates for the distance Roger ran in total during the entire hour and a half.
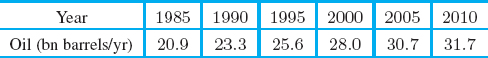
9. The following table gives world oil consumption, in billions of barrels per year.1 Estimate total oil consumption during this 25-year period.
10. A car accelerates smoothly from 0 to 60 mph in 10 seconds with the velocity given in Figure 5.12. Estimate how far the car travels during the 10-second period.

11. The velocity of a car is f(t) = 5t meters/sec. Use a graph of f(t) to find the exact distance traveled by the car, in meters, from t = 0 to t = 10 seconds.
12. A village wishes to measure the quantity of water that is piped to a factory during a typical morning. A gauge on the water line gives the flow rate (in cubic meters per hour) at any instant. The flow rate is about 100 m3/hr at 6 am and increases steadily to about 280 m3/hr at 9 am.
Using only this information, give your best estimate of the total volume of water used by the factory between 6 am and 9 am.
13. Filters at a water treatment plant become less effective over time. The rate at which pollution passes through the filters into a nearby lake is given in the following table.
(a) Estimate the total quantity of pollution entering the lake during the 30-day period.
(b) Your answer to part (a) is only an estimate. Give bounds (lower and upper estimates) between which the true quantity of pollution must lie. (Assume the rate of pollution is continually increasing.)

14. A car initially going 50 ft/sec brakes at a constant rate (constant negative acceleration), coming to a stop in 5 seconds.
(a) Graph the velocity from t = 0 to t = 5.
(b) How far does the car travel?
(c) How far does the car travel if its initial velocity is doubled, but it brakes at the same constant rate?
15. Figure 5.13 shows the rate of change of a fish population. Estimate the total change in the population during this 12-month period.

16. Two cars travel in the same direction along a straight road. Figure 5.14 shows the velocity, v, of each car at time t. Car B starts 2 hours after car A and car B reaches a maximum velocity of 50 km/hr.
(a) For approximately how long does each car travel?
(b) Estimate car A's maximum velocity.
(c) Approximately how far does each car travel?

17. Two cars start at the same time and travel in the same direction along a straight road. Figure 5.15 gives the velocity, v, of each car as a function of time, t. Which car:
(a) Attains the larger maximum velocity?
(b) Stops first?
(c) Travels farther?

18. Your velocity is given by v(t) = t2 + 1 in m/sec, with t in seconds. Estimate the distance, s, traveled between t = 0 and t = 5. Explain how you arrived at your estimate.
19. The value of a mutual fund increases at a rate of R = 500e0.04t dollars per year, with t in years since 2010.
(a) Using t = 0, 2, 4, 6, 8, 10, make a table of values for R.
(b) Use the table to estimate the total change in the value of the mutual fund between 2010 and 2020.
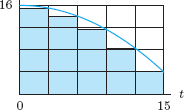
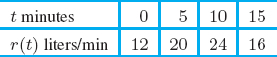
20. An old rowboat has sprung a leak. Water is flowing into the boat at a rate, r(t), given in the table.
(a) Compute upper and lower estimates for the volume of water that has flowed into the boat during the 15 minutes.
(b) Draw a graph to illustrate the lower estimate.
21. The rate of change of the world's population, in millions of people per year, is given in the following table.
(a) Use this data to estimate the total change in the world's population between 1950 and 2000.
(b) The world population was 2555 million people in 1950 and 6085 million people in 2000. Calculate the true value of the total change in the population. How does this compare with your estimate in part (a)?

22. A car speeds up at a constant rate from 10 to 70 mph over a period of half an hour. Its fuel efficiency (in miles per gallon) increases with speed; values are in the table. Make lower and upper estimates of the quantity of fuel used during the half hour.

Problems 23–26 concern hybrid cars such as the Toyota Prius that are powered by a gas-engine, electric-motor combination, but can also function in Electric-Vehicle (EV) only mode. Figure 5.16 shows the velocity, v, of a 2010 Prius Plug-in Hybrid Prototype operating in normal hybrid mode and EV-only mode, respectively, while accelerating from a stoplight.2

23. Could the car travel half a mile in EV-only mode during the first 25 seconds of movement?
24. About how far, in feet, does the 2010 Prius Prototype travel in EV-only mode during the first 15 seconds of movement?
25. Assume two identical cars, one running in normal hybrid mode and one running in EV-only mode, accelerate together in a straight path from a stoplight. Approximately how far apart are the cars after 5 seconds?
26. Assume two identical cars, one running in normal hybrid mode and one running in EV-only mode, accelerate together in a straight path from a stoplight. Approximately how far apart are the cars after 15 seconds?
27. A car is traveling at 80 feet per second (approximately 55 miles per hour) and slows down as it passes through a busy intersection. The car's velocity is shown in the following table.

(a) Use a left sum to approximate the total distance the car has traveled over the 12 second interval.
(b) Is your answer in part (a) a lower or upper estimate? How can you tell?
(c) Use a right sum to approximate the total distance the car has traveled over the 12 second interval.
(d) Is your answer in part (c) a lower or upper estimate? How can you tell?
(e) Using your answers in parts (a) and (c), find a better estimate for the total distance the car has traveled.
28. The following table gives the total world emissions of CO2 from fossil fuels, in billions of tons per year.3

(a) Use this data to estimate the total world CO2 emissions between 1981 and 2011 using a left sum with n = 6.
(b) Is your answer in part (a) an upper or lower estimate? How can you tell?
(c) Use this data to estimate the total world CO2 emissions between 1981 and 2011 using a right sum with n = 3.
(d) Is your answer in part (c) an upper or lower estimate? How can you tell?
29. The rate of change of a quantity is given by f(t) = t2+1. Make an underestimate and an overestimate of the total change in the quantity between t = 0 and t = 8 using
(a) Δt = 4
(b) Δt = 2
(c) Δt = 1
What is n in each case? Graph f(t) and shade rectangles to represent each of your six answers.
30. Use the expressions for left and right sums on page 245 and Table 5.6.
(a) If n = 4, what is Δt? What are t0, t1, t2, t3, t4? What are f(t0), f(t1), f(t2), f(t3), f(t4)?
(b) Find the left and right sums using n = 4.
(c) If n = 2, what is Δt? What are t0, t1, t2? What are f(t0), f(t1), f(t2)?
(d) Find the left and right sums using n = 2.
31. Use the expressions for left and right sums on page 245 and Table 5.7.
(a) If n = 4, what is Δt? What are t0, t1, t2, t3, t4? What are f(t0), f(t1), f(t2), f(t3), f(t4)?
(b) Find the left and right sums using n = 4.
(c) If n = 2, what is Δt? What are t0, t1, t2? What are f(t0), f(t1), f(t2)?
(d) Find the left and right sums using n = 2.
5.2 THE DEFINITE INTEGRAL
In Section 5.1 we saw how to approximate total change given the rate of change. In this section we define a new quantity, the definite integral, which gives the total change exactly.
Taking the Limit to Obtain the Definite Integral
If f is a rate of change of some quantity, then the left-hand sum and the right-hand sum approximate the total change in the quantity. For most functions f, the approximation is improved by increasing the value of n. To find the total change exactly, we take larger and larger values of n and look at the values approached by the left and right sums. This is called taking the limit of these sums as n goes to infinity and is written ![]() . If f is continuous for a ≤ t ≤ b, the limits of the left- and right-hand sums exist and are equal. The definite integral is the common limit of these sums.
. If f is continuous for a ≤ t ≤ b, the limits of the left- and right-hand sums exist and are equal. The definite integral is the common limit of these sums.
Suppose f is continuous for a ≤ t ≤ b. The definite integral of f from a to b, written

is the limit of the left-hand or right-hand sums with n subdivisions of [a, b] as n gets arbitrarily large. In other words, if t0, t1, . . . tn are the endpoints of the subdivisions,

and

Each of these sums is called a Riemann sum, f is called the integrand, and a and b are called the limits of integration.
The “∫” notation comes from an old-fashioned “S,” which stands for “sum” in the same way that Σ does. The “dt” in the integral comes from the factor Δt. Notice that the limits on the Σ symbol are 0 and n − 1 for the left-hand sum, and 1 and n for the right-hand sum, whereas the limits on the ∫ sign are a and b.
When f(t) is positive, the left- and right-hand sums are represented by the sums of areas of rectangles, so the definite integral is represented graphically by an area.
| Example 1 | Write the result of Example 3 in the previous section using integral notation. |
| Solution | Part (c) gave 307.0 million as the best estimate of the total change in the bacteria population. In integral notation |
![]()
Computing a Definite Integral
In practice, many calculators and computers calculate definite integrals by automatically computing sums for larger and larger values of n.
| Example 2 | Compute |
| Solution | Using a calculator or computer, we find
The integral represents the area between t = 0 and t = 1 under the curve f(t) = e−t2. See Figure 5.17. |


Estimating a Definite Integral from a Table or Graph
If we have a formula for the integrand, f(x), we can calculate the integral ![]() using a calculator or computer. If, however, we have only a table of values or a graph of f(x), we can still estimate the integral. Note that we can use any letter (x, t, y, q, etc.) for the independent variable.
using a calculator or computer. If, however, we have only a table of values or a graph of f(x), we can still estimate the integral. Note that we can use any letter (x, t, y, q, etc.) for the independent variable.
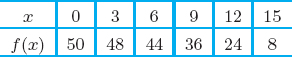
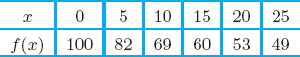
| Example 3 | Values for a function f(t) are in the following table. Estimate
|
| Solution | Since we have only a table of values, we use left- and right-hand sums to approximate the integral. The values of f(t) are spaced 2 units apart, so Δt = 2 and n =(30 − 20)/2 = 5. Calculating the left-hand and right-hand sums gives
Both left- and right-hand sums approximate the integral. We generally get a better estimate by averaging the two:
|


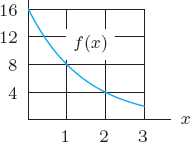
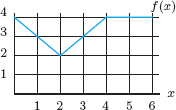
| Example 4 | The function f(x) is graphed in Figure 5.18. Estimate |
| Solution | We can approximate the integral using left- and right-hand sums with n = 3, so Δx = 2. Figures 5.19 and 5.20 give
|


We estimate the integral by taking the average:

Alternatively, since the integral equals the area under the curve between x = 0 and x = 6, we can estimate it by counting grid boxes. Each grid box has area 5 · 1 = 5, and the region under f(x) includes about 10.5 grid boxes, so the area is about 10.5 · 5 = 52.5.

Figure 5.19: Area of shaded region is left-hand sum with n = 3

Figure 5.20: Area of shaded region is right-hand sum with n = 3
Rough Estimates of a Definite Integral
When calculating an integral using a calculator or computer, it is useful to have a rough idea of the value you expect. This helps detect errors in entering the integral.
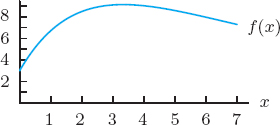
| Example 5 | Figure 5.21 shows the graph of a function f(t). Which of the numbers 0.023, 1.099, 1.526, and 11.984 could be the value of |
| Solution | Figure 5.21 shows left- and right-hand approximations to |

Problems for Section 5.2
In Problems 1–2, rectangles have been drawn to approximate ![]() .
.
(a) Do the rectangles represent a left or a right sum?
(b) Do the rectangles lead to an upper or a lower estimate?
(c) What is the value of n?
(d) What is the value of Δx?
1.

2.

3. Estimate ![]() dx using a left-hand sum with n = 2.
dx using a left-hand sum with n = 2.
4. Estimate ![]() using a left-hand sum with n = 3.
using a left-hand sum with n = 3.
5. Estimate ![]() dx using n = 5 rectangles to form a
dx using n = 5 rectangles to form a
(a) Left-hand sum
(b) Right-hand sum
6. Use the following table to estimate ![]() .
.

7. Use the table to estimate ![]() . What values of n and Δx did you use?
. What values of n and Δx did you use?

8. Use the following table to estimate ![]() .
.
9. Use the following table to estimate ![]() . What are n and Δt?
. What are n and Δt?
![]()
10. Using Figure 5.22, draw rectangles representing each of the following Riemann sums for the function f on the interval 0 ≤ t ≤ 8. Calculate the value of each sum.
(a) Left-hand sum with Δt = 4
(b) Right-hand sum with Δt = 4
(c) Left-hand sum with Δt = 2
(d) Right-hand sum with Δt = 2

11. Use Figure 5.23 to estimate ![]() .
.

12. Use Figure 5.24 to estimate ![]() .
.

Use the graphs in Problems 13–14 to estimate ![]() .
.
13.
14.

15. Using Figure 5.25, find the value of ![]() .
.

16. Without calculation, what can you say about the relationship between the values of the two integrals:

17. If we know ![]() , what is the value of
, what is the value of

In Problems 18–25, use a calculator or computer to evaluate the integral.
18. ![]()
19. ![]()
20. ![]()
21. ![]()
22. ![]()
23. ![]()
24. ![]()
25. ![]()
For Problems 26–29:
(a) Use a graph of the integrand to make a rough estimate of the integral. Explain your reasoning.
(b) Use a computer or calculator to find the value of the definite integral.
26. ![]()
27. ![]()
28. ![]()
29. ![]()
30. The graph of f(t) is in Figure 5.26. Which of the following four numbers could be an estimate of ![]() accurate to two decimal places? Explain your choice.
accurate to two decimal places? Explain your choice.
I. −98.35
II. 71.84
III. 100.12
IV. 93.47

31. (a) Use a calculator or computer to find ![]() dx. Represent this value as the area under a curve.
dx. Represent this value as the area under a curve.
(b) Estimate ![]() dx using a left-hand sum with n = 3. Represent this sum graphically on a sketch of f(x) = x2 + 1. Is this sum an overestimate or underestimate of the true value found in part (a)?
dx using a left-hand sum with n = 3. Represent this sum graphically on a sketch of f(x) = x2 + 1. Is this sum an overestimate or underestimate of the true value found in part (a)?
(c) Estimate ![]() dx using a right-hand sum with n = 3. Represent this sum on your sketch. Is this sum an overestimate or underestimate?
dx using a right-hand sum with n = 3. Represent this sum on your sketch. Is this sum an overestimate or underestimate?
5.3 THE DEFINITE INTEGRAL AS AREA
Relationship Between Definite Integral and Area
If f(x) is continuous and positive, each term f(x0)Δx, f(x1)Δx, . . . in a left- or right-hand Riemann sum represents the area of a rectangle. See Figure 5.27. As the width Δx of the rectangles approaches zero, the rectangles fit the curve of the graph more exactly, and the sum of their areas gets closer to the area under the curve shaded in Figure 5.28. In other words:
When f(x) is positive and a < b:

We assumed in drawing Figure 5.28 that the graph of f(x) lies above the x-axis. If the graph lies below the x-axis, then each value of f(x) is negative, so each f(x) Δx is negative, and the area is counted negatively. In that case, the definite integral is the negative of the area between the graph of f and the horizontal axis.
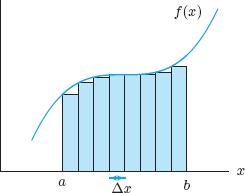
Figure 5.27: Area of rectangles approximating the area under the curve

Figure 5.28: Shaded area is the definite integral ![]()
| Example 1 | What is the relation between the area between the parabola y = x2 − 1 and the x-axis and these definite integrals?
(a) (b) |
| Solution | (a) The parabola lies above the x-axis between x = 1 and x = 2. (See Figure 5.29.) So,
(b) The parabola lies below the x-axis between x = −1 and x = 1. (See Figure 5.30.) So,
|


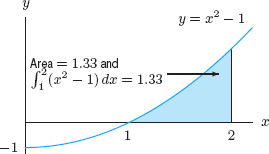
Figure 5.29: Integral ![]() is the shaded area
is the shaded area

Summarizing, assuming f(x) is continuous, we have:
When f(x) is positive for some x-values and negative for others, and a < b:
![]() is the sum of the areas between a and b above the x-axis, counted positively, and the areas between a and b below the x-axis, counted negatively.
is the sum of the areas between a and b above the x-axis, counted positively, and the areas between a and b below the x-axis, counted negatively.
In the following example, we break up the integral. The properties that allow us to do this are discussed in the Focus on Theory section at the end of this chapter.
| Example 2 | Interpret the definite integral |
| Solution | Figure 5.31 shows the graph of f(x) = x3 − 7x2 + 11x crossing below the x-axis at about x = 2.38. The integral is the area above the x-axis, A1 minus the area below the x-axis, A2. Computing the integral with a calculator or computer shows
Breaking the integral into two parts and calculating each one separately gives
so A1 = 7.72 and A2 = 5.05. Then, as we would expect,
|


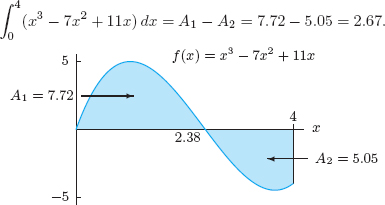
| Example 3 | Find the total area of the shaded regions in Figure 5.31. |
| Solution | We saw in Example 2 that A1 = 7.72 and A2 = 5.05. Thus we have
|
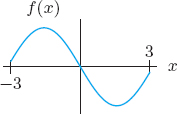
| Example 4 | For each of the functions graphed in Figure 5.32, decide whether
|
| Solution | (a) The graph lies almost entirely below the x-axis, so the integral is negative.
(b) The graph lies partly below the x-axis and partly above the x-axis. However, the area above the x-axis is larger than the area below the x-axis, so the integral is positive. (c) The graph lies partly below the x-axis and partly above the x-axis. Since the areas above and below the x-axis appear to be approximately equal in size, the integral is approximately zero. |

Area Between Two Curves
We can use rectangles to approximate the area between two curves. If g(x) ≤ f(x), as in Figure 5.33, the height of a rectangle is f(x) − g(x). The area of the rectangle is (f(x) − g(x))Δx, and we have the following result:
If f and g are continuous functions, and g(x) ≤ f(x) for a ≤ x ≤ b:


Figure 5.33: Area between two curves = ![]()
| Example 5 | Graphs of f(x) = 4x − x2 and g(x) =
Figure 5.34: Find the area between f(x) = 4x − x2 and g(x) = |
| Solution | The region enclosed by the graphs of the two functions is shaded in Figure 5.34. The two graphs cross at x = 0 and at x ≈ 3.12. Between these values, the graph of f(x) = 4x − x2 lies above the graph of g(x) =
|


Problems for Section 5.3
1. Find the area under the graph of f(x) = x2 + 2 between x = 0 and x = 6.
2. Find the area under P = 100(0.6)t between t = 0 and t = 8.
3. Find the total area between y = 4 − x2 and the x-axis for 0 ≤ x ≤ 3.
4. Find the area between y = x + 5 and y = 2x + 1 between x = 0 and x = 2.
5. Find the area enclosed by y = 3x and y = x2.
6. (a) What is the area between the graph of f(x) in Figure 5.35 and the x-axis, between x = 0 and x = 5?
(b) What is ![]()

7. Using Figure 5.36, decide whether each of the following definite integrals is positive or negative.
(a) ![]()
(b) ![]()
(c) ![]()
(d) ![]()

8. Using Figure 5.36, arrange the following definite integrals in ascending order:
![]()
9. (a) Estimate (by counting the squares) the total area shaded in Figure 5.37.
(b) Using Figure 5.37, estimate ![]() dx.
dx.
(c) Why are your answers to parts (a) and (b) different?

10. Using Figure 5.38, estimate ![]()

11. Given ![]() and Figure 5.39, estimate:
and Figure 5.39, estimate:
(a) ![]()
(b) ![]()
(c) The total shaded area.

12. Using Figure 5.40, list the following integrals in increasing order (from smallest to largest). Which integrals are negative, which are positive? Give reasons.
I. ![]()
II. ![]()
III. ![]()
IV. ![]()
V. ![]()

13. Use Figure 5.41 to find the values of
(a) ![]()
(b) ![]()
(c) ![]()
(d) ![]()

In Problems 14–17, match the graph with one of the following possible values for the integral ![]()
I. −10.4
II. −2.1
III. 5.2
IV. 10.4
14.

15.

16.

17.

18. (a) Graph f(x) = x(x + 2)(x − 1).
(b) Find the total area between the graph and the x-axis between x = −2 and x = 1.
(c) Find ![]() and interpret it in terms of areas.
and interpret it in terms of areas.
19. (a) Using Figure 5.42, find ![]() .
.
(b) If the area of the shaded region is A, estimate ![]() .
.

20. Use the following table to estimate the area between f(x) and the x-axis on the interval 0 ≤ x ≤ 20.

21. Use Figure 5.43 to find the values of
(a) ![]()
(b) ![]()
(c) ![]()
(d) ![]()

Figure 5.43: Graph consists of a semicircle and line segments
In Problems 22–29, use an integral to find the specified area.
22. Under y = 6x3 − 2 for 5 ≤ x ≤ 10.
23. Under y = 2 cos(t/10) for 1 ≤ t ≤ 2.
24. Under y = 5 ln(2x) and above y = 3 for 3 ≤ x ≤ 5.
25. Between y = sin x + 2 and y = 0.5 for 6 ≤ x ≤ 10.
26. Between y = cos x + 7 and y = ln(x − 3), 5 ≤ x ≤ 7.
27. Above the curve y = x4 − 8 and below the x-axis.
28. Above the curve y = −ex + e2(x−1) and below the x-axis, for x ≥ 0.
29. Between y = cos t and y = sin t for 0 ≤ t ≤ π.
For Problems 30–31, compute the definite integral and interpret the result in terms of areas.
30. ![]() .
.
31. ![]() .
.
32. Find the area between the graph of y = x2 − 2 and the x-axis, between x = 0 and x = 3.
33. (a) Find the total area between f(x) = x3 − x and the x-axis for 0 ≤ x ≤ 3.
(b) Find ![]() .
.
(c) Are the answers to parts (a) and (b) the same? Explain.
34. Compute the definite integral ![]() cos
cos ![]() and interpret the result in terms of areas.
and interpret the result in terms of areas.
5.4 INTERPRETATIONS OF THE DEFINITE INTEGRAL
The Notation and Units for the Definite Integral
Just as the Leibniz notation dy/dx for the derivative reminds us that the derivative is the limit of a quotient of differences, the notation for the definite integral,

reminds us that an integral is a limit of a sum. Since dx can be thought of as a small difference in x, the terms being added are products of the form “f(x) times a difference in x.” We have the following result:
The unit of measurement for ![]() is the product of the units for f(x) and the units for x.
is the product of the units for f(x) and the units for x.
Example: If x and f(x) have the same units, then the integral ![]() is measured in square units, say cm × cm = cm2. This is as we expect, since the integral represents an area.
is measured in square units, say cm × cm = cm2. This is as we expect, since the integral represents an area.
Example: If v = f(t) is velocity in meters/second and t is time in seconds, then the integral ![]() has units of (meters/sec) × (sec) = meters, as we expect, since the integral represents change in position.
has units of (meters/sec) × (sec) = meters, as we expect, since the integral represents change in position.
| Example 1 | Let C(t) represent the cost per day to heat your home in dollars per day, where t is time measured in days and t = 0 corresponds to January 1, 2014. Interpret |
| Solution | The units for the integral |
We saw in Section 5.1 that the integral of a rate of change gives total change:
If f(t) is a rate of change of a quantity, then

The units correspond: If f(t) is a rate of change, with units of quantity/time, then f(t)Δt and the definite integral have units of (quantity/time) × (time) = quantity.
| Example 3 | A man starts 50 miles away from his home and takes a trip in his car. He moves on a straight line, and his home lies on this line. His velocity is given in Figure 5.44.
(a) When is the man closest to his home? Approximately how far away is he then? (b) When is the man farthest from his home? How far away is he then?
|
| Solution | What happens on this trip? The velocity function is positive the first two hours and negative between t = 2 and t = 5. So the man moves toward his home during the first two hours, then turns around at t = 2 and moves away from his home. The distance he travels is represented by the area between the graph of velocity and the t-axis; since the area below the axis is greater than the area above the axis, we see that he ends up farther away from home than when he started. Thus he is closest to home at t = 2 and farthest from home at t = 5. We can estimate how far he went in each direction by estimating areas.
(a) The man starts out 50 miles from home. The distance the man travels during the first two hours is the area under the curve between t = 0 and t = 2. This area corresponds to about one grid box. Since each grid box has area (30 miles/hour)(1 hour) = 30 miles, the man travels about 30 miles toward home. He is closest to home after 2 hours, and he is about 20 miles away at that time. (b) Between t = 2 and t = 5, the man moves away from his home. Since this area is equal to about 3.5 grid boxes, which is (3.5)(30) =105 miles, he has moved 105 miles farther from home. He was already 20 miles from home at t = 2, so at t = 5 he is about 125 miles from home. He is farthest from home at t = 5. Notice that the man has covered a total distance of 30 + 105 = 135 miles. However, he went toward his home for 30 miles and away from his home for 105 miles. His net change in position is 75 miles. |

| Example 4 | The rates of growth of the populations of two species of plants (measured in new plants per year) are shown in Figure 5.45. Assume that the populations of the two species are equal at time t = 0.
(a) Which population is larger after one year? After two years? (b) How much does the population of species 1 increase during the first two years? Figure 5.45: Population growth rates for two species of plants |
| Solution | (a) The rate of growth of the population of species 1 is higher than that of species 2 throughout the first year, so the population of species 1 is larger after one year. After two years, the situation is less clear, since the population of species 1 increased faster for the first year and that of species 2 for the second. However, if r(t) is the rate of growth of a population, we have
This integral is the area under the graph of r(t). For t = 0 to t = 2, the area under the species 1 graph in Figure 5.45 is smaller than the area under the species 2 graph, so the population of species 2 is larger after two years. (b) The population change for species 1 is the area of the region under the graph of r(t) between t = 0 and t = 2 in Figure 5.45. The region consists of about 16.5 grid boxes, each of area (750 plants/year)(0.25 year) = 187.5 plants, giving a total of (16.5)(187.5) = 3093.75 plants. The population of species 1 increases by about 3100 plants during the two years. |

Bioavailability of Drugs
In pharmacology, the definite integral is used to measure bioavailability; that is, the overall presence of a drug in the bloodstream during the course of a treatment. Unit bioavailability represents 1 unit concentration of the drug in the bloodstream for 1 hour. For example, a concentration of 3 μg/cm3 in the blood for 2 hours has bioavailability of 3 · 2 = 6 (μg/cm3)-hours.
Ordinarily the concentration of a drug in the blood is not constant. Typically, the concentration in the blood increases as the drug is absorbed into the bloodstream, and then decreases as the drug is broken down and excreted.4 (See Figure 5.46.)
Suppose that we want to calculate the bioavailability of a drug that is in the blood with concentration C(t) μg/cm3 at time t for the time period 0 ≤ t ≤ T. Over a small interval Δt, we estimate
![]()
Summing over all subintervals gives
![]()
In the limit as n → ∞, where n is the number of intervals of width Δt, the sum becomes an integral. So for 0 ≤ t ≤ T, we have
![]()
That is, the total bioavailability of a drug is equal to the area under the drug concentration curve.

Figure 5.46: Curve showing drug concentration as a fuction of time
| Example 5 | Blood concentration curves5 of two drugs are shown in Figure 5.47. Describe the differences and similarities between the two drugs in terms of peak concentration, speed of absorption into the bloodstream, and total bioavailability.
|
| Solution | Drug A has a peak concentration more than twice as high as that of drug B. Because drug A achieves peak concentration sooner than drug B, drug A appears to be absorbed more rapidly into the blood stream than drug B. Finally, drug A has greater total bioavailability, since the area under the graph of the concentration function for drug A is greater than the area under the graph for drug B. |

Problems for Section 5.4
In Problems 1–4, explain in words what the integral represents and give units.
1. ![]() , where v(t) is velocity in meters/sec and t is time in seconds.
, where v(t) is velocity in meters/sec and t is time in seconds.
2. ![]() , where a(t) is acceleration in km/hr2 and t is time in hours.
, where a(t) is acceleration in km/hr2 and t is time in hours.
3. ![]() , where f(t) is the rate at which world population is growing in year t, in billion people per year.
, where f(t) is the rate at which world population is growing in year t, in billion people per year.
4. ![]() , where s(x) is rate of change of salinity (salt concentration) in gm/liter per cm in sea water, and where x is depth below the surface of the water in cm.
, where s(x) is rate of change of salinity (salt concentration) in gm/liter per cm in sea water, and where x is depth below the surface of the water in cm.
5. Oil leaks out of a tanker at a rate of r = f(t) gallons per minute, where t is in minutes. Write a definite integral expressing the total quantity of oil which leaks out of the tanker in the first hour.
6. Pollution is removed from a lake on day t at a rate of f(t) kg/day.
(a) Explain the meaning of the statement f(12) = 500.
(b) If ![]() , give the units of the 5, the 15, and the 4000.
, give the units of the 5, the 15, and the 4000.
(c) Give the meaning of ![]() .
.
7. Annual coal production in the US (in billion tons per year) is given in the table.6 Estimate the total amount of coal produced in the US between 1997 and 2009. If r = f(t) is the rate of coal production t years since 1997, write an integral to represent the 1997–2009 coal production.

8. The following table gives the US emissions, H(t), of hydrofluorocarbons, or “super greenhouse gasses,” in teragrams equivalent of carbon dioxide, with t in years since 2000.7
(a) What are the units and meaning of ![]() ?
?
(b) Estimate ![]()

9. World annual natural gas8 consumption, N, in millions of metric tons of oil equivalent, is approximated by N = 1770 + 53t, where t is in years since 1990.
(a) How much natural gas was consumed in 1990? In 2010?
(b) Estimate the total amount of natural gas consumed during the 20-year period from 1990 to 2010.
10. Solar photovoltaic (PV) cells are the world's fastest-growing energy source. In year t since 2007, PV cells were manufactured worldwide at a rate of S = 3.7e0.61t gigawatts per year.9 Estimate the total solar energy-generating capacity of the PV cells manufactured between 2007 and 2011.
Problems 11–14 show the velocity, in cm/sec, of a particle moving along a number line. (Positive velocities represent movement to the right; negative velocities to the left.) Compute the change in position between times t = 0 and t = 5 seconds.
11.

12.

13.

14.

15. Your velocity is v(t) = ln(t2+1) ft/sec for t in seconds, 0 ≤ t ≤ 3. Find the distance traveled during this time.
16. Figure 5.48 shows the length growth rate of a human fetus.
(a) What feature of a graph of length as a function of age corresponds to the maximum in Figure 5.48?
(b) Estimate the length of a baby born in week 40.

17. A forest fire covers 2000 acres at time t = 0. The fire is growing at a rate of 8![]() acres per hour, where t is in hours. How many acres are covered 24 hours later?
acres per hour, where t is in hours. How many acres are covered 24 hours later?
18. Water is pumped out of a holding tank at a rate of 5 − 5e−0.12t liters/minute, where t is in minutes since the pump is started. If the holding tank contains 1000 liters of water when the pump is started, how much water does it hold one hour later?
19. With t in seconds, the velocity of an object is v(t) = 10 + 8t − t2 m/sec.
(a) Represent the distance traveled during the first 5 seconds as a definite integral and as an area.
(b) Estimate the distance traveled by the object during the first 5 seconds by estimating the area.
(c) Calculate the distance traveled.
20. A bungee jumper leaps off the starting platform at time t = 0 and rebounds once during the first 5 seconds. With velocity measured downward, for t in seconds and 0 ≤ t ≤ 5, the jumper's velocity is approximated10 by v(t) = −4t2 + 16t meters/sec.
(a) How many meters does the jumper travel during the first five seconds?
(b) Where is the jumper relative to the starting position at the end of the five seconds?
(c) What does ![]() represent in terms of the jump?
represent in terms of the jump?
21. After a foreign substance is introduced into the blood, the rate at which antibodies are made is given by
![]()
where time, t, is in minutes. Assuming there are no antibodies present at time t = 0, find the total quantity of antibodies in the blood at the end of 4 minutes.
22. Figure 5.49 gives your velocity during a trip starting from home. Positive velocities take you away from home and negative velocities take you toward home. Where are you at the end of the 5 hours? When are you farthest from home? How far away are you at that time?

23. A bicyclist pedals along a straight road with velocity, v, given in Figure 5.50. She starts 5 miles from a lake; positive velocities take her away from the lake and negative velocities take her toward the lake. When is the cyclist farthest from the lake, and how far away is she then?

24. Figure 5.51 shows the rate of growth of two trees. If the two trees are the same height at time t = 0, which tree is taller after 5 years? After 10 years?

Problems 25–27 concern the future of the US Social Security Trust Fund, out of which pensions are paid. Figure 5.52 shows the rates (billions of dollars per year) at which income, I(t), from taxes and interest is projected to flow into the fund and at which expenditures, E(t), flow out of the fund. Figure 5.53 shows the value of the fund as a function of time.11
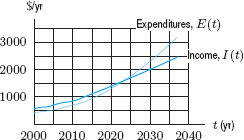

25. (a) Write each of the following areas in Figure 5.52 from 2000 to 2015 as an integral and explain its significance for the fund.
(i) Under the income curve
(ii) Under the expenditure curve
(iii) Between the income and expenditure curves
(b) Use Figure 5.53 to estimate the area between the two curves from 2000 to 2015.
26. Decide when the value of the fund is projected to be a maximum using
(a) Figure 5.52
(b) Figure 5.53
27. Express the projected increase in value of the fund from 2000 to 2030 as an integral.
28. The rates of consumption of stores of protein and fat in the human body during 8 weeks of starvation are shown in Figure 5.54. Does the body burn more fat or more protein during this period?

29. Figure 5.55 shows the number of sales per month made by two salespeople. Which person has the most total sales after 6 months? After the first year? At approximately what times (if any) have they sold roughly equal total amounts? Approximately how many total sales has each person made at the end of the first year?

30. The birth rate, B, in births per hour, of a bacteria population is given in Figure 5.56. The curve marked D gives the death rate, in deaths per hour, of the same population.
(a) Explain what the shape of each of these graphs tells you about the population.
(b) Use the graphs to find the time at which the net rate of increase of the population is at a maximum.
(c) At time t = 0 the population has size N. Sketch the graph of the total number born by time t. Also sketch the graph of the number alive at time t. Estimate the time at which the population is a maximum.

31. Height velocity graphs are used by endocrinologists to follow the progress of children with growth deficiencies. Figure 5.57 shows the height velocity curves of an average boy and an average girl between ages 3 and 18.
(a) Which curve is for girls and which is for boys? Explain how you can tell.
(b) About how much does the average boy grow between ages 3 and 10?
(c) The growth spurt associated with adolescence and the onset of puberty occurs between ages 12 and 15 for the average boy and between ages 10 and 12.5 for the average girl. Estimate the height gained by each average child during this growth spurt.
(d) When fully grown, about how much taller is the average man than the average woman? (The average boy and girl are about the same height at age 3.)

A healthy human heart pumps about 5 liters of blood per minute. Problems 32–33 refer to Figure 5.58, which shows the response of the heart to bleeding. The pumping rate drops and then returns to normal if the person recovers fully, or drops to zero if the person dies.

32. (a) If the body is bled 2 liters, how much blood is pumped during the three hours leading to death?
(b) If f(t) is the pumping rate in liters per minute at time t hours, express your answer to part (a) as a definite integral.
(c) How much more blood would have been pumped during the same time period if there had been no bleeding? Illustrate your answer on the graph.
33. (a) If the body is bled 1 liter, how much blood is pumped during the three hours leading to full recovery?
(b) If g(t) is the pumping rate in liters per minute at time t hours, express your answer to part (a) as a definite integral.
(c) How much more blood would have been pumped during the same time period if there had been no bleeding? Show your answer as an area on the graph.
34. The amount of waste a company produces, W, in tons per week, is approximated by W = 3.75e−0.008t, where t is in weeks since January 1, 2005. Waste removal for the company costs $15/ton. How much did the company pay for waste removal during the year 2005?
35. Figure 5.59 shows plasma concentration curves for two drugs used to slow a rapid heart rate. Compare the two products in terms of level of peak concentration, time until peak concentration, and overall bioavailability.

36. Figure 5.60 compares the concentration in blood plasma for two pain relievers. Compare the two products in terms of level of peak concentration, time until peak concentration, and overall bioavailability.

37. Draw plasma concentration curves for two drugs A and B if product A has the highest peak concentration, but product B is absorbed more quickly and has greater overall bioavailability.
38. A two-day environmental cleanup started at 9 am on the first day. The number of workers fluctuated as shown in Figure 5.61. If the workers were paid $10 per hour, how much was the total personnel cost of the cleanup?

39. Suppose in Problem 38 that the workers were paid $10 per hour for work during the time period 9 am to 5 pm and were paid $15 per hour for work during the rest of the day. What would the total personnel costs of the cleanup have been under these conditions?
40. At the site of a spill of radioactive iodine, radiation levels were four times the maximum acceptable limit, so an evacuation was ordered. If R0 is the initial radiation level (at t = 0) and t is the time in hours, the radiation level R(t), in millirems/hour, is given by
![]()
(a) How long does it take for the site to reach the acceptable level of radiation of 0.6 millirems/hour?
(b) How much total radiation (in millirems) has been emitted by that time?
41. If you jump out of an airplane and your parachute fails to open, your downward velocity (in meters per second) t seconds after the jump is approximated by
![]()
(a) Write an expression for the distance you fall in T seconds.
(b) If you jump from 5000 meters above the ground, estimate, using trial and error, how many seconds you fall before hitting the ground.
42. The Montgolfier brothers (Joseph and Etienne) were eighteenth-century pioneers of hot-air ballooning. Had they had the appropriate instruments, they might have left us a record, like that shown in Figure 5.62, of one of their early experiments. The graph shows their vertical velocity, v, with upward as positive.
(a) Over what intervals was the acceleration positive? Negative?
(b) What was the greatest altitude achieved, and at what time?
(c) This particular flight ended on top of a hill. How do you know that it did, and what was the height of the hill above the starting point?

5.5 TOTAL CHANGE AND THE FUNDAMENTAL THEOREM OF CALCULUS
In Section 5.4, we saw that the total change of a quantity can be obtained by integrating its rate of change. Since the change in F between a and b is F(b) − F(a) and the rate of change is F′(t), we have the following result:
The Fundamental Theorem of Calculus
If F′(t) is continuous for a ≤ t ≤ b, then

In words:
The definite integral of the derivative of a function gives the total change in the function.
In Section 6.3 we see how to use the Fundamental Theorem to compute a definite integral. The Focus on Theory Section gives another version of the Fundamental Theorem.
| Example 1 | Figure 5.63 shows F′(t), the rate of change of the value, F(t), of an investment over a 5-month period.
(a) When is the value of the investment increasing in value and when is it decreasing? (b) Does the investment increase or decrease in value during the 5 months?
Figure 5.63: Did the investment increase or decrease in value over these 5 months? |
| Solution | (a) The investment decreased in value during the first 3 months, since the rate of change of value is negative then. The value rose during the last 2 months.
(b) We want to find the total change in the value of the investment between t = 0 and t = 5. Since the total change is the integral of the rate of change, F′(t), we are looking for
The integral equals the shaded area above the t-axis minus the shaded area below the t-axis. Since in Figure 5.63 the area below the axis is greater than the area above the axis, the integral is negative. The total change in value of the investment during this time is negative, so it decreased in value. |


Marginal Cost and Change in Total Cost
Suppose C(q) represents the cost of producing q items. The derivative, C′(q), is the marginal cost. Since marginal cost C′(q) is the rate of change of the cost function with respect to quantity, by the Fundamental Theorem, the integral

represents the total change in the cost function between q = a and q = b. In other words, the integral gives the amount it costs to increase production from a units to b units.
The cost of producing 0 units is the fixed cost C(0). The area under the marginal cost curve between q = 0 and q = b is the total increase in cost between a production of 0 and a production of b. This is called the total variable cost. Adding this to the fixed cost gives the total cost to produce b units. In summary,
If C′(q) is a marginal cost function and C(0) is the fixed cost,

| Example 2 | A marginal cost curve is given in Figure 5.64. If the fixed cost is $1000, estimate the total cost of producing 250 items. |
| Solution | The total cost of production is Fixed cost + Total variable cost. The total variable cost of producing 250 items is represented by the area under the marginal cost curve. The area in Figure 5.64 between q = 0 and q = 250 is about 20 grid boxes. Each grid box has area (2 dollars/item)(50 items) = 100 dollars, so
The total cost to produce 250 items is given by: |

Problems for Section 5.5
1. A cup of coffee at 90°C is put into a 20°C room when t = 0. The coffee's temperature is changing at a rate of r(t) = −7(0.9t) °C per minute, with t in minutes. Estimate the coffee's temperature when t = 10.
2. If the marginal cost function C′(q) is measured in dollars per ton, and q gives the quantity in tons, what are the units of measurement for ![]() ? What does this integral represent?
? What does this integral represent?
3. The marginal cost of drilling an oil well depends on the depth at which you are drilling; drilling becomes more expensive, per meter, as you dig deeper into the earth. The fixed costs are 1,000,000 riyals (the riyal is the unit of currency of Saudi Arabia), and, if x is the depth in meters, the marginal costs are
![]()
Find the total cost of drilling a 500-meter well.
4. The population of Tokyo grew at the rate shown in Figure 5.65. Estimate the change in population between 1970 and 1990.

5. A marginal cost function C′(q) is given in Figure 5.66. If the fixed cost is $10,000, estimate:
(a) The total cost to produce 30 units.
(b) The additional cost if the company increases production from 30 units to 40 units.
(c) The value of C′(25). Interpret your answer in terms of costs of production.

6. Figure 5.67 shows the rate of change of the quantity of water in a water tower, in liters per day, during the month of April. If the tower had 12,000 liters of water in it on April 1, estimate the quantity of water in the tower on April 30.

7. The total cost in dollars to produce q units of a product is C(q). Fixed costs are $20,000. The marginal cost is
![]()
(a) On a graph of C′(q), illustrate graphically the total variable cost of producing 150 units.
(b) Estimate C(150), the total cost to produce 150 units.
(c) Find the value of C′(150) and interpret your answer in terms of costs of production.
(d) Use parts (b) and (c) to estimate C(151).
8. The marginal cost C′(q) (in dollars per unit) of producing q units is given in the following table.
(a) If fixed cost is $10,000, estimate the total cost of producing 400 units.
(b) How much would the total cost increase if production were increased one unit, to 401 units?

9. The marginal cost function for a company is given by
![]()
where q is the quantity produced. If C(0) = 500, find the total cost of producing 20 units. What is the fixed cost and what is the total variable cost for this quantity?
10. The marginal cost function of producing q mountain bikes is
![]()
(a) If the fixed cost in producing the bicycles is $2000, find the total cost to produce 30 bicycles.
(b) If the bikes are sold for $200 each, what is the profit (or loss) on the first 30 bicycles?
(c) Find the marginal profit on the 31st bicycle.
11. The marginal revenue function on sales of q units of a product is R′(q) = 200 − 12![]() dollars per unit.
dollars per unit.
(a) Graph R′(q).
(b) Estimate the total revenue if sales are 100 units.
(c) What is the marginal revenue at 100 units? Use this value and your answer to part (b) to estimate the total revenue if sales are 101 units.
12. Figure 5.68 shows P′(t), the rate of change of the price of stock in a certain company at time t.
(a) At what time during this five-week period was the stock at its highest value? At its lowest value?
(b) If P(t) represents the price of the stock, arrange the following quantities in increasing order:
![]()

13. The net worth, f(t), of a company is growing at a rate of f′(t) = 2000 − 12t2 dollars per year, where t is in years since 2005. How is the net worth of the company expected to change between 2005 and 2015? If the company is worth $40,000 in 2005, what is it worth in 2015?
14. The graph of a derivative f′(x) is shown in Figure 5.69. Fill in the table of values for f(x) given that f(0) = 2.
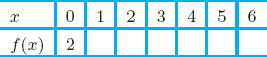

Figure 5.69: Graph of f′, not f
15. The derivative f′(x) is graphed in Figure 5.70. Fill in the table of values for f(x) given that f(0) = −10.


Figure 5.70: Graph of f′, not f
In Problems 16–17, oil is pumped from a well at a rate of r(t) barrels per day, with t in days. Assume r′(t) < 0 and t0 > 0.
16. What does the value of ![]() tells us about the oil well?
tells us about the oil well?
17. Rank in order from least to greatest:

In Problems 18–20, let C(n) be a city's cost, in millions of dollars, for plowing the roads, when n inches of snow have fallen. Let c(n) = C′(n). Evaluate the expressions and interpret your answers in terms of the cost of plowing snow, given

18. ![]()
19. C(0)
20. ![]()
Problems 21–23 refer to a May 2, 2010, article:12
“The crisis began around 10 am yesterday when a 10-foot wide pipe in Weston sprang a leak, which worsened throughout the afternoon and eventually cut off Greater Boston from the Quabbin Reservoir, where most of its water supply is stored. . . Before water was shut off to the ruptured pipe [at 6:40 pm], brown water had been roaring from a massive crater [at a rate of] 8 million gallons an hour rushing into the nearby Charles River.”
Let r(t) be the rate in gallons/hr that water flowed from the pipe t hours after it sprang its leak.
21. Which is larger: ![]()
22. Which is larger: ![]()
23. Give a reasonable overestimate of ![]() .
.
5.6 AVERAGE VALUE
In this section we show how to interpret the definite integral as the average value of a function.
The Definite Integral as an Average
We know how to find the average of n numbers: Add them and divide by n. But how do we find the average value of a continuously varying function? Let us consider an example. Suppose f(t) is the temperature at time t, measured in hours since midnight, and that we want to calculate the average temperature over a 24-hour period. One way to start would be to average the temperatures at n equally spaced times, t1, t2, . . . , tn, during the day.
![]()
The larger we make n, the better the approximation. We can rewrite this expression as a Riemann sum over the interval 0 ≤ t ≤ 24 if we use the fact that Δt = 24/n, so n = 24/Δt:

As n → ∞, the Riemann sum tends toward an integral, and the approximation gets better. We expect that

Generalizing for any function f, if a < b, we have

The units of the average value of f(x) are the same as the units of f(x).
How to Visualize the Average on a Graph
The definition of average value tells us that

Let's interpret the integral as the area under the graph of f. If f(x) is positive, then the average value of f is the height of a rectangle whose base is (b − a) and whose area is the same as the area between the graph of f and the x-axis. (See Figure 5.71.)

Figure 5.71: Area and average value
| Example 1 | Suppose that C(t) represents the daily cost of heating your house, in dollars per day, where t is time in days and t = 0 corresponds to January 1, 2010. Interpret |
| Solution | The units for the integral |
| Example 2 | The population of McAllen, Texas can be modeled by the function
where P is in thousands of people and t is in years since 2000. Use this function to predict the average population of McAllen between the years 2020 and 2040. |
| Solution | We want the average value of f(t) between t = 20 and t = 40. Using a calculator to evaluate the integral, we get
The average population of McAllen between 2020 and 2040 is predicted to be about 1733 thousand people. |

| Example 3 | (a) For the function f(x) graphed in Figure 5.72, evaluate (b) Find the average value of f(x) on the interval x = 0 to x = 5. Check your answer graphically.
|
| Solution | (a) Since f(x) ≥ 0, the definite integral is the area of the region under the graph of f(x) between x = 0 and x = 5. Figure 5.72 shows that this region consists of 13 full grid squares and 4 half grid squares, each grid square of area 1, for a total area of 15, so
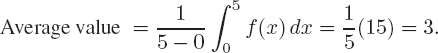
(b) The average value of f(x) on the interval from 0 to 5 is given by
To check the answer graphically, draw a horizontal line at y = 3 on the graph of f(x). (See Figure 5.73.) Then observe that, between x = 0 and x = 5, the area under the graph of f(x) is equal to the area of the rectangle with height 3. |


Problems for Section 5.6
1. (a) Use Figure 5.74 to find ![]() .
.
(b) What is the average value of f on the interval x = 0 to x = 6?
2. Use Figure 5.75 to estimate the following:
(a) The integral ![]() .
.
(b) The average value of f between x = 0 and x = 5 by estimating visually the average height.
(c) The average value of f between x = 0 and x = 5 by using your answer to part (a).

In Problems 3–4, find the average value of the function over the given interval.
3. g(t) = 1 + t over [0, 2]
4. g(t) = et over [0, 10]
5. (a) What is the average value of ![]() over the interval 0 ≤ x ≤ 1?
over the interval 0 ≤ x ≤ 1?
(b) How can you tell whether this average value is more or less than 0.5 without doing any calculations?
In Problems 6–7, estimate the average value of the function between x = 0 and x = 7.
6.

7.
In Problems 8–9, estimate the average value of f(x) from x = a to x = b.
8.

9.

10. The value, V, of a Tiffany lamp, worth $225 in 1975, increases at 15% per year. Its value in dollars t years after 1975 is given by
![]()
Find the average value of the lamp over the period 1975–2010.
11. If t is measured in days since June 1, the inventory I(t) for an item in a warehouse is given by
![]()
(a) Find the average inventory in the warehouse during the 90 days after June 1.
(b) Graph I(t) and illustrate the average graphically.
12. The population of the world t years after 2010 is predicted to be P = 6.9e0.012t billion.
(a) What population is predicted in 2020?
(b) What is the predicted average population between 2010 and 2020?
In Problems 13–14 annual income for ages 25 to 85 is given graphically. People sometimes spend less than their income (to save for retirement) or more than their income (taking out a loan). The process of spreading out spending over a lifetime is called consumption smoothing.
(a) Find the average annual income for these years.
(b) Assuming that people spend at a constant rate equal to their average income, when are they spending less than they earn, and when are they spending more?
13.

14.

Problems 15–16 refer to Figure 5.76, which shows human arterial blood pressure during the course of one heartbeat.

15. (a) Estimate the maximum blood pressure, called the systolic pressure.
(b) Estimate the minimum blood pressure, called the diastolic pressure.
(c) Calculate the average of the systolic and diastolic pressures.
(d) Is the average arterial pressure over the entire cycle greater than, less than, or equal to the answer for part (c)?
16. Estimate the average arterial blood pressure over one cardiac cycle.
17. Figure 5.77 shows the rate, f(x), in thousands of algae per hour, at which a population of algae is growing, where x is in hours.
(a) Estimate the average value of the rate over the interval x = −1 to x = 3.
(b) Estimate the total change in the population over the interval x = −3 to x = 3.

18. The number of hours, H, of daylight in Madrid as a function of date is approximated by the formula
![]()
where t is the number of days since the start of the year. Find the average number of hours of daylight in Madrid:
(a) in January
(b) in June
(c) over a year
(d) Explain why the relative magnitudes of your answers to parts (a), (b), and (c) are reasonable.
19. A bar of metal is cooling from 1000°C to room temperature, 20°C. The temperature, H, of the bar t minutes after it starts cooling is given, in °C, by
![]()
(a) Find the temperature of the bar at the end of one hour.
(b) Find the average value of the temperature over the first hour.
(c) Is your answer to part (b) greater or smaller than the average of the temperatures at the beginning and the end of the hour? Explain this in terms of the concavity of the graph of H.
20. The rate of sales (in sales per month) of a company is given, for t in months since January 1, by
![]()
(a) Graph the rate of sales per month during the first year (t = 0 to t = 12). Does it appear that more sales were made during the first half of the year, or during the second half?
(b) Estimate the total sales during the first 6 months of the year and during the last 6 months of the year.
(c) What are the total sales for the entire year?
(d) Find the average sales per month during the year.
21. Throughout much of the 20th century, the yearly consumption of electricity in the US increased exponentially at a continuous rate of 7% per year. Assume this trend continues and that the electrical energy consumed in 1900 was 1.4 million megawatt-hours.
(a) Write an expression for yearly electricity consumption as a function of time, t, in years since 1900.
(b) Find the average yearly electrical consumption throughout the 20th century.
(c) During what year was electrical consumption closest to the average for the century?
(d) Without doing the calculation for part (c), how could you have predicted which half of the century the answer would be in?
22. Using Figure 5.78, list the following numbers from least to greatest:
(a) f′(1)
(b) The average value of f on 0 ≤ x ≤ 4
(c) ![]()

23. Using Figure 5.79, list from least to greatest,
(a) f′(1).
(b) The average value of f(x) on 0 ≤ x ≤ a.
(c) The average value of the rate of change of f(x), for 0 ≤ x ≤ a.
(d) ![]() .
.

CHAPTER SUMMARY
- Definite integral as limit of right-hand or left-hand sums
- Interpretations of the definite integral
Total change from rate of change, change in position given velocity, area, bioavailability, total variable cost.
- Working with the definite integral
Estimate definite integral from graph, table of values, or formula.
- Fundamental Theorem of Calculus
Marginal cost and total cost
- Average value
REVIEW PROBLEMS FOR CHAPTER FIVE
1. The velocity v(t) in Table 5.8 is decreasing, 2 ≤ t ≤ 12. Using n = 5 subdivisions to approximate the total distance traveled, find
(a) An upper estimate
(b) A lower estimate
2. The velocity v(t) in Table 5.9 is increasing, 0 ≤ t ≤ 12.
(a) Find an upper estimate for the total distance traveled using
(i) n = 4
(ii) n = 2
(b) Which of the two answers in part (a) is more accurate? Why?
(c) Find a lower estimate of the total distance traveled using n = 4.
3. Use the following table to estimate ![]() .
.
4. If f(t) is measured in miles per hour and t is measured in hours, what are the units of ![]() ?
?
5. Figure 5.80 shows the velocity of a runner for 0 ≤ t ≤ 8 and the rectangles used to estimate the distance traveled.
(a) Do the rectangles represent a left or a right sum?
(b) Do the rectangles lead to an upper or a lower estimate?
(c) What is the value of n?
(d) What is the value of Δt?
(e) Give an approximate value for the estimate.

6. If f(t) is measured in meters/second2 and t is measured in seconds, what are the units of ![]() ?
?
7. If f(t) is measured in dollars per year and t is measured in years, what are the units of ![]() ?
?
8. If f(x) is measured in pounds and x is measured in feet, what are the units of ![]() ?
?
9. As coal deposits are depleted, it becomes necessary to strip-mine larger areas for each ton of coal. Figure 5.81 shows the number of acres of land per million tons of coal that will be defaced during strip-mining as a function of the number of million tons removed, starting from the present day.
(a) Estimate the total number of acres defaced in extracting the next 4 million tons of coal (measured from the present day). Draw four rectangles under the curve, and compute their area.
(b) Re-estimate the number of acres defaced using rectangles above the curve.
(c) Use your answers to parts (a) and (b) to get a better estimate of the actual number of acres defaced.

10. Find the area under y = x3 + 2 between x = 0 and x = 2. Sketch this area.
11. Find the area under the graph of y = 10x(3−x) between x = 0 and x = 3. Sketch this area.
For Problems 12–19, use a calculator or computer to evaluate the integral.
12. ![]()
13. ![]()
14. ![]()
15. ![]()
16. ![]()
17. ![]()
18. ![]()
19. ![]()
In Problems 20–23, find the given area.
20. Between y = x2 and y = x3 for 0 ≤ x ≤ 1.
21. Between y = x1/2 and y = x1/3 for 0 ≤ x ≤ 1.
22. Between y = 3x and y = x2.
23. Between y = x and y = ![]() .
.
24. Coal gas is produced at a gasworks. Pollutants in the gas are removed by scrubbers, which become less and less efficient as time goes on. The following measurements, made at the start of each month, show the rate at which pollutants are escaping (in tons/month) in the gas:

(a) Make an overestimate and an underestimate of the total quantity of pollutants that escape during the first month.
(b) Make an overestimate and an underestimate of the total quantity of pollutants that escape during the six months.
25. A student is speeding down Route 11 in his fancy red Porsche when his radar system warns him of an obstacle 400 feet ahead. He immediately applies the brakes, starts to slow down, and spots a skunk in the road directly ahead of him. The “black box” in the Porsche records the car's speed every two seconds, producing the following table. The speed decreases throughout the 10 seconds it takes to stop, although not necessarily at a constant rate.

(a) What is your best estimate of the total distance the student's car traveled before coming to rest?
(b) Which one of the following statements can you justify from the information given?
(i) The car stopped before getting to the skunk.
(ii) The “black box” data is inconclusive. The skunk may or may not have been hit.
(iii) The skunk was hit by the car.
26. The velocity of a particle moving along the x-axis is given by f(t) = 6 − 2t cm/sec. Use a graph of f(t) to find the exact change in position of the particle from time t = 0 to t = 4 seconds.
27. A baseball thrown directly upward at 96 ft/sec has velocity v(t) = 96 − 32t ft/sec at time t seconds.
(a) Graph the velocity from t = 0 to t = 6.
(b) When does the baseball reach the peak of its flight? How high does it go?
(c) How high is the baseball at time t = 5?
28. A news broadcast in early 1993 said the typical American's annual income is changing at a rate of r(t) = 40(1.002)t dollars per month, where t is in months from January 1, 1993. How much did the typical American's income change during 1993?
29. Two species of plants have the same populations at time t = 0 and the growth rates shown in Figure 5.82.
(a) Which species has a larger population at the end of 5 years? At the end of 10 years?
(b) Which species do you think has the larger population after 20 years? Explain.

30. Figure 5.83 represents your velocity, v, on a bicycle trip along a straight road which starts 10 miles from home. Write a paragraph describing your trip: Do you start out going toward or away from home? How long do you continue in that direction and how far are you from home when you turn around? How many times do you change direction? Do you ever get home? Where are you at the end of the four-hour bike ride?

31. Figure 5.84 shows the weight growth rate of a human fetus.
(a) What property of a graph of weight as a function of age corresponds to the fact that the function in Figure 5.84 is increasing?
(b) Estimate the weight of a baby born in week 40.

Figure 5.84: Rate of increase of fetal weight
32. A bicyclist is pedaling along a straight road for one hour with a velocity v shown in Figure 5.85. She starts out five kilometers from the lake and positive velocities take her toward the lake. [Note: The vertical lines on the graph are at 10 minute (1/6 hour) intervals.]
(a) Does the cyclist ever turn around? If so, at what time(s)?
(b) When is she going the fastest? How fast is she going then? Toward the lake or away?
(c) When is she closest to the lake? Approximately how close to the lake does she get?
(d) When is she farthest from the lake? Approximately how far from the lake is she then?

In Problems 33–36, decide whether ![]() is positive, negative, or approximately zero.
is positive, negative, or approximately zero.
33.

34.

35.
36.

37. Given ![]() and Figure 5.86, estimate:
and Figure 5.86, estimate:
(a) ![]()
(b) ![]()
(c) The total shaded area.

38. Use a graph of y = 2−x2 to explain why ![]() must be between 0 and 2.
must be between 0 and 2.
39. Without computation, show that ![]() .
.
40. The velocity of a car (in miles per hour) is given by v(t) = 40t − 10t2, where t is in hours.
(a) Write a definite integral for the distance the car travels during the first three hours.
(b) Sketch a graph of velocity against time and represent the distance traveled during the first three hours as an area on your graph.
(c) Use a computer or calculator to find this distance.
41. The world's oil is being consumed at a continuously increasing rate, f(t) (in billions of barrels per year), where t is in years since the start of 1995.
(a) Write a definite integral which represents the total quantity of oil used between the start of 1995 and the start of 2010.
(b) Suppose r = 32(1.05)t. Using a left-hand sum with five subdivisions, find an approximate value for the total quantity of oil used between the start of 1995 and the start of 2010.
(c) Interpret each of the five terms in the sum from part (b) in terms of oil consumption.
42. A car moves along a straight line with velocity, in feet/second, given by
![]()
(a) With forward being the direction of positive velocity, when is the car moving forward? Backward? Stopped?
(b) Does the car ever return to its starting point? If so, when?
(c) With position measured from its starting point, when is the car farthest forward? Farthest backward?
43. The marginal cost function of a product, in dollars per unit, is C′(q) = q2 − 50q + 700. If fixed costs are $500, find the total cost to produce 50 items.
44. A warehouse charges its customers $5 per day for every 10 cubic feet of space used for storage. Figure 5.87 records the storage used by one company over a month. How much will the company have to pay?

45. One of the earliest pollution problems brought to the attention of the Environmental Protection Agency (EPA) was the case of Sioux Lake in eastern South Dakota. For years a small paper plant located nearby had been discharging waste containing carbon tetrachloride (CCl4) into the waters of the lake. At the time the EPA learned of the situation, the chemical was entering at a rate of 16 cubic yards/year.
The agency immediately ordered the installation of filters designed to slow (and eventually stop) the flow of CCl4 from the mill. Implementation of this program took exactly three years, during which the flow of pollutant was steady at 16 cubic yards/year. Once the filters were installed, the flow declined. From the time the filters were installed until the time the flow stopped, the rate of flow was well approximated by
![]()
where t is time measured in years since the EPA learned of the situation (thus, t ≥ 3).
(a) Draw a graph showing the rate of CCl4 flow into the lake as a function of time, beginning at the time the EPA first learned of the situation.
(b) How many years elapsed between the time the EPA learned of the situation and the time the pollution flow stopped entirely?
(c) How much CCl4 entered the waters during the time shown in the graph in part (a)?
46. (a) Graph x3 −5x2 + 4x, marking x = 1, 2, 3, 4, 5.
(b) Use your graph and the area interpretation of the definite integral to decide which of the five numbers
![]()
is largest. Which is smallest? How many of the numbers are positive? (Don't calculate the integrals.)
47. A mouse moves back and forth in a straight tunnel, attracted to bits of cheddar cheese alternately introduced to and removed from the ends (right and left) of the tunnel. The graph of the mouse's velocity, v, is given in Figure 5.88, with positive velocity corresponding to motion toward the right end. Assuming that the mouse starts (t = 0) at the center of the tunnel, use the graph to estimate the time(s) at which:
(a) The mouse changes direction.
(b) The mouse is moving most rapidly to the right; to the left.
(c) The mouse is farthest to the right of center; farthest to the left.
(d) The mouse's speed (i.e., the magnitude of its velocity) is decreasing.
(e) The mouse is at the center of the tunnel.

48. Pollution is being dumped into a lake at a rate which is increasing at a constant rate from 10 kg/year to 50 kg/year until a total of 270 kg has been dumped. Sketch a graph of the rate at which pollution is being dumped in the lake against time. How long does it take until 270 kg has been dumped?
For Problems 49–51, suppose F(0) = 0 and F′(x) = 4 − x2.
49. Calculate F(b) for b = 0, 0.5, 1, 1.5, 2, 2.5.
50. Using a graph of F′, decide where F is increasing and where F is decreasing for 0 ≤ x ≤ 2.5.
51. Does F have a maximum value for 0 ≤ x ≤ 2.5? If so, what is it, and at what value of x does it occur?
52. What is the average value of the function f in Figure 5.89 over the interval 1 ≤ x ≤ 6?

53. Find the average value of g(t) = et over the interval 0 ≤ t ≤ 10.
54. Find the average value of the function f(x) = 5+4x−x2 between x = 0 and x = 3.
55. A service station orders 100 cases of motor oil every 6 months. The number of cases of oil remaining t months after the order arrives is modeled by
![]()
(a) How many cases are there at the start of the six-month period? How many cases are left at the end of the six-month period?
(b) Find the average number of cases in inventory over the six-month period.
56. The quantity of a radioactive substance at time t is
![]()
(a) Find Q(10) and Q(20).
(b) Find the average of Q(10) and Q(20).
(c) Find the average value of Q(t) over the interval 10 ≤ t ≤ 20.
(d) Use the graph of Q(t) to explain the relative sizes of your answers in parts (b) and (c).
In Problems 57–58, estimate the average value of the function f(x) on the interval from x = a to x = b.
57.

58.

59. The function f in Figure 5.90 is symmetric about the y-axis. Consider the average value of f over the following intervals:
I. 0 ≤ x ≤ 1
II. 0 ≤ x ≤ 2
III. 0 ≤ x ≤ 5
IV. −2 ≤ x ≤ 2
(a) For which interval is the average value of f least?
(b) For which interval is the average value of f greatest?
(c) For which pair of intervals are the average values equal?
60. For the function f in Figure 5.90, write an expression involving one or more definite integrals of f that denote:
(a) The average value of f for 0 ≤ x ≤ 5.
(b) The average value of |f| for 0 ≤ x ≤ 5.

STRENGTHEN YOUR UNDERSTANDING
In Problems 1–60, indicate whether the statement is true or false.
1. If the velocity is positive, then the total distance traveled is the area under the velocity curve.
2. If velocity is constant and positive, then distance traveled during a time interval is the velocity multiplied by the length of the interval.
3. If velocity is positive and increasing, using the velocity at the beginning of each subinterval gives an overestimate of the distance traveled.
4. A car traveling with increasing velocity (in feet per second) given in the following table travels more than 40 feet between t = 4 and t = 6 seconds.

5. A car traveling with increasing velocity (in feet per second) given in the following table travels less than 40 feet between t = 4 and t = 6 seconds.

6. If water flows out of a tank at an increasing rate starting at 20 gallons per minute at the start of a 10-minute period and ending at 50 gallons per minute at the end of the 10-minute period, then at least 200 gallons have flowed out of the tank.
7. If water flows out of a tank at an increasing rate starting at 20 gallons per minute at the start of a 10-minute period and ending at 50 gallons per minute at the end of the 10-minute period, then at least 500 gallons have flowed out of the tank.
8. At a construction site, money is spent at a continuous, decreasing rate of r(t) dollars per day, where t is in days. If the rates at two particular instants, t = 3 and t = 5, are given in the table, then at least $3000 is spent between t = 3 and t = 5.
9. An object traveling with velocity given by v(t) = 3t feet per second travels exactly 150 feet when 0 ≤ t ≤ 10 seconds.
10. The units of total change and rate of change of a quantity are the same.
11. If f(t) is increasing, then the left-hand sum gives an overestimate of ![]() .
.
12. If f(t) is concave up, then the left-hand sum gives an overestimate of ![]() .
.
13. A left-hand sum estimate for ![]() is 3000, if f(t) is shown in the following table.
is 3000, if f(t) is shown in the following table.
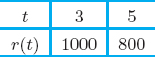
14. A right-hand sum estimate for ![]() is 1600, if f(t) is shown in the following table.
is 1600, if f(t) is shown in the following table.

15. If the number of terms in a Riemann sum increases, the quantity Δt decreases.
16. A 4-term Riemann sum on the interval 4 ≤ t ≤ 6 has Δt = 2.
17. The right-hand sum for ![]() is the total area of rectangles that are above the graph of f(t).
is the total area of rectangles that are above the graph of f(t).
18. If f(t) ≥ 0 then ![]() is the area between the t-axis and the graph of f(t), for a ≤ t ≤ b.
is the area between the t-axis and the graph of f(t), for a ≤ t ≤ b.
19. If f(t) = t2 then the left-hand sum gives an overestimate for ![]() .
.
20. The right-hand sum for ![]() using n = 5 rectangles has Δt = 5.
using n = 5 rectangles has Δt = 5.
21. The integral ![]() gives the area between the x-axis and the graph of f(x) between x = 0 and x = 2.
gives the area between the x-axis and the graph of f(x) between x = 0 and x = 2.
22. If ![]() = 0 then f(x) = 0 for all 0 ≤ x ≤ 2.
= 0 then f(x) = 0 for all 0 ≤ x ≤ 2.
23. If ![]() > 0 then f(x) > 0 for all 0 ≤ x ≤ 2.
> 0 then f(x) > 0 for all 0 ≤ x ≤ 2.
24. If f(x) > 0 for all 0 ≤ x ≤ 2 then ![]() .
.
25. The integral ![]() is the negative of the area between the graph of f(x) = x2 − 1 and the x-axis for −1 ≤ x ≤ 1.
is the negative of the area between the graph of f(x) = x2 − 1 and the x-axis for −1 ≤ x ≤ 1.
26. If f(x) is both positive and negative when 0 ≤ x ≤ 2 then ![]() is the sum of the areas between the graph and the x-axis for 0 ≤ x ≤ 2.
is the sum of the areas between the graph and the x-axis for 0 ≤ x ≤ 2.
27. The integral ![]() is the area between the graph of f(x) = 1 − x and the x-axis between x = 0 and x = 3.
is the area between the graph of f(x) = 1 − x and the x-axis between x = 0 and x = 3.
28. The integral ![]() is the area between the graph of f(x) = ex and the x-axis between x = −1 and x = 2.
is the area between the graph of f(x) = ex and the x-axis between x = −1 and x = 2.
29. If f(x) ≥ g(x) for all a ≤ x ≤ b then ![]() gives the area between the graphs of f(x) and g(x) for a ≤ x ≤ b.
gives the area between the graphs of f(x) and g(x) for a ≤ x ≤ b.
30. If the graph of f(x) has more area below the x-axis than above the x-axis when 1 ≤ x ≤ 10 then ![]() is negative.
is negative.
31. If flow rate r(t) has units gallons per hour, and t has units in hours, then ![]() has units of gallons.
has units of gallons.
32. If expense rate s(t) has units dollars per day, and t has units in days, then ![]() has units of days.
has units of days.
33. If acceleration a(t) has units feet/(second)2, and t has units in seconds, then ![]() has units of feet/second.
has units of feet/second.
34. If w(t) is the number of workers on a building construction site as a function of t, the number of days since the start of construction, then ![]() has units of workers per day.
has units of workers per day.
35. If C(t) is the rate, in dollars per day, for electricity to cool and heat a home on day t, where t is measured in days since January 1, then ![]() has units of dollars.
has units of dollars.
36. If electricity costs f(t) dollars per day, and t is measured in days, then ![]() gives the total cost of electricity, in dollars, for the 30-day period from t = 0 to t = 30.
gives the total cost of electricity, in dollars, for the 30-day period from t = 0 to t = 30.
37. If f(t) gives the rate of change of water in a reservoir, in gallons per day, and t is measured in days, then ![]() gives the total volume of water, in gallons, in the reservoir on day t = 30.
gives the total volume of water, in gallons, in the reservoir on day t = 30.
38. If f(t) gives the rate of change of water in a reservoir, in gallons per day, and t is measured in days, then ![]() gives the total change in the volume of water, in gallons, in the reservoir during the period t = 0 to t = 30.
gives the total change in the volume of water, in gallons, in the reservoir during the period t = 0 to t = 30.
39. Bioavailability is the integral of blood concentration as a function of time.
40. If the peak concentration of drug A is greater than the peak concentration of drug B then the bioavailability of drug A is greater than the bioavailability of drug B.
41. The Fundamental Theorem of Calculus says if F(t) is continuous, then ![]() .
.
42. The Fundamentat Theorem of Calculus says if g′(t) is continuous, then ![]() .
.
43. The Fundamental Theorem of Calculus says if F′(t) is continuous, then ![]() .
.
44. If C(q) is the cost to produce q units, then ![]() is the amount it costs to increase production from 100 to 200 units.
is the amount it costs to increase production from 100 to 200 units.
45. If C(q) is the cost to produce q units, then ![]() is the total amount it costs to produce 1000 units.
is the total amount it costs to produce 1000 units.
46. If the marginal cost function of a product is C′(q) = 0.03q + 0.1 dollars, and the fixed costs are $1500, then the total cost to produce 1000 items is $15,100.
47. The integral of the marginal cost C′(q) function can be used to find the fixed costs.
48. If ![]() , then F is constant on the interval between t = 0 and t = 5.
, then F is constant on the interval between t = 0 and t = 5.
49. If ![]() , then F(0) > F(5).
, then F(0) > F(5).
50. If F′(t) is constant, then ![]() .
.
51. The average value of f(x) on the interval 0 ≤ x ≤ 10 is ![]() .
.
52. If f(0) = 0 and f(10) = 50, then the average value of f on the interval 0 ≤ x ≤ 10 is between 0 and 50.
53. If f is a continuous increasing function and f(0) = 0 and f(10) = 50, then the average value of f on the interval 0 ≤ x ≤ 10 is between 0 and 50.
54. The units of the average value of f are the same as the units of f.
55. The average value of f over the interval 0 ≤ x ≤ 20 is twice the average value of f over the interval 0 ≤ x ≤ 10.
56. The average value of 2f(x) over the interval 0 ≤ x ≤ 10 is twice the average value of f(x) over the interval 0 ≤ x ≤ 10.
57. If the average value of f over the interval 0 ≤ x ≤ 10 is 0, then f(x) = 0 for all 0 ≤ x ≤ 10.
58. If f(x) > g(x) ≥ 0, then the average value of f(x) for 0 ≤ x ≤ 10 is greater than the average value of g(x) for 0 ≤ x ≤ 10.
59. The average value of f on the interval 5 ≤ x ≤ 7 is one half of ![]() .
.
60. The average value of the cost function C(q) for 0 ≤ q ≤ 10 is the same as the average cost for 10 items.
PROJECTS FOR CHAPTER FIVE
1. Carbon Dioxide in Pond Water Biological activity in a pond is reflected in the rate at which carbon dioxide, CO2, is added to or withdrawn from the water. Plants take CO2 out of the water during the day for photosynthesis and put CO2 into the water at night. Animals put CO2 into the water all the time as they breathe. Biologists are interested in how the net rate at which CO2 enters a pond varies during the day. Figure 5.91 shows this rate as a function of time of day.13 The rate is measured in millimoles (mmol) of CO2 per liter of water per hour; time is measured in hours past dawn. At dawn, there were 2.600 mmol of CO2 per liter of water.
(a) What can be concluded from the fact that the rate is negative during the day and positive at night?
(b) Some scientists have suggested that plants respire (breathe) at a constant rate at night, and that they photosynthesize at a constant rate during the day. Does Figure 5.91 support this view?
(c) When was the CO2 content of the water at its lowest? How low did it go?
(d) How much CO2 was released into the water during the 12 hours of darkness? Compare this quantity with the amount of CO2 withdrawn from the water during the 12 hours of daylight. How can you tell by looking at the graph whether the CO2 in the pond is in equilibrium?
(e) Estimate the CO2 content of the water at three-hour intervals throughout the day. Use your estimates to plot a graph of CO2 content throughout the day.

Figure 5.91: Rate at which CO2 is entering the pond
2. Flooding in the Grand Canyon
The Glen Canyon Dam at the top of the Grand Canyon prevents natural flooding. In 1996, scientists decided an artificial flood was necessary to restore the environmental balance. Water was released through the dam at a controlled rate14 shown in Figure 5.92. The figure also shows the rate of flow of the last natural flood in 1957.
(a) At what rate was water passing through the dam in 1996 before the artificial flood?
(b) At what rate was water passing down the river in the pre-flood season in 1957?
(c) Estimate the maximum rates of discharge for the 1996 and 1957 floods.
(d) Approximately how long did the 1996 flood last? How long did the 1957 flood last?
(e) Estimate how much additional water passed down the river in 1996 as a result of the artificial flood.
(f) Estimate how much additional water passed down the river in 1957 as a result of the flood.

3. Medical Case Study: Flux of Fluid from a Capillary15
The heart pumps blood throughout the body, the arteries are the blood vessels carrying blood away from the heart, and the veins return blood to the heart. Close to the heart, arteries are very large. As they progress toward tissues (such as the brain), the arteries branch repeatedly, getting smaller as they do. The smallest blood vessels are capillaries—microscopic, living tubes that link the smallest arteries to the smallest veins. The capillary is where nutrients and fluids move out of the blood into the adjacent tissues and waste products from the tissues move into the blood. The key to this process is the capillary wall, which is only one cell thick, allowing the unfettered passage of small molecules, such as water, ions, oxygen, glucose, and amino acids, while preventing the passage of large components of the blood (such as large proteins and blood cells).
Precise measurements demonstrate that the flux (rate of flow) of fluid through the capillary wall is not constant over the length of the capillary. Fluids in and around the capillary are subjected to two forces. The hydrostatic pressure, resulting from the heart's pumping, pushes fluid out of the capillary into the surrounding tissue. The oncotic pressure drives absorption in the other direction. At the start of a capillary, where the capillary branches off the small artery, the hydrostatic pressure is high while the oncotic pressure is low. Along the length of the capillary, the hydrostatic pressure decreases while the oncotic pressure is approximately constant. See Figure 5.93.
For most capillaries there is a net positive value for flow: more fluid flows from the capillaries into the surrounding tissue than the other way around. This presents a major problem for maintaining fluid balance in the body. How is the fluid left in the tissues to get back into circulation? If it cannot, the tissues progressively swell (a condition called edema). Evolution's solution is to provide humans and other mammals with a second set of vessels, the lymphatics, that absorb extra tissue fluid and provide one-way routes back to the bloodstream.
Along a cylindrical capillary of length L = 0.1 cm and radius r = 0.0004 cm, the hydrostatic pressure, ph, varies from 35 mm Hg at the artery end to 15 mm Hg at the vein end. (mm Hg, millimeters of mercury, is a unit of pressure.) The oncotic pressure, po, is approximately 23 mm Hg throughout the length of the capillary.
(a) Find a formula for ph as a function of x, the distance in centimeters from the artery end of the capillary, assuming that ph is a linear function of x.
(b) Find a formula for p, the net outward pressure, as a function of x.
(c) Write and evaluate an integral for the average outward net pressure in the capillary.
(d) The rate of movement, j, of fluid volume per capillary wall area across the capillary wall is proportional to the net pressure. We have j = k · p where k, the hydraulic conductivity, has value
![]()
Check that j has units of volume per time per area.
(e) Estimate the net volume flow rate (volume per unit time) through the wall of the entire capillary using the average pressure.

Figure 5.93: Vectors representing pressure in and out of capillary
4. Medical Case Study: Testing for Kidney Disease16
Patients with kidney disease often have protein in their urine. While small amounts of protein are not very worrisome, more than 1 gram of protein excreted in 24 hours warrants active treatment. The most accurate method for measuring urine protein is to have the patient collect all his or her urine in a container for a full 24-hour period. The total mass of protein can then be found by measuring the volume and protein concentration of the urine.
However, this process is not as straightforward as it sounds. Since the urine is collected intermittently throughout the 24-hour period, the first urine voided sits in the container longer than the last urine voided. During this time, the proteins slowly fall to the bottom of the container. Thus, at the end of a 24-hour collection period, there is a higher concentration of protein on the bottom of the container than at the top.
One could try to mix the urine so that the protein concentration is more uniform, but this forms bubbles that trap the protein, leading to an underestimate of the total amount excreted. A better way to determine the total protein is to measure the concentration at the top and at the bottom, and then calculate the average protein concentration.
Suppose a patient voids 2 litres (2000 ml) of urine in 24 hours and collects it in a cylindrical container of diameter 10 cm (note that 1 cm3 = 1 ml). A technician determines that the protein concentration at the top is 0.14 mg/ml, and at the bottom is 0.96 mg/ml. Assume that the concentration of protein varies linearly from the top to the bottom.
(a) Find a formula for c, the protein concentration in mg/ml, as a function of y, the distance in centimeters from the base of the cylinder.
(b) Write an integral that gives the average protein concentration in the urine sample.
(c) Estimate the quantity of protein in the sample by multiplying the average protein concentration by the volume of the urine collected. Does this patient require active treatment?
FOCUS ON THEORY
THEOREMS ABOUT DEFINITE INTEGRALS
The Second Fundamental Theorem of Calculus
The Fundamental Theorem of Calculus tells us that if we have a function F whose derivative is a continuous function f, then the definite integral of f is given by
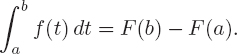
We now take a different point of view. If a is fixed and the upper limit is x, then the value of the integral is a function of x. We define a new function G on the interval by

To visualize G, suppose that f is positive and x > a. Then G(x) is the area under the graph of f in Figure 5.94. If f is continuous on an interval containing a, then it can be shown that G is defined for all x on that interval.
We now consider the derivative of G. Using the definition of the derivative,
![]()
Suppose f and h are positive. Then we can visualize

and

as areas, which leads to representing

as a difference of two areas.

Figure 5.94: Representing G(x) as an area

Figure 5.95: G(x + h) − G(x) is the area of a roughly rectangular region
From Figure 5.95, we see that, if h is small, G(x + h) − G(x) is roughly the area of a rectangle of height f(x) and width h (shaded darker in Figure 5.95), so we have
![]()
hence
![]()
The same result holds when h is negative, suggesting that
![]()
This result is another form of the Fundamental Theorem of Calculus. It is usually stated as follows:
Second Fundamental Theorem of Calculus
If f is a continuous function on an interval, and if a is any number in that interval, then the function G defined on the interval by

has derivative f; that is, G′(x) = f(x).
Properties of the Definite Integral
In this chapter, we have used the following properties to break up definite integrals.
Sums and Multiples of Definite Integrals
If a, b, and c are any numbers and f and g are continuous functions, then

In words:
- The integral from a to c plus the integral from c to b is the integral from a to b.
- The integral of the sum (or difference) of two functions is the sum (or difference) of their integrals.
- The integral of a constant times a function is that constant times the integral of the function.
These properties can best be visualized by thinking of the integrals as areas or as the limit of the sum of areas of rectangles.
Problems on the Second Fundamental Theorem of Calculus
For Problems 1–4, find G′(x).
1. ![]()
2. ![]()
3. ![]()
4. ![]()
5. ![]()
(a) What is F(0)?
(b) Does the value of F increase or decrease as b increases? (Assume b ≥ 0.)
(c) Estimate F(1), F(2), and F(3).
6. For x = 0, 0.5, 1.0, 1.5, and 2.0, make a table of values for ![]() .
.
7. Assume that F′(t) = sin t cos t and F(0) = 1. Find F(b) for b = 0, 0.5, 1, 1.5, 2, 2.5, and 3.
In Problems 8–11, find the integral, given that ![]() = 8,
= 8, ![]() , and
, and ![]() = 3.
= 3.
8. ![]()
9. ![]()
10. ![]()
11. ![]()
1http://www.indexmundi.com/energy.aspx, accessed May 2012.
2www.motortrend.com/, accessed May 2011.
3http://cdiac.ornl.gov/trends/emis/meth_reg.html, Accessed January 2013.
4Drug Treatment, Graeme S. Avery (Ed.) (Sydney: Adis Press, 1976).
5Drug Treatment, Graeme S. Avery (Ed.) (Sydney: Adis Press, 1976).
6http://www.eia.doe.gov/cneaf/coal/page/special/tbl1.html. Accessed May 2011.
7www.epa.gov/climatechange/science/indicators/ghg/us-ghg-emissions.html. Accessed January 2013.
8BP Statistical Review of World Energy 2009, http://www.bp.com/, accessed September 6, 2009).
9www.earth-policy.org/indicators/Temp/solar_power_2011. Accessed February 2013. A gigawatt measures power, the rate of energy generation. In this case, we are considering gigawatts of capacity manufactured per year.
10Based on www.itforus.oeiizk.waw.pl/tresc/activ//modules/bj.pdf. Accessed February 12, 2012.
11The 2009 OASDI Trustees Report, www.ssa.gov/OACT/TR/2009.
12“A catastrophic rupture hits region's water system,” The Boston Globe, May 2, 2010.
13Data from R. J. Beyers, The Pattern of Photosynthesis and Respiration in Laboratory Microsystems (Mem. 1st Ital. Idrobiol., 1965).
14Adapted from M. Collier, R. Webb, E. Andrews, “Experimental Flooding in Grand Canyon,” Scientific American (January 1997).
15From David E. Sloane, M.D.
16From David E. Sloane, M.D.