Chapter 7

Recurrent Neural Networks in Medical Data Analysis and Classifications

Haya Al-Askar1, Naeem Radi2,  and Áine MacDermott3     1Salman Bin Abdulaziz University, Department of Computer Science, Saudi Arabia, KSA     2Al Khawarizmi International College, Abu Dhabi, UAE     3Al Dar University College, Dubai, UAE
E-mail: [email protected], [email protected], [email protected]

Abstract

This chapter discusses dynamical neural network architectures for the classification of medical data. Various researches have indicated that recurrent neural networks such as the Elman network demonstrated significant improvements when used for pattern recognition in medical time-series data analysis and have obtained high accuracy in the classification of medical signals. The aim of this chapter is to provide a literature survey of various applications of dynamical neural networks in medical-related problems. Medical signals recorded in various applications contain noise that could result from measurement error or due to recording tools. Therefore, this chapter will discuss how data preprocessing can be used to extract the features and remove the noises. A case study using the Elman, Jordan, and Layer recurrent networks for the classification of uterine electrohysterography signals for the prediction of term and preterm delivery for pregnant women is also presented.

Keywords

Dynamic neural network; Elman; Medical data analysis; Uterine Electrohysterography signals; Electrohysterography; electromyography

Introduction

The development of medical information systems has played an important role in medical science. The aim of these developments is to improve the utilization of technology in medical applications [62]. Expert systems and different artificial intelligence methods and techniques have been used and developed to improve decision support tools for medical purposes. One of the most widely used classification tools for medical application is artificial neural networks (ANNs). ANNs have the ability to identify differences between groups of signals, which were utilized to identify different types of diseases and illnesses. This is related to their characteristics of self-learning, self-organization, nonlinearity, and parallel processing compared with linear traditional classifiers [43]. Feedforward neural networks suffer from some limitations when dealing with temporal pattern. Recurrent neural networks (RNNs) have advantages over feedforward neural networks, as they have the ability to discover the hidden structure of the medical time signal. Existing studies have indicated that RNNs have the ability to perform pattern recognition in medical time-series data and have obtained high accuracies in the classification of medical signals [35,57,68,69,71]. Additionally, it has been shown that RNNs have the ability to provide an insight into the feature used to represent biological signals [68]. Therefore, the employment of a dynamic tool to deal with time-series data classification is highly recommended [34]. This type of neural network has a memory that is capable of storing information from past behaviors [31]. One of the most important applications of RNNs is modeling or identifying temporal patterns, as Chung et al. have stated in their work [16]. They convey that “recurrent (artificial) neural network models are able to exhibit rich temporal dynamics, thus time becomes an essential factor in their operation.” Different studies have indicated that RNNs can be applied to nonlinear decision boundaries [28]. The main advantages of RNNs is their ability to deal with static and dynamical situations [42,47,69]. One of their powerful properties are finite state machine approximation, which makes RNNs learn both temporal and spatial patterns [23]. This type of network is very useful for real-time applications like biomedical signal recording and analysis.
In this chapter, applications of RNNs for medical data classification will be discussed. There is a strong body of evidence emerging that suggests the analysis of uterine electrical signals, from the abdominal surface (electrohysterography [EHG]), could provide a viable way of diagnosing true labor and even predict preterm deliveries. Hence, the performance of three types of RNN architecture, including the Elman, Jordan, and Layer, in classification of uterine EHG signals for the prediction of term and preterm delivery for pregnant women will be presented and discussed as a case study.

Medical Data Preprocessing

Most of the recorded signals that represent time series in different applications contain noise. These noises may be due to measurement error or temporary incident, or may be related to problems with the recording tools [33]. For example, the biomedical signal of a patient may be interrupted by the patient’s movements or breathing, or by the patient electrocardiogram (ECG) [15,33,44,61]. The signal characteristics are buried away in the noise [43]. Therefore, researchers need to filter these signals to remove or at least reduce these noises in order to measure the true propriety of the series [5]. The filter techniques play an important role in extracting the signal of interest and removing the unwanted effects of noise. The literature describes a number of filtering methods that have been designed, such as the band-pass filter, which allows specified frequencies to pass. For example, Balli et al. [6] have used a band-pass filter to remove high-frequency content and baseline noise on the ECG signals. It has been used on electronystagmography (EMG) signals to filter with different parameters [21,37,44,54,61,65] as well as electroencephalography (EEG) signals [3,54,68]. Each signal has its own optimal parameter to be used with the filter. For example, the most relevant information in EMG is contained in the range of 20–500 Hz [13,38], whereas heart rate effects can be eliminated at a low of 100 Hz. However, there are no perfect filters to remove unwanted artefacts [24]. Fele-Zorz et al. [22] showed that 0.3–3 Hz is the best range for classifying between preterm and term delivery. However, the frequency range of the motion noise is 1–10 Hz [15].
Some RNN models were designed in order to detect patterns in biological signals. In addition, some researches have proved that RNN is a very powerful tool for modeling EEG single [23]. Forney et al. [23] have shown that the Elman RNN (ERNN) is able to classify mental tasks. It has shown its ability to forecast the EEG signal. Their process was based on classification via forecasting (CVF). Each EEG signal is recorded from a person while he/she imagines mental tasks. ERNN has been trained to forecast the signals of each of these imagined mental tasks. The forecasting errors of ERNN are fed to the classifier as features; then the label of class is selected with the ERNN model that obtained the lowest forecasting error. This experiment has been performing very well and has achieved up to 93% classification accuracy. This is related to the dynamical link on the ERNN, which holds some of the temporal information from the EEG signal.
Furthermore, RNNs have been used to represent signals. Szkola et al. [66] applied RNNs to analyze speech signals in order to indicate the difference between healthy individuals and patients with larynx diseases. The proposed network was developed by combining the Elman and Jordan networks. The proposed network, called the Elman–Jordan network, aimed to improve the learning ability of the network. The features of patients’ speech signals are extracted by the average mean squared errors obtained by the RNNs using the original signal. The task utilizes speech signals of patients from the control group and those with two types of laryngopathies, namely Reinke edema (RE) and laryngeal polyp (LP). Their experiment involved asking patients to separately pronounce different Polish vowels. Their proposed network has shown some improvement on the learning ability of the neural network and time speed and can be utilized as an initial step to making decisions about normal and disease states [66].
Another application of Jordan network was presented by Silva et al. [63]. They used the Jordan network to reconstruct the missing data on medical time series signal. They used signal with a multivariate channel. The Jordan network was trained to predict the missing gap in order to recover the corrupted signal [63].
Another RNN-based approach was established in 1996 by Cheron et al. [14]. Their main objectives of using dynamic RNNs were to find the relationship between muscle EMG activity and arm kinematics. The neural network used in that study consisted of fully interconnected neurons, and their experiments show that this RNN is perfectly able to identify muscle activity EMG signals. It can identify the complex mapping between muscle activity EMG and upper-limb kinematics during complex movements. Additionally, Mougiakakou et al. [55] investigated the ability of RNNs using a real-time learning algorithm. They used an RNN to model the glucose–insulin level of children with type 1 diabetes, and their results proved that RNNs are able to predict the glucose level for children with type 1 diabetes.

Classification

The importance of classification techniques in the medical community, especially for diagnostic purposes, has gradually increased. The important reason for improving medical diagnosis is to enhance the human ability to find better treatments, and to help with the prognoses of diseases to make the diagnoses more efficient [1], even with rare conditions [46]. The classification task involves the following: each object in a data set is represented by a number of attributes or features, and each of these objects can be determined according to a number of classes to which it belongs. The features can be assembled into an input vector ximage. The classifier will be provided by a number of previous objects (training set), each involving vectors of feature values and the label of the correct class. The aim of the classifier is to learn how to extract useful information from the labeled data in order to classify unlabeled data. Various methods have been employed for the classification task. They are categorized into two groups: linear and nonlinear classifiers. The linear classifiers are represented as a linear function of input feature x.image

g(x)=wTx+b

image

where w is a set of weight values and b is a bias. For two classes, problems c1image and c2image, the input vector ximage is assigned to class c1image if g(x)>=0image and to class c2image otherwise. The decision boundary between class c1image and c2image is simply linear. In the previous studies, several traditional linear classifiers were designed and applied to perform classification in different areas such as linear discriminant analysis.
Nonlinear classifiers involve finding the class of a feature vector ximage using a nonlinear mapping function (f)image, where f is learnt from a training set Timage, from which the model builds the mapping in order to predict the right class of the new data. The most popular nonlinear classifier is the neural network. As a classifier, the ANN has a number of output units, one of each probable class. Nonlinear neural networks are able to create nonlinear decision boundaries between dissimilar classes in a nonparametric approach [13,31]. Chen et al. [13] asserted that neural networks have the power to determine the posterior probabilities, which can be used as the basis for establishing the classification rule.
ANN achievements have covered different types of medical applications such as the analysis of EEG signals [28]. Diab et al. [18] have used the ANN to classify uterine EMG signals for preterm deliveries and deliveries at term according to their frequency domain.

RNNs for Classification

Various medical applications based on RNNs have been developed over the last few years. One of the most prominent applications of RNNs is pattern recognition, such as automated diagnostic systems [69]. RNNs can utilize nonlinear decision boundaries and process memory of the state, which is crucial for the classification task [28,57,58]. A number of studies have confirmed that RNNs have the ability to distinguish linear and nonlinear relations in the signals. In addition, they have proven that RNNs possess signal recognition abilities [57]. Researchers are attempting to investigate the ability of RNNs to classify biological signals (e.g., EEG, ECG, and EMG). The procedure for signals classification is performed in two stages. The first step is extracting the features. These features will be used as an input to RNN classifier. This will be followed by the classifier techniques.
Currently, most research work is based on using RNNs for EEG signals classification. Koskela et al. [39] have been addressing the utilization of recurrent self-organizing map (RSOM) to EEG signals for epilepsy. It has been applied to detect the activity of epileptic neurons on EEG signals. The EEG sample was 200 Hz. The features been used in this experiment are spectral features and they were extracted with a 256 size window. The authors used wavelet transform to extract signals from each window, and 16 energy features from the wavelet domain have been computed for each window. The data is divided into training and testing sets; the training set contained 150,987 × 16 dimension vectors, and epileptic activity comprised 5430 patterns on the training set. The RSOM network has been run to classify the EEG signal as normal or epileptic activity. The results showed that RSOM achieved a better clustering result than a self-organizing map (SOM). The authors concluded that using context memory for detecting the EEG epileptic activity has enhanced the classification performance on SOM [39].
Another study was presented using the Elman network to classify the mental diseases on EEG signals combined with wavelet preprocessing. Petrosian et al. [57,58] investigated the ability of RNNs employed with wavelet preprocessing methods for diagnosis of epileptic seizures in EEG signals [58] and for the early detection of Alzheimer disease (AD) in EEG signals [57]. For diagnosis of epileptic seizures in EEG signals analysis, Petrosian et al. [58] examined the ability of RNNs combined with wavelet transformation methods to predict the onset of epileptic seizures. The signals were collected from EEG channel. The RNN was trained based on a decoupled extended Kalmen filter (DEKF) algorithm. In Alzheimer disease, for EEG signals detection task, the RNN has been used to distinguish between AD and healthy groups. In that study, the authors have used network training algorithm based on an extended Kalman filter (EKF). The signals were obtained from 10 healthy persons and 10 early AD patients. The EEG signals were recorded using 9 channels with 2 minutes length and with a 512 Hz sampling rate. EEG has been recorded to monitor the subject during the eyes closed resting state. The Fourier power spectra methods have been used to analyze the row EEG signals. The band-pass FIR filter has been used to screen each EEG signal into four subgroups (delta, theta, alpha, and beta). Furthermore, the fourth levels wavelets filter has been used on raw EEG signals. In the study, the inputs of the RNN were the original channel signals and the derived delta, theta, alpha, and beta for each signals as well as their wavelet-filtered subbands at levels 1–6. From their experiments, the best RNN result was achieved using parietal channel P3 raw signals as well as wavelet-decomposed subbands at level 4 as inputs. RNN achieved high performance in classifying AD, with 80% sensitivity and 100% specificity. Petrosian et al. [57] suggested that the combination of RNN and wavelet approach can analyze EEG signals for early AD detection.
Guler et al. [28] have also improved the diagnostic ability of the RNNs to detect EEG signals of epileptic seizures. The EEG signals that have been used in that experiment are recorded from five healthy volunteers with their eyes open, five epilepsy patients in the epileptogenic zone during seizure-free interval, and epilepsy patients during seizures. Lyapunov exponent methods have been applied to extract features, and 128 Lyapunov exponents’ features have been calculated for each EEG segment. Statistical steps were used to reduce the dimensionality of the features. This is normally done by computing the maximum, minimum, mean, and standard deviation of the Lyapunov exponents for each EEG signals. The results achieved in this study confirmed that RNNs are better able to classify EEG signals than MLPs. The classification accuracy percentages of the RNNs were approximately 97% for the healthy subjects, 96.88% for seizure-free epileptogenic zone subjects, and 96% for epileptic seizure subjects, whereas MLPs classify the healthy subjects, seizure-free epileptogenic zone subjects, and epileptic seizure subjects with 92%, 91%, and 90.63%, respectively.
Another study has attempted to evaluate the diagnostic accuracy of RNNs by utilizing eigenvector methods to extract features of EEG signals of epileptic seizures [68]. The EEG signals that have been used on that study were obtained using surface EEG electrodes. The signals were recorded from five healthy volunteers with eyes open and eyes closed and from epilepsy patients during seizure-free intervals as well as during seizures activity. Consequently, the data involve five groups, two being healthy and three with an epilepsy diagnosis. Each set contains 100 single-channel EEG signals of 23.6 period. The signals were filtered using band-pass filter with 0.53–40 Hz. This research used three eigenvector methods (Pisarenko, multiple signal classification [MUSIC], and minimum-norm) to calculate the power spectral density (PSD) of signals. Frequencies and power levels of signals have been obtained by these eigenvector methods. After extracting the features using the eigenvectors methods, the features selections are proposed by finding the logarithm of the PSD values of each eigenvectors methods. Then two types of neural networks have been used to classify the signals, the MLP and the ERNN. The result indicates that ERNN has succeeded in classifying EEG signals. RNN networks provided the best classification performance, with an accuracy of 98%. This network outperformed MLP, which had an accuracy of 92% [68]. From these experiments, it has been concluded that the margin between eigenvector methods and RNN approaches can be applied to discriminate between the other biomedical signals.
Another biomedical signal that has been used to investigate RNNs’ ability for classification is ECG signals. Ubeyli et al. [69] has also used RNNs to diagnose ECG signals of partial epileptic patients. The RNN has been applied to classify nonarrhythmic ECG waveforms as normal or partial epileptic. The ECG signals involve two types of beats, normal and partial epilepsy, and they were collected from the MIT-BIH Database created by the Massachusetts Institute of Technology [4]. The features were extracted by using wavelet coefficient and Lyapunov exponents. Also, in the ECG experiment, the authors have used statistical methods to reduce the dimensions of the extracted features. The trained ERNN obtained a high classification accuracy of 98% compared to MLP, which achieved 93%.
In addition, Ubeyli et al. [17] used ERNNs to distinguish the differences of beats on electrocardiogram (ECG) signals. An ECG signal involves four beats (normal beat, congestive heart failure beat, ventricular tachyarrhythmia beat, atrial fibrillation beat). The ECG signals contain 48 signals with 30 minutes length. The electrode was replaced on the subject’s chest. The band-pass filter has been used to digitize signals at 360 Hz. The features have been extracted using a nonlinear dynamic method, that is, Lyapunov exponents. The ERNN with Levenberg–Marquardt leaning algorithm has been applied in order to classify the ECG signals. The findings of that study have confirmed the ability of ERNN to classify ECG signals with 94.72% accuracy [17].
Another biomedical signal that was used to examine the RNN capacity for classification is EMG signals [2]. This study focused on the automated detection of Parkinson diseases (PD) by using RNNs to classify EMG signals. The ERNN has been used to classify healthy and PD states. The EMG signals are recorded from the extensor carpi radialis muscle during rest and activated motion. The resting motion signals are obtained from abnormal PD patients, and muscular contraction signals are obtained from healthy individuals. The signal’s duration was 30 minutes, with a sampling frequency of 100 Hz. In order to distinguish the EMG signals, the authors used the PSD features. The statistical measures such as mean and maximum PSD are computed as features. The results of their experiments show that ERNNs can classify EMG signals with 95% classification accuracy [2].
In addition, their study attempted to classify different types of conditions related to human muscles. For example, Ilbay et al. [35] used ERNNs for automated diagnoses of carpal tunnel syndrome (CTS). It has been applied on patients suffering from various CTS symptoms such as right, left, and bilateral CTS. In this experiment, the study collected EMG signals from 350 patients who suffer from CTS (left, right, and bilateral) symptoms and signs. Nerve conduction study (NCS) was applied by using surface electrode to record the EMG signals on both hands for each patient. NCS measures how fast electrical signals can be sent through nerves. Thus, they are able to diagnose CTS, and the results of this test are used to evaluate the degree of any nerve damage. During the NCS test, surface electrodes are located on the patient’s hand and wrist, and then electrical signals are created to stimulate the nerves in the wrist, forearm, and fingers. Sensory responses are collected from the index finger (median nerve) or little finger (ulnar nerve), with ring electrodes. The following features, which have been used as RNN inputs, were extracted from these signals: right median motor latency, left median motor latency, right median sensory latency, left median sensory latency. RNNs are trained with the Levenberg-Marquardt algorithm. The results from this research showed that RNNs obtain 94% classification accuracy, which is higher than MLPNN with 88%.
The RNN has also been used to classify the signals recorded from the Doppler system. For example, Ubeyli et al. [69] evaluated the diagnostic ability of the ERNN employing Lyapunov exponents trained with Levenberg–Marquardt algorithm to classify arterial disease. In this study, signals have been collected from Doppler ultrasound. The Doppler ultrasound method has been used to evaluate blood flow in both the central and peripheral circulation. The main motivation of that study is to obtain nonlinear dynamic features from the ophthalmic arterial (OA) and internal carotid arterial (ICA) Doppler ultrasound signals. Overall, 128 Lyapunov exponent features were calculated from each OA and ICA Doppler signals segment (256 discrete data). However, these features have been reduced using statistical methods to represent signals for classification. The trained ERNN in this feature obtained high classification accuracy, with 97% for OA Doppler signals and ICA Doppler signals.

Table 7.1

Application of RNN in Classification

Paper AuthorsSignalNeural Network NameFeatures
Koskela et al. [39]EEG for epilepticRSOM16 energy features from the wavelet domain
Petrosian et al. [58]EEG of epileptic seizuresElmanThe wavelet transformation methods
Petrosian et al. [57]EEG of AlzheimerElamnDelta, theta, alpha, and beta for each signals as well as a wavelet transformation method
Guler et al. [28]EEGElman128 Lyapunov exponents features
Ubeyli [68]EEGElmanused three eigenvector methods (Pisarenko, multiple signal classification [MUSIC], and minimum-norm) to calculate the power spectral density (PSD)
Ubeyli [17]ECGElmanLyapunov exponent features
Arvind et al. [2]EMGElmanThe power spectral densities features
Ilbay et al. [35]EMGElmanRight median motor latency, left median motor latency, right median sensory latency, left median sensory latency
Ubeyli et al. [69]Doppler systemElman128 Lyapunov exponent features
Kumar et al. [40]EEGElmanWavelet, sample, and spectral entropy features

image

Kumar et al. [40] used an ERNN for epileptic diagnosis. They extract three features from EEG signals, including wavelet, sample, and spectral entropy features. Their results demonstrated that RNNs achieved high accuracy, with 99.75% to classify normal and epileptic seizures. Table 7.1 summarizes the various RNN architectures and their applications.

Introduction to Preterm

One of the most challenging tasks currently facing the healthcare community is the identification of premature labor [49]. Premature birth occurs when the baby is born before 37 weeks of pregnancy. A term birth occurs when the baby is born after the 37-week gestation period. The number of preterm births is increasing gradually; it badly affects healthcare development. The increase in preterm labor contributes to rising morbidity. It has been recorded that, in 2011, the percentage of babies born as preterm was 7.1% in England and Wales, according to the Office for National Statistics (2013). Approximately 50% of all perinatal deaths are caused by preterm delivery [7], with those surviving often suffers from health problem caused during birth.
Preterm birth has a great impact on new babies’ lives, including health problems or increased risk of death. One million preterm babies die each year according to the World Health Organization (WHO). An earlier delivery has a significantly negative impact on babies’ later lives. Preterm infants are usually born at low weights of less than 2500 grams compared with full-term babies [25]. In their future lives, they might suffer from more neurologic, mental, and behavioral problems compared with full-term infants [49]. In other cases, preterm birth leads to increased probability of asthma, hearing, and vision problems; some preterm infants may have difficulty with fine-motor and hand–eye coordination [72]. An early delivery affects the development of the kidneys and their function in later life [70]. Furthermore, 40% of survivors of extreme preterm births may be affected by chronic lung disease [29].
On the other hand, preterm births also have a negative effect on families, the economy, and community [24,30]. According to the WHO, more than three-quarters of premature babies can only be saved with very high-level effective care, which results in more infant hospitalizations and a lot of health care expenditure. Preterm infant needs intensive care, which will raise the cost of hospital care to around $1500 a day [25]. Furthermore, the reduced gestation duration increases the number of days spent in hospital. As a result, preterm births have a negative economic effect [64]. According to Mangham et al. [51], in 2009, in England and Wales the total cost to the public sector of preterm births was valued at £2.95 billion. However, attempting to have a better understanding of preterm deliveries can help to create the right decision and adopt prevention strategies to reduce the negative effects of preterm deliveries on infants, families, societies, and healthcare services [23,36,52].
Significant progress has been made in understanding the process of labor, and research on premature labor has attempted to discover the risk factors [13,22]. A number of researchers have found many factors leading to preterm delivery. According to Baker and Kenny [7], approximately one-third of preterm deliveries occurred because of membranes rupturing prior to labor. Another third might happen due to increasing spontaneous contractions (termed preterm labor [PTL]) [24,29]. Lastly, preterm birth can occur because of medical indication toward the best interests of the mother or baby. There are still doubts about which of these factors can increase the risk of preterm birth. However, there are some reasons preterm labor ultimately may or may not end in preterm birth [7]. These reasons may relate to the mother’s illnesses, congenital defects of the uterus, and cervical weakness [26,59].
Other factors of preterm labor could be related to health and lifestyle of the mothers; these factors include uterine abnormalities, short cervix, recurrent antepartum hemorrhage, illnesses and infections, any surgery, underweight or obese mother, diabetes, stress, smoking, social deprivation, long working hours/late nights, alcohol and drug use, and folic acid deficiency. In some situations, the cause of preterm delivery is undetectable [18].

Electrohysterogram

It has been recorded that electrical activity of the uterus muscle has been known for a long time, since at least the late 1930s [8]. However, it is only in the last 20 years that formal techniques have been available to record these activities [12]. The activity is recorded as signals. The method that has been used to record such signals in a time domain is called electrohysterography (EHG). EHG is a technique for measuring electrical activity of the uterus muscle during pregnancy, through uterine contractions [25,50]. EHG is a form of electromyography (EMG), the measurement of activity in muscular tissue.
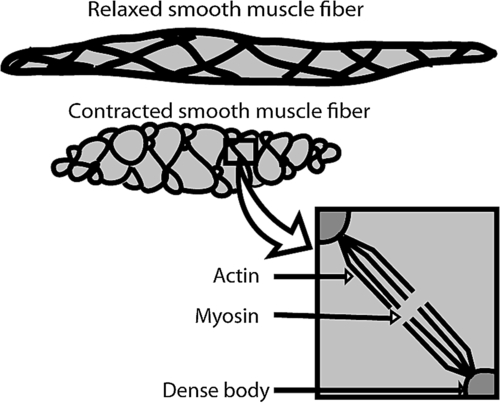
The uterine muscle is like skeletal muscles. In smooth muscles, as Rabotti et al. [60] asserted, the way the contraction occurs is by the process of propagation of electrical activity over the muscle cells in the appearance of an action potential. The spreading of electrical activity in the action potential through the myometrium cells causes uterine contractions. Therefore, EHG is the measurement of the action potential propagating through the myometrial cells. Figure 7.1 represents the contraction that happens on muscle. The woman’s body will slightly increase the number of electrical connections (gap junctions) between uterine cells [24].
From a medical point of view, the strengthening and increasing of uterine contractions over time is a sign of imminent labor and birth [73] and shoots up particularly in the last four days before delivery [45]. During parturition, the increasing of the contractions will help the body to prepare for the final stage of labor and parturition [12,24]. They will help to shorten the cervix and force the fetus to descend into the birth canal. Therefore, the main function of uterine contractions is to generate the force and synchronicity that are necessary for true labor.
image
Figure 7.1 Schematic Representation of Smooth Cell Contraction.
Over the last few decades, EMG has been used in two ways: the older method is an invasive one involving the insertion of needle electrodes into the uterus; however, this method is painful and uncomfortable for patients. Hence, it is unwanted. The second method is a noninvasive one that places electrodes on the woman’s abdominal surface. Many experiments have used noninvasive EHG signals in order to study the pregnancy process and predict labor in both humans [22,49] and animals [26,59].
EHG signals have been recorded by placing bipolar electrodes on the abdominal surface. These electrodes are spaced out at a horizontal, or vertical, distance of 2.5–7 cm. The numbers of electrodes that have been used for recording EHG have been chosen differently in various studies. One study used 2 [19] whereas a few other studies used 4 electrodes [12,22,24]. Other studies used 16 electrodes to obtain EHG signals [18,53,54], and a high-density grid of 64 small electrodes was used in Rabonetti et al. [61].
The results of these different studies have confirmed that EHG records are different from woman to woman, depending if she is in true or false labor and whether she will deliver term or preterm [32]. Therefore, EHG can be used to predict and diagnose preterm birth [10]. In the literature, a number of research studies have confirmed the importance of EHG recordings in analyzing uterine contraction during pregnancy and parturition [9,48,60]. Analysis of the EHG provides a strong basis for understanding and identifying the progress of labor [20,22,27,49]. Furthermore, Gondry et al. [27] recognized uterine contractions from EHG records as early as 19 weeks of the pregnancy period.

Uterine EHG Signal Processing

In the field of biomedical science, the analysis of EHG signals with powerful and advanced methodologies is becoming necessary. EHG is a technique for measuring electrical activity of the uterus muscle during pregnancy, through uterine contractions [25,50]. EMG is considered to be a helpful and effective method to detect preterm labor. EHG is a very sufficient measurement for recording electrical activity because it measures the contraction directly, rather than the physical response of contractions, which may get lost among other physical noise and disturbance [41]. In this section, the ability of RNNs to forecast EHG signals will be investigated. The analysis and characterization of uterine EHG signals is very challenging, which is related to their low signal-to-noise ratio (SNR) [67]. The ability of RNNs to forecast EHG signals can be used for preprocessing EHG signals. The signal preprocessing aims to improve the SNR [11]. The main objective of this experiment is to explore the possibility of applying RNNs as a filtering method to increase uterine EHG SNR value.
The data used in this research were recorded at the Department of Obstetrics and Gynaecology, Medical Centre, Ljubljana, between 1997 and 2006 [56]. In the TPEHG database, there are 300 patient records. These records are freely available, via the TPEHG data set, in the Physionet website [56]. The signals in this study were already collected by Fele-Žorž et al. [22]. Each record was collected by regular examinations at the 22nd week of gestation or around the 32nd week of gestation. The signal in records was 30 minutes long, had a sampling frequency (fs) of 20 Hz, and had a 16-bit resolution over a range of ±2.5 mV.
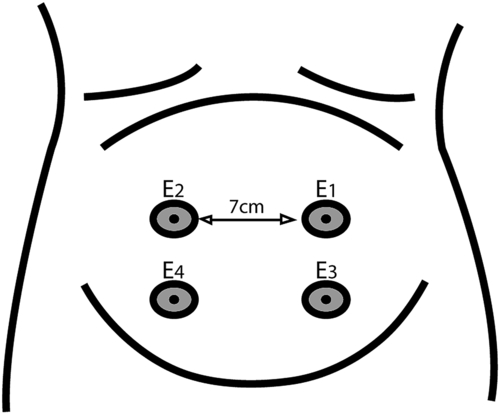
Prior to sampling, the signals were sent through an analog three-pole Butterworth filter, in the range of 1 to 5Hz. Figure 7.2 shows four electrodes placed on the abdominal surface, with the navel at the symmetrical center. The black circles represent the electrodes. Each record is obtained from three channels: channel 1, channel 2, and channel 3. Channel 1 signal was measured between E2 and E1, channel 2 was recorded between E2 and E3, and channel 3 signal was recorded between E4 and E3.
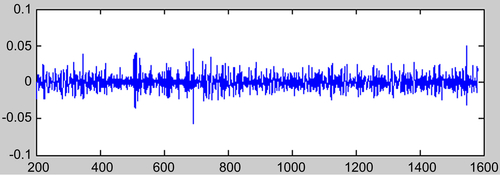
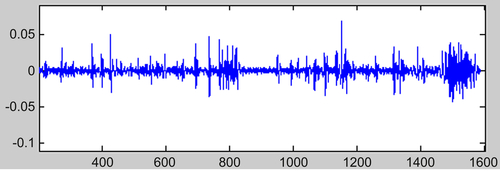
The recording time shows the gestational age. Each recording was classified as a full-term or preterm delivery, after birth. Figures 7.3 and 7.4 show two examples of EHG signals taken from different records. The recordings were categorized as four types as follows:
• Early term: recordings made early, signed as a term delivery
• Early preterm: recordings made early, signed as a preterm delivery
• Late term: recordings made late, signed as a term delivery
• Late preterm: recordings made late, signed as a preterm delivery
Two experiments have taken place on 76 EHG signals with 38 preterm and 38 term values. The model was trained over channel 3 following the recommendation of Fele-Žorž et al. [22]. The first experiment used RNNs to model EHG signals before filtering, whereas the second experiment modeled the EMG signals with RNNs after using a band-pass filter configured between 0.3 and 4 Hz.
image
Figure 7.2 Placement of Electrodes on the Mother’s Abdomen.
image
Figure 7.3 Row Data Plot for the Uterine EHG Signals, Term Subject.
image
Figure 7.4 Row Data Plot for the uterine EHG signals, Preterm subject.

Modeling RNN for Forecasting

In this section, the steps that have been used to build the RNNs to model EHG signals are presented. The maximization of the quality of uterine EHG signal produced by RNNs can be achieved by evaluating the SNR. These measurements have been designed to hold the highest amount of information from EHG signal as possible and the smallest amount of noise.
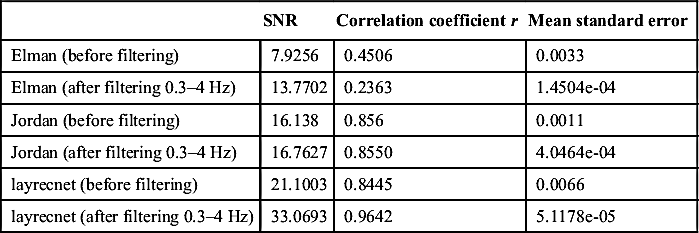
An experiment was undertaken to examine the performance of the network. The performance was evaluated using the mean squared error (MSE) and SNR. Table 7.2 shows the average results for the mean squared error, correlation coefficient (r), and signal-noise-ratio (SNR) using 76 uterine EHG signals. The best forecasting performance is measured by the SNR, which is a key measure of predictability, with higher values for SNR indicating better predictability. Table 7.2 shows the performance comparison of different types of RNNs for EHG noise reduction. These different RNN models were used to reduce the noises in the uterine EHG signals.

Table 7.2

Comparison of Different Types of RNNs

SNRCorrelation coefficient rMean standard error
Elman (before filtering)7.92560.45060.0033
Elman (after filtering 0.3–4 Hz)13.77020.23631.4504e-04
Jordan (before filtering)16.1380.8560.0011
Jordan (after filtering 0.3–4 Hz)16.76270.85504.0464e-04
layrecnet (before filtering)21.10030.84450.0066
layrecnet (after filtering 0.3–4 Hz)33.06930.96425.1178e-05

image

Among these models, it compared Elman, Jordan network, and Layer RNNs, with each layer having a recurrent connection with a tap delay associated with it (layrecnet). The results show that RNNs are able to model the nonlinear relation on the EHG signals. The layrecnet model provides the highest SNR measurement. Furthermore, the MSE and correlation coefficient values on this result indicated that layrecnet neural network is a better predictor than other RNNs. Therefore, layrecnet is considered the best model among the benchmark RNNs to remove noise from EHG signals.
In this experiment, the ability of using RNN architectures to forecast EHG signals to obtain high SNR has been presented. In the experiments, the results demonstrated that RNNs are capable of filtering the uterine EHG signals, achieving very high SNRs. In order to assess the performance of the various neural networks for processing EHG signals, the MSE and the correlation coefficient (r) have also been calculated. The results demonstrated that recurrent models are able to capture the temporal behavior of the signals.

Conclusion

This chapter has introduced different applications of RNNs for the purpose of analyzing medical time series. Previous studies have demonstrated that RNNs had considerable achievement in discriminating biological signals. Some of these studies had compared the RNN result with MLP’s, and their results confirmed that RNNs obtained higher classification accuracies than MLPs. RNNs have a better ability to analyze and classify different types of biomedical signals. This chapter has also presented the application of RNNS for filtering EHG signals, which is one of the diagnostic approaches for detecting labor. Various RNNs are applied for the prediction of EHG and filtering. Results showed that the RNNs can successfully filter EHG signals with high SNR.

References

[1] Akay M.F. Support vector machines combined with feature selection for breast cancer diagnosis. Expert Syst Appl. 2009;36(2):3240–3247.

[2] Arvind R, Karthik B, Sriraam N, Kannan J.K. Automated Detection of PD Resting Tremor Using PSD with Recurrent Neural Network Classifier. In: International Conference on Advances in Recent Technologies in Communication and Computing. 2010:414–417.

[3] Akrami A, Solhjoo S, Nasrabad A. EEG-Based Mental Task Classification: Linear and Nonlinear Classification of Movement Imagery. In: Engineering in Medicine and Biology 27th Annual Conference. Shanghai, China. 2005:4626–4629.

[4] Al-Aweel I.C, Krishnamurthy K.B, Hausdorff J.M, Mietus J.E, Ives J.R, Blum A.S, et al. Postictal heart rate oscillations in partial epilepsy. Neurology. 1999;53(7).

[5] Baghamoradi S, Naji M, Aryadoost H. Evaluation of cepstral analysis of EHG signals to prediction of preterm labor. In: 18th Iranian Conference on Biomedical Engineering. Tehran, Iran. 2011:1–3.

[6] Balli T, Palaniappan R. Classification of biological signals using linear and nonlinear features. Physiol Meas. 2010;31(7):903–920. Available at: http://www.ncbi.nlm.nih.gov/pubmed/20505216 (accessed November 20, 2013).

[7] Baker P.N, Kenny L. Obstetrics by Ten Teachers. 19th ed. London: Hodder Arnold; 2011.

[8] Bozler E. Electrical Stimulation and Conduction in Smooth Muscle. Am J Physiol. 1938;122(3):614–623.

[9] Buhimschi C, Garfield R.E. Uterine contractility as assessed by abdominal surface recording of electromyographic activity in rats during pregnancy. Am J Obstet Gynecol. 1996;174(2):744–753.

[10] Chen H-Y, Chuang C-H, Yang Y-J, Wu T-P. Exploring the risk factors of preterm birth using data mining. Expert Syst Appl. 2011;38(5):5384–5387. Available at: http://linkinghub.elsevier.com/retrieve/pii/S0957417410011619 (accessed December 23, 2012).

[11] Chendeb M, Khalil M, Hewson D, Duchêne J. Classification of non stationary signals using multiscale decomposition. J Biomed Sci Eng. 2010;3(2):193–199.

[12] Cheung P. Evaluating the Effect of Data Preprocessing on the Prediction of Preterm Deliveries from EHG using Machine Learning Algorithms (MSc thesis). Liverpool, UK: John Moores Univ.; 2012.

[13] Chen X, Zhu X, Zhang D. A discriminant bispectrum feature for surface electromyogram signal classification. Med Eng Phys. 2010;32(2):126–135. Available at: http://www.ncbi.nlm.nih.gov/pubmed/19955011 (accessed November 4, 2013).

[14] Cheron G, Draye J-P, Bourgeios M, Libert G. A Dynamic Neural Network Identification of Electromyograph and Arm Trajectory Relationship during Complex Movements. IEEE Trans Biomed Eng. 1996;43(5):552–558.

[15] Chowdhury R.H, Reaz M.B.I, Ali M, Bakar A, Chellappan K, Chang T.G. Surface electromyography signal processing and classification techniques. Sensors (Basel, Switzerland). 2013;13(9):12431–12466. Available at: http://www.ncbi.nlm.nih.gov/pubmed/24048337 (accessed October 31, 2013).

[16] Chung J.R, Kwon J, Choe Y. Evolution of recollection and prediction in neural networks. In: 2009 International Joint Conference on Neural Networks. 2009:571–577.

[17] Derya Übeyli E. Recurrent neural networks employing Lyapunov exponents for analysis of ECG signals. Expert Syst Appl. 2010;37(2):1192–1199.

[18] Diab M.O, El-Merhie A, El-Halabi L.K.N. Classification of uterine EMG signals using supervised classification method. J Biomed Sci Eng. 2010;3(9):837–842. Available at: http://www.scirp.org/journal/PaperDownload.aspx?DOI=10.4236/jbise.2010.39113 (accessed April 2, 2013).

[19] Doret M. Uterine Electromyograpy Characteristics for early Diagnosis of Mifepristone-induced Preterm Labour. Obstet Gynecol. 2005;105(4):822–830.

[20] Devedeux D, Marque C, Mansour S, Germain G, Duchene J. Uterine electromyography: a critical reviewe. Am J Obstet Gynecol. 1993;169(6):1636–1653.

[21] Eswaran H, Wilson J.D, Murphy P, Preissl H, Lowery C.L. Application of wavelet transform to uterine electromyographic signals recorded using abdominal surface electrodes. J Matern-Fetal Neonat Me. 2002;11(3):158–166. Available at: http://www.ncbi.nlm.nih.gov/pubmed/12380670 (accessed 5th August 2013).

[22] Fele-Žorž G, Kavšek G, Novak-Antolič Z, Jager F. A comparison of various linear and non-linear signal processing techniques to separate uterine EMG records of term and pre-term delivery groups. Med Biol Eng Comput. 2008;46(9):911–922.

[23] Forney E.M, Anderson C.W. Classification of EEG during imagined mental tasks by forecasting with Elman Recurrent Neural Networks. In: The 2011 International Joint Conference on Neural Networks. 2011:2749–2755.

[24] Fergus P, Cheung P, Hussain A, Al-Jumeily D, Dobbins C, Iram S. Prediction of Preterm Deliveries from EHG Signals Using Machine Learning. PLoS One. 2013;8(10):e77154.

[25] Garfield R.E, Maner W.L, MacKay L.B, Schlembach D, Saade G.R. Comparing uterine electromyography activity of antepartum patients versus term labor patients. Am J Obstet Gynecol. 2005;193(1):23–29.

[26] Goldenberg R.L, Culhane J.F, Iams J.D, Romero R. Epidemiology and causes of preterm birth. Lancet. 2008;371(9606):75–84.

[27] Gondry J, Marque C, Duchene J. Electrohysterography during pregnancy: preliminary report. Biomed Instrum Technol. 1993;27(4):318–324.

[28] Guler N, Ubeyli E, Guler I. Recurrent neural networks employing Lyapunov exponents for EEG signals classification. Expert Syst Appl. 2005;29(3):506–514.

[29] Greenough A. Long term respiratory outcomes of very premature birth (<32 weeks). Semin Fetal Neonatal Med. 2012;17(2):73–76.

[30] Garfield R.E, Maner W.L. Uterine Electromyography in Humans – Contractions, Labor, and Delivery. In: Jarm T, Kramar P, Zupanic A, eds. 11th Mediterranean Conference on Medical and Biomedical Engineering and Computing. Heidelberg, Berlin: Springer; 2007:128–130.

[31] Haykin S. Neural Networks: A comprehensive Foundation. Upper Saddle River, NJ: Prentice Hall PTR; 1998.

[32] Hassan M, Terrien J, Alexandersson A, Marque C, Karlsson B. Nonlinearity of EHG signals used to distinguish active labor from normal pregnancy contractions. In: 32nd Annual International Conference of the IEEE EMBS. 2010:2387–2390.

[33] Herrera J.L. Time Series Prediction Using Inductive Reasoning Techniques Instituto de Organizacion y Control de Sistemas Industriales. 1999.

[34] Hüsken M, Stagge P. Recurrent neural networks for time series classification. Neurocomputing. 2003;50(C):223–235.

[35] Ilbay K, Übeyli E.D, Ilbay G, Budak F. A New Application of Recurrent Neural Networks for EMG-Based Diagnosis of Carpal Tunnel Syndrome. In: Cardot H, ed. Recurrent Neural Network for Temporal Data Processing. Croatia: InTech; 2011.

[36] Iams J.D. Prediction and early detection of preterm labor. Obstet Gynecol. 2003;101(2):402–412. Available at: http://www.ncbi.nlm.nih.gov/pubmed/12576267 (accessed May 2013).

[37] Kavsek G, Pajntar M, Leskosek B. Electromyographic activity of the uterus above the placental implantation site. Gynecol Obstet Invest. 1999;48(2).

[38] Konrad P. The ABC of EMG: A Practical Introduction to Kinesiological Electromyography. Noraxon INC, USA, 1.0; 2005.

[39] Koskela T, Varsta M, Heikkonen J, Kaski K. Temporal Sequence Processing using Recurrent SOM. In: Proceedings of the Second International Conference Knowledge-Based Intelligent Electronic Systems. Adelaide, SA: IEEE; 1998:21–23 Retrieved from. http://ieeexplore.ieee.org/xpls/abs_all.jsp?arnumber=725861&tag=1.

[40] Kumar S.P, Sriraam N, Benakop P.G. Automated detection of epileptic seizures using wavelet entropy feature with recurrent neural network classifier. In: TENCON 2008-2008 IEEE Region 10 Conference. Hyderabad: IEEE; 2008:1–5.

[41] Leman H, Marque C, Gondry J. Use of the electrohysterogram signal for characterization of contractions during pregnancy. IEEE Trans Biomed Eng. 1999;46(10):1222–1229.

[42] Ling S.H, Leung F.H.F, Leung K.F, Lam H.K, Iu H.H.C. An Improved GA Based Modified Dynamic Neural Network for Cantonese-Digit Speech Recognition. In: Grimm M, Korschel K, eds. Robust Speech Recognition and Understanding. Vienna, Austria: I-Tech; 2007:460.

[43] Liu B, Wang M, Yu H, Yu L, Liu Z. Study of Feature Classification Methods in BCI Based on Neural Networks. In: Conference proceedings: … Annual International Conference of the IEEE Engineering in Medicine and Biology Society. IEEE Engineering in Medicine and Biology Society. Conference (Vol.3: 2932–5). China.

[44] La Rosa P.S, Nehorai A, Eswaran H, Lowery C.L, Preiss H. Detection of uterine MMG contractions using a multiple change-point estimator and K-means cluster algorithm. International Congress Series. 2007;1300:745–748. Available at: http://linkinghub.elsevier.com/retrieve/pii/S0531513107001094 (accessed January 15, 2013).

[45] Lucovnik M, Maner W.L, Chambliss L.R, Blumrick R, Balducci J, Novak-Antolic Z, Garfield R.E. Noninvasive uterine electromyography for prediction of preterm delivery. Am J Obstet Gynecol. 2011;204(3):228 e1-10.

[46] Machado L.O. No Title Medical Application Of Artificial Neural Networks: Connectionist Models of Survival. 1996, March.

[47] Makarov V.A, Song Y, Velarde M.G, Hübner D, Cruse H. Elements for a general memory structure: properties of recurrent neural networks used to form situation models. Biol Cybern. 2008;98(5):371–395.

[48] Marque C.K, Terrien J, Rihana S, Germai G. Preterm labour detection by use of a biophysical marker: the uterine electrical activity. BMC Pregnancy Childbirth. 2007;7(Suppl 1):S5. Available at: http://www.pubmedcentral.nih.gov/articlerender.fcgi?artid=1892062&tool=pmcentrez&rendertype=abstract (accessed January 15, 2013).

[49] Maner W.L, Garfield R.E, Maul H, Olson G, Saade G. Predicting term and preterm delivery with transabdominal uterine electromyography. Obstet Gynecol. 2003;101(6):1254–1260.

[50] Marshall J. Regulation of activity in uterine smooth muscle. Physiol Rev Suppl. 1962;5:213–217.

[51] Mangham L.J, Petrou S, Doyle L.W, Draper E.S, Marlow N. The Cost of Preterm Birth Throughout Childhood in England and Wales. Pediatrics. 2009;123:312–327.

[52] Muglia L.J, Katz M. The Enigma of Spontaneous Preterm Birth. N Engl J Med. 2010;362(6):529–535.

[53] Moslem B, Khalil M, Diab M, Chkeir A, Marque C. A Multisensor Data Fusion Approach for Improving the Classification Accuracy of Uterine EMG Signals. In: Electronics, Circuits and Systems (ICECS), 2011 18th IEEE International Conference on 11th-14th Dec. Beirut, Lebanon: IEEE; 2011:93–96.

[54] Moslem B, Khalil M, Diab M, Chkeir A, Marque C. Classification of multichannel uterine EMG signals by using a weighted majority voting decision fusion rule. 2012 16th IEEE Mediterranean Electrotechnical Conference. 2011:331–334. Available at: http://ieeexplore.ieee.org/lpdocs/epic03/wrapper.htm?arnumber=6196442 (accessed March 2013).

[55] Mougiakakou S.G, Prountzou A, Iliopoulou D, Nikita K.S, Vazeou A, Bartsocas C.S. Neural network based glucose - insulin metabolism models for children with Type 1 diabetes. In: Conference proceedings: Annual International Conference of the IEEE Engineering in Medicine and Biology Society. IEEE Engineering in Medicine and Biology Society; 2006:3545–3548 Conference, 1(Mm).

[56] Physionet.org. The Term-Preterm EHG Database (TPEHG DB). 2010 Retrieved from. http://www.physionet.org/pn6/tpehgdb/.

[57] Petrosian A.A, Prokhorov D.V, Schiffer R.B, Petrosian A.A. Recurrent Neural Network based Approach for Early Recognition of Alzheimer's Disease in EEG. Recurrent Neural Network based Approach for Early Recognition of Alzheimer's Disease in EEG. Clin Neurophysiol. 2001;112(8):1378–1387.

[58] Petrosian A, Prokhorov D.V, Homan R, Dashei R, Ii D.W. Recurrent neural network based prediction of epileptic seizures in intra- and extracranial EEG. Neurocomputing. 2000;30:201–218.

[59] Rattihalli R, Smith L, Field D. Prevention of preterm births: are we looking in the wrong place? Edition, Archives of disease in childhood. Fetal an dneonatal. 2012;97(3):160–161.

[60] Rabotti C, Mischi M, van Laar J, Oei G, Bergmans J. Estimation of internal uterine pressure by joint amplitude and frequency analysis of Electrohysterographic signals. Physiol Meas. 2008;29(7):829–841. Available at: http://www.ncbi.nlm.nih.gov/pubmed/18583724 (accessed January 13, 2014).

[61] Rabotti C. Characterization of uterine activity by electrohysterography (PhD thesis). Technische Universteit Eindhoven; 2010.

[62] Shortliffe E.H, Perreault L.E, Fagan L.M, Wiederhold G. Medical Informatics: Computer Applications in Medicine. Reading: Addison-Wesley; 1990.

[63] Silva L.E.V, Duque J.J, Guzo M.G, Soares I, Tin R. Medical Multivariate Signal Reconstruction Using Recurrent Neural Network. In: Computing in Cardiology. Piscataway, NJ: IEEE; 2010:445–447.

[64] Shi S.Q, Maner W.L, Mackay L.B, Garfield R.E. Identification of Term and Pre-Term Labor in Rats using Artificial Neural Networks on Uterine EMG Signals. Am J Obstet Gynecol. 2008;198(2):1–10.

[65] Shaker M.M. EEG Waves Classifier using Wavelet Transform and Fourier Transform. Int J Biol Life Sci. 2005;1(2):85–90.

[66] Szkoła J, Pancerz K, Warchoł J. Recurrent neural networks in computer-based clinical decision support for laryngopathies: an experimental study. Computational Intell Neurosci 2011. 2011:289398.

[67] Terrien J, Marque C, Steingrimsdottir T, Karlsson B. Evaluation of adaptive filtering methods on a 16 electrode electrohysterogram recorded externally in labor. In: 11th Mediterranean Conference on Medical and Biomedical Engineering and Computing. Berlin: Springer; 2007:2–5.

[68] Übeyli E.D. Analysis of EEG signals by implementing eigenvector methods/recurrent neural networks. Digital Signal Proc. 2009;19(1):134–143.

[69] Übeyli E.D, Übeyli M. Case Studies for Applications of Elman Recurrent Neural Networks. In: Hu X, Balasubramaniam P, eds. Recurrent Neural Networks. Vienna, Austria: I-Tech; 2008:440.

[70] Van der Heijden A.J, Keijzer-Veen M.G. The Effect of Preterm Birth on Kidney Development and Kidney Function over Time. In: Morrison J.C, ed. Preterm Birth - Mother and Child. Vienna, Austria: InTech; 2012:341–356.

[71] Verplancke T, Van Looy S, Steurbaut K, Benoit D, De Turck F, De Moor G, et al. A novel time series analysis approach for prediction of dialysis in critically ill patients using echo-state networks. BMC Med Inform Decis Mak. 2010;10:4.

[72] WebMd. Premature Labor. 2012. Available at: http://www.webmd.com/baby/premature-labor.

[73] WelcomeBabyHome. The Birth Process. 2006. Available at: http://www.welcomebabyhome.com/pregnancy/pregnancy_birth_process.htm (accessed January 11, 2013).

..................Content has been hidden....................

You can't read the all page of ebook, please click here login for view all page.
Reset
3.12.76.164