Chapter 6: Modeling Provider Data
Cloud versus On-Premise Systems
EHR Implementation and Success Factors
Experiential Learning Activity: Electronic Health Records
Model Tab Enterprise Miner Node Descriptions
Experiential Learning Application: Hospital-Acquired Conditions
Experiential Learning Application: Immunizations
Chapter Summary
The purpose of this chapter is to develop data modeling skills using SAS Enterprise Miner, and with respect to the Model capabilities within the SEMMA process, this chapter builds on previous chapters with Sample, Explore, and Modify capabilities. This chapter continues modeling using logistic regression. This chapter also includes experiential learning application exercises on hospital acquired conditions and immunizations. The model focus of this chapter is shown in Figure 6.1.
Figure 6.1: Chapter Focus

Chapter Learning Goals
● Describe the Model process steps
● Understand provider-level data sources
● Develop data modeling skills
● Apply SAS Enterprise Miner model data functions
● Master the logistic regression model
Providers
Providers are considered the individuals (or professionals) that provide healthcare to patients. Provider facilities are generally broken down into inpatient and outpatient services. Typically, an overnight stay determines the difference between an inpatient and outpatient service. A patient might stay overnight in a hospital, emergency room, or other short-term care center. Providers that offer overnight stays are also called acute care facilities. If a patient has a surgery in a hospital but is discharged, and leaves a few hours later without an overnight stay, this is considered an outpatient service because there is no overnight stay. The number of hospitals has decreased since the 1970s due, in part, to improved surgical techniques and other medical improvements that no longer require overnight stays (Gartee, 2011).
When staying overnight in an inpatient facility, patients follow formal admission and discharge processes. A patient chart is created with information about the services conducted, along with physician, nurse, and medical professional review notes. Once the patient has received appropriate care, the patient is then discharged from the hospital with at-home or follow-up care instructions. Readmission is often tracked through a 30-day readmission frequency. The readmission metric tracks patients who are discharged and return within a 30-day period, possibly indicating that all the underlying causes were not treated. The number of days that a patient stays in the inpatient facility is considered the Length of Stay (LOS). The LOS often drives the cost of the stay and is used for billing purposes. A LOS is calculated from the Discharge Date – Admit Date. For 1-day stays, or, in cases where a patient is admitted and discharged within 24 hours, this counts as a 1-day LOS. If the LOS is less than 30 days. this is considered acute care. If the LOS is greater than 30 days, this is considered long-term care. If a patient requires a long-term stay, but instead of being cared for in a hospital setting, the patient might be transferred to a skilled nursing facility (Gartee, 2011).
Figure 6.2: Provider Settings

Provider Anamatics
Provider anamatics gives an opportunity to improve patient safety, and financial and operational performance for healthcare. The financial and operational analytics application area includes facilities, staffing, admissions, and reimbursements. The clinical and patient safety area includes evidence-based medicine, clinical decision support, safety, survival rates, and compliance. To date, many providers have focused on descriptive analytics through regulatory reporting and performance improvement program reporting. Predictive analytics have been used for determining admissions volumes and clinical interventions. A five-level pyramid has been proposed to explain provider analytic capability at different stages: 1) analytically impaired, 2) localized analytics, 3) analytical aspirations, 4) analytical companies and 5) analytical competitors. Most providers have achieved level-2 localized analytics. A few providers have achieved level-3 aspirational analytics including Kaiser Permanente, Mayo Clinic, and Cleveland Clinic. The successful achievement of level 3 is attributed to top management support, personnel skill sets, and analytical collaboration between localized groups. Initiatives, such as meaningful use for Electronic Medical Record (EMR) reimbursement and Accountable Care Organizations (ACOs), support the movement toward analytics along with regulatory reporting and compliance through the Centers for Medicare and Medicaid (CMS) and the Food and Drug Administration (FDA) (Davenport and Miller, 2014).
Provider Data
From our Chapter 2 review, common provider systems include Electronic Health Record (EHR), Computerized Physician Order Entry (CPOE), Telemedicine, and Pharmacy, with EHRs typically being the starting point for information technology adoption and storage for providers. EHR systems store all the patient history and medical information (such as diagnosis, procedures, and billing) that occurs from a clinical delivery standpoint, and replaces the paper-based processes that many providers have used in the past. EMRs contains medical and clinical data from a provider's office, whereas an EHR also contains data from a complete medical history for the patient. EHRs are accessible across all sites and healthcare providers (HealthIT.gov, 2016a). Given the healthcare market potential, there are a wide variety of EHR vendors available, in the order of hundreds a few years ago and now even over 1,100 EHR vendors to choose from (Shay, 2017). Within hospitals that participated in the Medicare EHR incentive program in 2016, there were 175 EHR vendors for 4,474 hospitals. The top five vendors by reported usage volume included Cerner, MEDITECH, Epic Systems Corporation, Evident, and McKesson (HealthIT.gov, 2016b). Within ambulatory primary care physicians, medical and surgical specialists, podiatrists, optometrists, dentists and chiropractors participating in the Medicare EHR program in 2016, there were 632 EHR vendors for 337,432 providers. The top five vendors by volume reporting include Epic Systems Corporation, Allscripts, eClinicalWorks, NextGen Healthcare, and GE Healthcare (HealthIT.gov, 2016b).
For provider systems, there are generally two types of software vendors to choose from: 1) open-source and 2) closed-source. These two types of vendors are common with software vendors across all industries including healthcare. Open-source systems are typically publicly accessible at no cost, and the underlying software source code can be viewed and customized. Examples of open-source EHRs include the Open Medical Record System (OpenMRS) and the Veterans Health Information Systems and Technology Architecture (VistA) in which the open-source code and free software was made available through the U.S. Freedom of Information Act (OpenMRS; Plone, 2017). Closed-source systems are typically purchased for a license fee, and the source code is prohibited from viewing. Customization can take place through approved methods such as application programming interfaces even though the base product cannot be customized directly. The majority of the top EHR systems in use by providers are closed-source including Cerner and MEDITECH.
EHR vendors can also be cloud-based or on-premise, similar to analytics platforms such as SAS OnDemand for Academics, which was discussed in Chapter 2. Cloud-based systems are accessible through a standard internet connection and web browser and do not require specialized hardware or software installation. Cloud-based systems also typically offer a fast set-up time since there is no on-site installation required. Cloud-based systems typically offer a pay-as-you go or pay-for-usage model on a monthly basis. On-premise systems are locally installed and typically have minimum hardware requirements for installing the software application, and, many times, a continuous internet connection is not required. Typically, for on-premise software installations, the number of users and usage requirements (such as storage space and processing power) are determined in advance on an annual basis. As a result of the demand and growth for cloud-based systems, many vendors are transitioning to offer the cloud-based capabilities over on-premise installations. Epic Systems, one of the largest EHR providers in the world, has been using a hybrid approach of both on-premise for existing customers and cloud-based software for new customers as the transition occurs. Cerner also offers a cloud-based solution as a result of the many community hospitals lacking the expertise of on-site programmers, administrators, and engineers required to run an on-premise system. The cloud-based systems are also sometimes referred to as remote-hosted or software as a service (SaaS) offerings even though they carry the same functionality (Sullivan, 2014). Highlighted as the number one cloud-based EHR in the U.S. by SK&A, Practice Fusion was originally developed solely as a cloud-based software platform. Although Practice Fusion is a closed source, the company previously offered the software free of charge, supported through advertisements, care coordination, and data analysis (Practice Fusion, 2017). The company has since transitioned to a monthly subscription-based model, following its $100 million acquisition by Allscripts (Monica, 2018).
To learn more about successful EHR systems, we will review two well-known EHR implementations, followed by the factors ensuring successful implementation of EHRs.
EHR Implementations
Mentioned as an open-source platform example, one of the most cited implementations of EHR is through the Department of Veteran’s Affairs (VA). The Veterans Health Information Systems and Technology Architecture (VistA) expands beyond electronic health records and includes electronic patient records, imaging, laboratory and computerized order entry, which has been developed over several decades. In one study, researchers estimated the costs against the benefits for the VA through the year 2007. The total costs (or investment) by the VA in VistA was estimated at $4.07 billion, with the total benefits estimated at $7.16 billion. The savings were achieved by eliminating redundancies, reducing usage, improving quality through reduction of errors, reduced work, and reduced cost of space. The findings showed a net resulting benefit of $3.09 billion to the VA even though this result took a large commitment and many years of effort from the 1990s through 2004 to achieve a full adoption, and to break-even with the investment and to begin to achieve net positive benefits as a result of VistA (Byrne et al., 2010).
Founded in 1945, Kaiser Permanente is the largest non-profit healthcare system in the U.S., covering approximately 12 million members with annual revenue of $73 billion. In addition, Kaiser contains approximately 40 hospitals, 700 medical offices, 22,000 physicians, 57,000 nurses, and 210,000 employees. Kaiser Permanente combines a health insurance plan, medical facilities, and physician groups to promote timely interventions and collaboration to improve healthcare. A key component of this initiative was the roll out of their Kaiser Permanente (KP) HealthConnect system, which includes an integrated EHR with online member access (McCarthy et. al, 2009; Kaiser Permanente, 2018). An example of a closed-source platform, Kaiser Permanente has been using information technology for several decades, and Kaiser Permanente’s usage of EHRs began in the 1990s. In 2003, Kaiser Permanente formally launched a $4 billion initiative and system called KP HealthConnect. The implementation was completed in 2008 and was the largest civilian implementation of EHRs in the U.S., to date. The underlying technology was purchased from Epic Systems Corp, and includes features such as laboratory, medication, imaging, Computerized Physician Oder Entry (CPOE), population health management, chronic condition management, decision support, preventative care, electronic referrals, reports, performance management, and patient billing features. Five key attributes in the healthcare delivery system were identified as requirements for the EHR (McCarthy et. al, 2009).
1. Information Continuity – the availability of information to all providers through the EHR. Kaiser Permanente has a web portal for online access to medical records, visits, appointments, prescriptions, lab results, and messaging. Medical staff is focused on patient sign-up to improve engagement to monitor their preventative care, schedule appointments, refill prescriptions, and communicate with their medical team. In the Hawaii region, patient visits decreased by 26%, and overall patient contacts decreased by 8%, facilitated by the EHR efficiency and online access.
2. Care Coordination / System Accountability – the coordinated care between all providers. Care teams track and improve preventative medicine as needs arise. Screenings improved over national levels. For example, breast cancer screening increased to as high as 86% for Medicare members and exceeded national averages of 67%, and cholesterol screening increased from 55% to 97%.
3. Peer Review and Teamwork – the teamwork of providers, nurses, and care personnel all support and review one another for high-quality output. Unblinded performance data is shared among the group. Internal transparency was further improved through information system tracking and physicians were eligible for a performance incentive up to 5% based on quality, patient satisfaction, workload, and team contributions.
4. Continuous innovation – the innovation and learning to continuously improve health delivery. An innovation center is used as a learning lab for simulation and evaluations of care. As part of continuous improvement, Kaiser Permanente has an in-house Permanente Journal, innovation awards, workshops, the Garfield Innovation Center. and a Care Management Institute to investigate and identify best practices for patient outcomes. In one application, development of an osteoporosis disease management program led to a 37% reduction of hip fractures. In a separate effort, the use of generic equivalent cholesterol medications led to annual cost savings of over $150 million.
5. Access to care – multiple entry points and providers are responsible and available for care. Patient modules allow translations to native languages along with a bilingual staff. KP HealthConnect entry points included 24-hour call centers and nurse lines, web-based appointment booking, urgent care after hours, phone appointment booking, and electronic messaging. In Northern California, the combination of efforts led to a 32% decrease in emergency department visits.
In the EHR implementation at Kaiser Permanente, a shared partnership and teamwork among managers, physicians, and employees was seen as a key to success. Sharing a corporate culture dedicated to quality care and continuous improvement was an important aspect of the overall success. Next, we will discuss in further detail additional success factors and implementation process for EHRs.
EHR Implementation and Success Factors
During the 1990s, information technology investment across most industries in the U.S. was eight times higher per worker than in the healthcare industry, and the healthcare sector contained numerous issues relating to costs, errors, and efficiency of care. To address these issues, a 2004 presidential executive order was established, calling for widespread and nationwide adoption of Electronic Health Records (EHRs) over the next decade. Barriers to implementation of EHRs include up-front costs and savings that benefit third-party payers. Globally, EHR adoption has been spurred by governmental subsidies to provider technology. Studies have shown the relationship between EHR adoption and provider size in which the adoption rate decreased as provider size in terms of full-time physicians decreased. The total cost of an EHR (which includes purchase of hardware, software, implementation, maintenance, training, customization and support for operational changes) remains high. Resources (such as insufficient capital, return on investment (ROI), data use concerns, consumer education, and costs) were listed as the top limiting factors and barriers to EHR adoption (Woodside, 2007a).
Providers currently assume the majority of the up-front cost and risk of EHR investment, and they often do not receive a full return on benefits, as a result of software licensing, clinical workflow changes, and ability to organize beyond a local area to achieve economies of scale. The costs and benefits factors can include practice size, specialty, geographic location, operational efficiency, affiliations, IT support, and market incentives. An agreed upon level of incentives is one that compensates the additional cost of obtaining data and is fair, equitable, attainable, and reviewed with increases. Incentives are intended to provide adoption momentum in the market. Past implementations have shown that physicians are often resistant to practice changes required by EHR. Given potential resistance, incremental approaches to adoption have been suggested. To encourage information technology adoption, some advocate for direct or indirect incentives. Examples of direct rewards include regional grants and contracts, low-rate loans, pay-for-use, and an EHR system in exchange for data used for third parties. Examples of indirect rewards are pay-for-performance. Regional grants and contracts would be used to promote EHR at local levels, with the hope of creating local and regional data exchanges. Some solutions intended to encourage adoption, such as pay for performance, do not apply universally and require localized incentives. Federal low-rate loans could also reduce the entry barrier for EHRs. Pay-for-use explores ways to provide reimbursement based on new codes and modifiers or through direct incentives. Pay-for-performance would provide incentives for those practices with the highest quality but not quantity, which is expected to be enhanced through EHR adoption. Once large providers adopt IT, smaller providers might follow. The idea is to move the adoption curve forward until the market is saturated and then to require remaining providers to implement EHRs. Larger practices or those with larger population centers have a higher percentage of adoption (Woodside, 2007).
Hospitals have now achieved near universal adoption of EHRs, representing a nine times increase in EHR adoption between 2008 and 2016 (Henry et al, 2016). Although adoptions rates for EHR systems have continued to increase for hospitals, full adoption still has not been achieved by physician practices. Providers of care are not adopting at as high a rate as a result of the cost-benefits, business process re-engineering, and potential legal barriers. A survey showed that those physicians without an EHR were more likely to work in a smaller, lower-income practice. Age also had an impact. For example, one physician planned to retire in a few years and decided to avoid an EHR implementation (Mazzolini, 2013) because a typical ROI cycle for an EHR required about three years. As further evidence of opposition, there is even an entire Twitter hashtag dedicated to opposing EHRs at #EHRbacklash (Twitter, 2018).
Increasingly, providers are being measured on quality, and that quality is tied to pay-for-performance or other programs that directly affect the payment to the provider. EHR systems make quality measures available for reporting and compliance requirements. The Veterans Health Administration showed improvements in employee-patient ratios and cost-per-patient decreases as compared with the U.S. consumer price index increase. Quality was improved through preventative screening measures and disease management. The Illinois Department of Healthcare identified a medical home model to improve chronic conditions. The model used electronic health records to link all members of the patient care team and added pay-for-performance incentives that were based on national measures. Further analysis showed that care following hospital discharge (in terms of follow-up physician visits, medication adherence, and ongoing testing) was not always provided. Post-discharge care was identified by the Illinois Department of Healthcare as an action item for quality improvement (Woodside, 2013b). It has been shown that quality and efficiency can improve through an EHR, which leads to reduced medical errors and usage. The potential creates an issue as to whether the market supports technology in terms of societal benefit. In an effort to further improve EHR adoption, the Meaningful Use program from 2011 through 2014 was developed by the Centers for Medicare and Medicaid Services (CMS) to encourage EHR adoption through incentives. The Meaningful Use program has completed payments of over $20 billion and 370,000 providers received incentives. By early 2017, 67% of all providers used an EHR. Total costs for EHRs vary though annual spending is estimated near $37 billion, with more than half of providers incurring costs over $100,000 annually for EHRs and identified EHRs as one of their greatest increases in IT spending. Despite the spending, nearly 70% of providers indicated their functionality of the EHR system was lacking (Shay, 2017).
EHR system implementations are no different from other information system implementation such as Enterprise Resource Planning (ERP) systems. These types of system implementations are prone to high failure rates due to the complexity and scope of changes and user resistance. Some estimates show that nearly 80% of IT projects fail in terms of meeting the goals of the original implementation: 1) implemented on time, 2) implemented on budget, 3) implemented with agreed features and functionality, 4) achieved quality outcomes, and 5) in the case of EHR achieved of Meaningful Use.
Some of the key success factors in any implementation include 1) collaborative culture, 2) customization, 3) project management, 4) resources, 5) top management support, 6) systems integration, and 7) training. Collaborative culture includes the teamwork aspect of implementation and the close cooperation between all department areas and business and technical teams, including top management, consultants, end users, and vendors in support of a common objective and set of goals. Communication should be started early in the form of multiple announcements and organizational newsletters, including email, meeting, and intranet announcements. Kick-off meetings with key personnel and staff resources should also take place, along with regularly recurring meetings and weekly communications to key stakeholders. Customization is the ability of an organization to adapt their business processes to fit within the existing EHR application. Many times, organizations try to adjust the software to match their business processes. However, this is often costly, time consuming, and prevents future upgrades and support. Some EHR platforms have more flexible architectures that support and allow customizations such as modifying field names to match an organization’s terminology.
Figure 6.3: Implementation Success Model

Implementation should follow a formal project management methodology. Many projects fail to adequately account for organizational requirements, resources, and funding that is necessary to support a successful implementation. Project Management includes coordinating, scheduling, scope, and monitoring activities and resources in line with the project objectives. Agile project methodologies allow the implementation to proceed iteratively, allowing improved deployment speed and continuous feedback. Resources can include financial, people, hardware, software, and time for project completion. Consultants are often required due to a knowledge gap and complexity of new systems. User involvement can occur through requirements gathering, implementation participation, and continued use after a go-live date. Dedicated department or area-based resources should be assigned for local subject-matter experts and knowledge diffusion. Top management provides the required resources in a direct or indirect manner through financing as well as the power and support. Top management is also responsible for setting a clear direction, overall project objectives, project guidance, representation, and establishing these throughout the organization. Sponsorship across the entire management team allows others in the organization to support the project through reducing political resistance and facilitating participation.
During most implementations, multiple-vendor solutions are required for purchase because a single vendor cannot provide a fully integrated solution. As an alternative, other companies choose a best-of-breed approach based on vendor offerings. Today, several vendors offer completely integrated solutions with equitable offerings across services. The use of a single vendor also improves delivery time through ease of installation and avoids integration issues that commonly arise when using multiple vendor solutions. Training end users is important toward gaining knowledge and appropriate use of the system. Training modules and materials should be developed before the initial go-live date, along with governance plans (such as best practices, content and technical standards, and policies and procedures for training purposes). In addition, proactive monitoring of training issues should be immediately addressed to avoid long-term paradigm creation in early stages. New users should be required to take established training, and existing users, on an annual basis, should be directed to training materials as questions arise (Woodside, 2011).
EHR Implementation Process
To assist with a successful EHR implementation, an EHR implementation process can follow six steps:
1. Assess Practice Readiness,
2. Plan Your Approach,
3. Select or Upgrade to a Certified EHR,
4. Conduct Training and Implement EHR,
5. Achieve Meaningful Use,
6. Continue Quality Improvement (HealthIT.gov, 2013b).
As you might note, in this textbook, there are a variety of process steps, including SEMMA, that are followed. These process steps allow repeatable formalized methodologies that are based on best practices to ensure successful results.
Figure 6.4: Implementation Steps
![]()
In the first process stage of Assess Practice, and Readiness, current practices should be reviewed
For example, are all processes organized, efficient, and documented? Are data collection processes established and documented? Is high-speed internet available, and are employees ready to adopt new technology? In addition, future state and goals should be reviewed. For example, what is the expected result for patients, providers, and staff? What are the specific goals that will be used to determine the success of the project.
In the second process stage of Plan Your Approach, the work environment should be reviewed and priorities should be set. In the planning phase, current processes should be documented, workflow should be mapped, process improvement should be reviewed, backup and disaster recovery plan should be developed, project plans should be developed, patient chart conversion and data migration should be planned, and privacy and security protocols should be developed.
In the third process stage of Select or Upgrade to a Certified EHR, vendor products should be evaluated according to the planning requirements. Pricing should be calculated, and account for hardware, software, maintenance, implementation, interfaces, and customizations. Roles and responsibilities should be defined, and the delivery of systems, integration capabilities, privacy and security, vendor reliability, vendor market share, and legal review should be conducted. Table 6.1 includes a set of common features that are typically included in a technical system (such as EHR or similar enterprise level systems), and that comprise the platform. These features are categorized within Functional Quality, Architectural Quality, and Vendor Quality (Woodside, 2013d). For a selection process, the features are identified and these features are ranked according to organizational need. Next, the software vendors are evaluated based on the set of features in order to offer an objective selection process. After the top two to three vendors are selected, contract negotiation occurs to add a cost value review to the features.
Table 6.1: Software Platform Features
|
Software Platform Category |
Software Platform Features |
|
Functional Quality (Functionality) |
Meaningful Use, Online Analytical Processing (OLAP), Data Mining, Predictive Analysis, Business Analysis, Statistical Analysis, Geospatial Analysis, Scorecard, Strategy Maps, Key Performance Indicators, Querying, Reporting, Multiple report output formats, Customization, Interface type, Ad Hoc programming languages, Ease of Use, Automation, Knowledge Management, Portal, Dashboard, Charting, Data Warehouse, Content Management, Search |
|
Architectural Quality (Reliability) |
Availability, Performance, Database standards, Communication standards, Security levels, Number of independent modules, Number of workstations, Vendor hosted, Compatibility, Source code availability, Operational system integration |
|
Vendor Quality |
Popularity / Reputation, Technical support, User training, Experience with vendor products, Business focus, References, Past experiences with vendor, Consulting, Licensing costs |
In the fourth process stage of Train and Implement, user training, practice implementation, and testing is completed. In this stage, the data or charts are migrated to the EHR system, policies and procedures including the privacy, security, and backup plans are developed and put in place. Communication to patients, providers, and staff is ongoing to ensure a successful implementation.
The fifth process stage of Meaningful Use occurs after implementation and is one of the key goals of the EHR. In this stage, the goals are to improve quality, safety, and efficiency, engage patients, improve care coordination, improve population health, and ensure privacy and security. The ultimate goal is providing a fully electronic environment that improves the outcomes of healthcare. Achievement of Meaningful Use is also an important component to receiving incentives.
In the sixth and final stage of Improve Quality, ongoing continuous quality improvements are happening. The stage includes further improvements to workflows, additional training, data capture, customizations, definitions of roles and responsibility, technology reliability, speed, upgrades. These are all done to ensure continued efficient operation and ongoing patient and staff satisfaction (HealthIT.gov, 2013).
Experiential Learning Activity: Electronic Health Records
|
EHR |
|||
|
Description: For our experiential learning activity, you will connect your knowledge of EHRs and the implementation process. ● Research and search the internet to find three different EHR vendors. ● List a set of three features or factors that you will use to evaluate the systems such as cost, quality, performance, and so on. In an earlier study, one of the top criteria (or factor) for selection was whether the EHR system achieved the criteria for Meaningful Use (Shay, 2017) ● Compare and provide a description of the three systems using the set of three factors above. ● Provide a recommendation for a vendor system for a small physician practice with 10 employees and provide a recommendation for a major hospital system with 30,000 employees.
|
|||
|
Vendor Comparison |
|||
|
Vendor Name |
Feature/Factor 1 |
Factor 2 |
Factor 3 |
|
1. |
|
|
|
|
2. |
|
|
|
|
3. |
|
|
|
|
Recommendation |
|||
|
Physician Practice and Hospital:
|
|||
Following EHR implementation, a wide variety of clinical data that is captured electronically can now be used for analysis. We’ll continue with our SEMMA modeling process using data available through EHR systems and review the logistic regression model.
SEMMA: Model
Logistic regression can be applied to a variety of areas with the healthcare setting. Logistic regression has been used in medical and biomedical research such as medical risk and treatment compliance. A global study used logistic regression to identify treatment failure for the infectious disease of tuberculosis. Researchers found that gender, age, weight, and nationality were among the significant factors that predicted successful treatment completion (Kalhori, 2010). A study in Taiwan reviewed predictors of health information usage between 2,741 internet users between ages of 20-65. Using a logistic regression analysis, the study found that higher educational level (odds ratio 3.6, p <0.01), living alone (odds ratio 1.77, p <0.05, exercise (odds ratio 2.41, p<0.01), living in a city (odds ratio 1.28, p<0.05), high perceived health (odds ratio 1.34, P<0.05), and use of Western medicine services (odds ratio 1.51, P<0.05) all had an impact in health information usage for male internet users. By contrast, for female internet users being married (odds ratio 1.68, p<0.01) and higher personal income (odds ratio 1.56, P,0.01) had an impact. Predictors similar for both groups included higher educational level, and exercise that led to an increase in the odds for use of online health information (Koo et al., 2016).
During the modeling process step, the data mining model is applied to the data. During the partitioning phase data is segmented into training and validation data sets. The training data set is used to fit the model, and the validation data set is used to validate the model on a new set of data to demonstrate the reliability of the model. Based on the results, the model can then be tuned to optimal performance.
There are many different models that can be selected during this step, and the decision to choose each model is based on earlier exploration of data and knowledge of each model. We will continue this chapter with the model of logistic regression.
Regression Node
The Regression node is used for the linear regression model and is associated with the Model tab in SAS Enterprise Miner. Logistic regression is a nonlinear extension of linear regression, where the input variables are interval (continuous) or nominal (categorical), and the target variable (also known as Y or dependent variable) is binary (such as 0/1 or No/Yes). In special cases, logistic regression can also be used for nominal target variables such as Yes/No/Maybe. In the case of a binary target variability, the regression can be interpreted as a probability. If the probability of belonging to a 0/1 class is above or below a certain threshold, commonly 0.5, then we predict the corresponding class. If the probability of belonging to class 1 is 0.7, we predict 1, and if the probability is 0.3, then we predict 0 (Klimberg and McCullough, 2013).
As a recap, linear regression is used for interval targets, whereas logistic regression is used for binary targets.
Linear Regression: Interval and Nominal Inputs ▶ Interval Target
Logistic Regression: Interval and Nominal Inputs ▶ Binary Target
Model Assumptions
Similar to linear regression, one model assumption about logistic regression is that the underlying data variables are uncorrelated. If the independent variables explain the same variability of Y, multicollinearity can occur, leading to interpretation difficulty. Multicollinearity is often difficult to detect initially, although it can be identified by review of pairwise plots of input variables and correlation. To address multicollinearity, we can add data, reduce the model by removing input variables, and finally conduct a principal component analysis, which will result in uncorrelated inputs (Latin, Carrol, and Green, 2003). Like linear regression, logistic regression can be affected by outlier values and can be corrected by methods such as deleted or imputed during the data exploration and cleaning process. Overfitting the model based on the training data can also occur. This can be addressed through choosing a simpler model that can be generalized for future applications and data sets. A check for overfitting the model can be run against a validation set of data. Also, if the error rate for the training data is significantly lower than the validation data, this might indicate a case of overfitting (Latin, Carrol, and Green, 2003).
Data Preparation
To ensure an adequate sample size, as a general rule of thumb, we might want to verify that we have at least 25 records for each input variable. If we have three inputs, we should have at least 75 records. The additional records also ensures that we’ll have a sufficient number of records in each sample after splitting our data set into training and validation samples. If splitting our data set into a 60% train and 40% validation sample, 25 records per predictor would give us 15 records for the train sample and 10 records for the validation sample.
Partitioning Requirements
For logistic regression, we partition our data into a training and validation data set. The model is formed based on our training data set and is then run through our validation data set or hold-out data set to confirm validity of the model. If the model performs well on the training data set but poorly on the validation data set, this can indicate that we have overfit the model. In other words, we tuned the model too well to the training data set, and now it no longer performs well on a new or general data set. In this case, we might want to remove variables to create a simpler, more general model.
Model Properties
Selection Model
The model selection can be chosen as a backward selection, forward selection, stepwise, or none. If none is chosen, all inputs are used for the model. If backward selection is chosen, all inputs are used, and it removes inputs until the stop criterion is met. If forward is selected, no inputs are used, and it adds inputs until the stop criterion is met. If stepwise is selected, the model is started with the forward selection, although inputs can be removed until the stop criterion is met.
Model Result Evaluation
To evaluate the results of our logistic regression model, we can use several items including p-values, errors, lift, misclassification, and odds ratio. For the differences between logistic regression and linear regression, logistic regression contains a new evaluation measure of odds ratio and no longer includes a regression equation and R^2 as with linear regression. The lack of the regression equation is due to the fact that the output of logistic regression is binary, such as 0/1, and therefore would not plot along a continuous line as with the linear regression variable output, such as height.
P-value
Also known as the significance value, generally p-value below 0.05 is considered significant. For regression, this would indicate that the variable has a significant effect on the model and should be retained, whereas non-significant variables (or those with a p-value greater than 0.05) should be removed from the model.
Errors
Errors are calculated from the predicted value less the actual value, which is also known as the residuals. Common measures of errors are sum of squared errors (SSE) and root mean square error (RMSE). The measures are calculated by taking the square or square root of the errors.
Lift
Lift is a measurement between a random or baseline model against the analytical model. A higher lift or outperformance of the random selection is best.
Misclassification Rate
For models with nominal or binary targets, the percentage of total records misclassified as false positive or false negative.
Odds Ratio
Odds ratio is the relationship between probabilities. If the odds ratio is 2, for each unit increase in the input, the odds of belonging to the class increase by a factor of 2. The odds of an event can be measured by the odds of the true case divided by the odds of the false case. An odds ratio less than 1 can be interpreted as for each unit increase in the input, the odds of belonging to the class decrease.
Now that we have covered the logistic regression model, let’s continue with an experiential learning application to connect your knowledge of logistic regression with a health application about hospital acquired conditions.
Experiential Learning Application: Hospital-Acquired Conditions
Past studies have attempted to review factors associated with hospital-acquired conditions, and have found that these hospital-acquired conditions can affect any age, gender, or region. In a Veterans Affairs (VA) hospital study, researchers examined hospital acquired acute kidney injury (HA-AKI) in order to identify high risk patients and prevent a potential cause of death. Acute kidney injury (AKI) occurs in 1-5% of hospitalized patients with mortality rates starting at 15% and is associated with other conditions such as myocardial infarction, chronic kidney disease, and end-stage renal disease. For the original study, over 1.6 million patients and over 116 VA hospital’s EHR data was collected. Risk factors examined included medications, diagnosis, and demographic factors. Many existing risk models for identifying AKI use logistic regression (Singth et al., 2013; Cronin et al., 2015).
As an example of logistic regression, let’s use a similar study to determine the risk factors that led to hospital acquired acute kidney injury (HAAKI). To start our process, we first want to identify our input and target variables. In this example, our inputs (x) are demographics, medications, and diagnosis, and our target (y) is hospital acquired acute kidney injury (HAAKI). Based on the model parameters for logistic regression, our inputs can be continuous, nominal, or binary, and our output will be binary (yes/no, or 0/1). In this application, the goal or target variable will be to determine whether a patient is at risk for HAAKI. For identified at-risk patients, interventions can be completed to improve mortality outcomes.
Data Set File: 6_EL1_HAAKI.xlsx
Variables:
● PatientID, unique patient identifier
● Admit_Age, in years
● BMI, body mass index
● Gender, male (M) or female (F)
● Race, (American Indian-Alaskan, Asian-Pacific Islander, Black, White)
● Alcoholism, condition indicator (1=True, 0=False)
● Anemia, condition indicator (1=True, 0=False)
● Cancer, condition indicator (1=True, 0=False)
● COPD, Chronic Obstructive Pulmonary Disease or lung disease condition indicator (1=True, 0=False)
● Dyslipidemia, cholesterol condition indicator (1=True, 0=False)
● Hepatitis, condition indicator (1=True, 0=False)
● HIV, Human Immunodeficiency Virus condition indicator (1=True, 0=False)
● Dementia, condition indicator (1=True, 0=False)
● RA, Rheumatoid Arthritis condition indicator (1=True, 0=False)
● Hemiplegia, paralysis condition indicator (1=True, 0=False)
● HAAKI, Hospital Acquired Acute Kidney Injury condition indicator (1=True, 0=False)
Step 1: Sign in to SAS OnDemand for Academics.
Step 2. Open SAS Enterprise Miner (Click the SAS Enterprise Miner link).
Step 3. Create a New Enterprise Miner Project (click New Project).
Step 4: Use the default SAS Server, and click Next.
Step 5: Add Project Name HospitalAcquiredConditions, and click Next.
Step 6: SAS will automatically select your user folder directory (If you are using desktop version, choose your folder directory), and click Next.
Step 7: Create a new diagram (Right-click Diagram).
Step 8: Add a File Import node (Click the Sample tab, and drag the node onto the diagram workspace).
Step 9: Click the File Import node, and review the property panel on the bottom left of the screen.
Step 10: Click Import File and navigate to the 6_EL1_HAAKI.xlsx Excel File.
Step 11: Click Preview to ensure that the data set was selected successfully, and click OK.
Step 12: Right-click the File Import node and click Edit Variables.
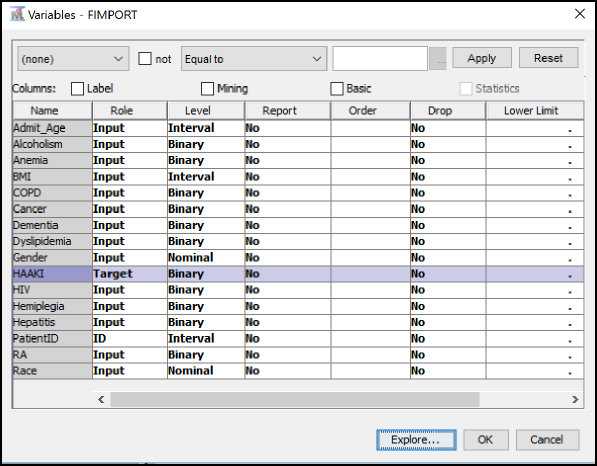
Step 13: Set HAAKI to the Target variable role, set PatientID to the ID role, and all other variables to the Input role. Set the Admit_Age, BMI, and PatientID variables at Interval levels. Set the Gender and Race variables to Nominal levels. Set all remaining condition variables to Binary levels. To review an individual variable to verify its role and level assignment, click the variable name and click Explore. After you have finished setting all variables, click OK.
Figure 6.5: Edit Variables
Step 14: Add a Data Partition node (Click the Sample tab, and drag the node onto the diagram workspace). Set the Data Partition Property Data Set Allocations to 60.0 for Training, 40.0 for Validation, and 0.0 for Test.
Figure 6.6: Data Partition Node

Step 15: Review the Data Partition results, and verify the number of observations in the original data (of 16000 records), and the split between Train of 9599 and Validate of 6401.
Figure 6.7: Data Partition Results

Step 16: Add a Stat Explore node, Graph Explore node, and MultiPlot node (Click the Explore tab, and drag the nodes onto the diagram workspace). Set the Graph Explore Property Sample Size to Max.
Figure 6.8: StatExplore, Graph Explore, and MultiPlot Nodes

Step 17: Review the Stat Explore results for missing data and outliers. From the data, the BMI and Race variables are the most commonly missing value, with 642 and 467 records missing, respectively. Note the BMI and Race variables are included in two different sections of the output since BMI is an interval variable and Race is a nominal variable with five levels or categories. As this data set is simulated from VA study data, many times, the forms require some information and leave other information, as optional. There might also be cases where the form might not include all options if only a limited selection of choices, such as for race, are available, thereby causing individuals to bypass or skip the data entry. There might also be a case where individuals might not know or be able to easily calculate their BMI. For example, most individuals know their age, height, and weight. However, converting this to a BMI number is typically something most individuals would not be expected to know. In this instance, the system or electronic form could automatically compute this value, which would help improve the overall data quality and also would improve the efficiency of form completion. The automatic filling or calculation in forms would be ideal. For example, some forms have date of birth and age. However, age can be easily calculated from date of birth and can be considered duplicate or double-entry. As another example, a patient enters an ID on an electronic form, and the form then would autocomplete all demographic and medical information to allow the patient to complete only the additional necessary sections, saving time and improving data quality.
Figure 6.9: Stat Explore Results

Step 18: Review the Stat Explore results variable worth. The graph gives an early indication of the variables that might prove most important in the model. For this model, the three variables that have the most worth with regard to the HAAKI target variables, in order of worth, are HIV indicator, Admit_Age, and Cancer indicator. From the graph, we also see Gender has the least worth. In attempting to describe the data results, you might review why gender has less worth for the target. In looking back at our data set description, the data set represents patients at a veteran’s hospital (or for military personnel), and the gender is predominantly male at nearly 97%. Since the majority of the records contain a single value for gender, the ability of the model to use gender to determine HAAKI is limited. Expanding the data set to include additional hospitals with female patients might increase the gender variable importance.
Figure 6.10: Stat Explore Results Variable Worth

Step 19: Review the Graph Explore results. Place your pointer over the bars to see the values as tooltip text. HAAKI = 1 or True occurred in 800 records.
Figure 6.11: Graph Explore Results

Step 20: Review the MultiPlot results. Scroll through the variables, and note the gender variable breakdown. We will revisit this in a later step.
Figure 6.12: MultiPlot Results

Step 21: Add an Impute node (Click the Modify tab, and drag the node onto the diagram workspace). Verify that the Impute Property is set to Count for Class variables and that Mean is set for Interval variables.
Figure 6.13: Impute Node

Step 22: Review the Impute results. The BMI and Race variables were replaced. Since these are different types of variables, as indicated in the measurement level, either the mean or count was used. For BMI, since this is an interval variable, the average or mean of 27.99 was used to replace any missing values. For Race, since this is a nominal variable, the value with the highest count in the data set of White was used to replace the missing values. Note that because the Impute node new variables are created in the data set, we now have IMP_BMI and IMP_Race. The two variables are added to the end of the data set with the original variables preserved.
Figure 6.14: Impute Results

Step 23: Add a Regression node (Click the Model tab, and drag the node onto the diagram workspace). Note that in the property panel for class targets, the Logistic Regression model is automatically selected. The model selection is based on the Target variable Role in the Edit Variables under the File Import, which we completed in the earlier steps.
Figure 6.15: Regression Node

Step 24: Right-click the Regression node, and click Run.
Step 25: Expand Output Window Results.
Step 26: Review Analysis of Maximum Likelihood Estimates Model Results. The output includes an analysis of maximum likelihood estimates, which includes parameter and Pr > ChiSq (or significance).
Figure 6.16: Analysis of Maximum Likelihood Estimates

Step 27: Review Odds Ratio Results. Odds can range from 0 to infinity and is the ratio of success to failure. If the odds of success are 4 (or 4 to 1), the odds of failure would be the inverse (or 1% to 4% or 25%). The odds ratio can be calculated from the odds of each of the groups and compares the odds of an event that occurs divided by the odds that the event does not occur. Odds ratio interpretation varies based on whether the target variable is interval or nominal. Interval (or continuous) variables that have an odds ratio over 1 explain that the target variable is more likely to occur as the input variables increase. For target variables that are nominal or categorical, an odds ratio greater than 1 explains that the category is more likely to occur. An Odds Ratio for Level 0 versus Level 1 is 4 indicates that the event of 1 is 4 times greater that the odds for level 0 (Minitab, 2016; IDRE, 2017).
Figure 6.17: Odds Ratio

Step 28: Review Event Classification Table Results. The Event Classification Table shows the overall model performance. When training the model, we received 455 False Negatives, 9107 True Negatives, 12 False Positives, and 25 True Positives. To calculate the error rate, we add the False Negatives and False Positives and divide by the total number: (455 + 12) / (455 + 9107 + 12 + 25) = 467/9599 = 4.87% error rate. We can do the same for the Validate data set: (296 + 10) / (296 + 6071 + 10 + 24) = 306/6401 = 4.78% error rate. Both of these values indicate that our model performs well for determining the status of HAAKI. If the training error rate was much lower than the validation error rate, this can indicate that we overfit the model. In this application, our model performed well when presented with a new set of validation data.
Figure 6.18: Event Classification Table

Step 29: Review Fit Statistics Results. Alternatively, instead of manually calculating the error rate from the Event Classification Table, the Fit Statistics output window can be used for various error rate comparisons. Notice the last entry on Misclassification Rate, which matches the manual calculation above at 4.87% for Train and 4.80% for Validation.
Figure 6.19: Fit Statistics

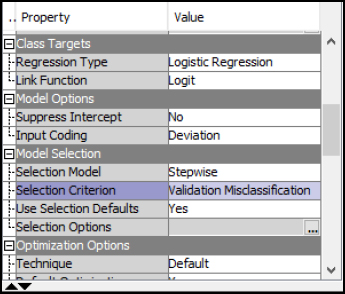
Step 30: In the Logistic Regression properties, the best model is selected based on the lowest Validation Misclassification rate in a Stepwise selection. Verify these match with your property settings and re-run the logistic regression node. In other words, when the logistic regression adds one variable at a time and tests the validation misclassification rate after each variable is added, the lowest or best error rate model is used.
Figure 6.20: Logistic Stepwise Property
Step 31: Review Logistic Stepwise Results. In the Logistic Regression results, the best model selected is in step 2 with two variables of Admit_Age and HIV. The results indicate that, with these two variables, a low validation misclassification rate is achieved. The model is sometimes called the parsimonious model, or, put another way, is the simplest-best model. In other words, all things considered, we want to choose the simplest and best performing model instead of an overly complex model. The parsimonious model is chosen due to a number of reasons, including diminishing improvements in validation error rates, cost to collect additional data variables, and performance when running the model in a live operational setting. The stepwise selection guides us in choosing the simplest-best model or the parsimonious model. (You might also find humor in the irony that the parsimonious term name is not so simple!)
Figure 6.21: Logistic Stepwise Results

Model Summary
In summary, the logistic regression can contain 1 or more inputs and 1 target. The inputs can be continuous or categorical, whereas the target will be binary (0/1 or yes/no). To evaluate the logistic regression, we can use error, lift, p-value, odds ratio, and misclassification rate.
● Model: Regression node
● Logistic Regression: 1+ input and 1 target variable
● Input: Interval, Binary, or Nominal
● Target: Binary or Nominal
● Evaluation: Error, Lift, p-value, Odds Ratio, Misclassification Rate
Experiential Learning Application: Immunizations
According to the World Health Organization (WHO), immunizations help stop 2-3 million annual deaths. Polio, which is an infectious viral disease, that can cause paralysis, was once considered to be eradicated. It is now returning to at-risk populations such as children. It is estimated that nearly 19 million infants have missing vaccinations. In some cases, reports about vaccination results, such as links to other diseases, have led to distrust, along with personal, religious, or moral objections and have caused children not be vaccinated. In Ukraine, nearly 50% of children have not received all immunizations. In California, an outbreak of measles in 2014 resulted in a legislative bill to require all children to be vaccinated, with opposition to overturn the requirement. Structural or cultural issues can also create issues due to lack of resources or competing priorities. WHO is working on a Global Vaccine Action Plan (GVAP) with a goal of 90% national vaccination coverage by 2020. Early results show that the progress is behind schedule due to public acceptance even when reports or previously eradicated diseases arise (Nesson, 2016).
Past studies have attempted to review factors associated with vaccination. These factors reviewed include education, age, socio-economic status, religion, health usage, urban and rural areas, and media exposure. In a study in Zimbabwe, three sets of factors were reviewed to determine the immunization status of children 12-23 months. Predisposing factors such as gender, birth order, mother age, marital status, media exposure, religion, place of delivery, and natal care were reviewed. Enabling factors included education, wealth, rural-urban, region, and employment status. Region of the country was also found to have a significant effect on vaccination, with some regions being five times more likely to be vaccinated. The education level of the mother was also significant. Mothers with secondary education were two times more likely to have their children fully vaccinated. High wealth or income mothers were two times more likely to receive full vaccination. Birth order, place of delivery, and care during pregnancy also were significant factors in vaccination (Munkungwa, 2015; Wiley, 2017).
The CDC also releases annual vaccination schedules for children and those under 18 years of age, along with separate vaccination schedules for adults. The immunizations are provided each year based on approved recommendations from the Advisory Committee on Immunization Practices (ACIP). The yearly CDC schedule includes a number of immunizations and updates, including recommended ages and frequency. Immunizations include influenza, measles mumps and rubella (MMR), hepatitis A and B, tetanus diphtheria and acellular pertussis (Tdap), pneumococcal, meningococcal, polio, and others. The CDC also maintains a Behavioral Risk Factor Surveillance System (BRFSS), which includes prevalence of immunization data within the U.S. (CDC, 2017b; CDC, 2017c, CDC, 2017d).
A sample has been provided for you to get started, the Immunization data set includes 16 variables and 1817 records. Help your management team answer the following questions, follow the SEMMA process and provide recommendations.
Question: Which factors best determine whether a patient will receive a flu shot immunization?
Data Set File: 6_EL2_Immunizations.xlsx
Variables:
● Year
● State, CA
● FluShotVaccine, (1=True, 0=False)
● Gender, (Female, Male)
● Age Group, in years (65-74, 75+)
● Race/Ethnicity, (Black non-Hispanic, Hispanic, Multiracial non-Hispanic, White non-Hispanic, Other non-Hispanic)
● Education_Attained (College graduate, Some post-H.S., H.S. or G.E.D., Less than H.S.)
● Immunization, (0/1, No/Yes)
Follow the SEMMA process for your experiential learning application. A template has been provided below that can be reused across future projects.
Figure 6.22: SEMMA Process
|
Title |
Immunizations |
|
Introduction |
Provide a summary of the business problem or opportunity and the key objective(s) or goal(s). Create a new SAS Enterprise Miner project. Create a new Diagram. |
|
Sample |
Data (sources for exploration and model insights) Identify the variables data types, the input and target variable during exploration. Add a FILE IMPORT Provide a results overview following file import: Input / Target Variables Generate a DATA PARTITION |
|
Exploration
|
Provide a results overview following data exploration Add a STAT EXPLORE Add a GRAPH EXPLORE Add a MULTIPLOT Summary statistics (average, standard deviation, min, max, and so on.) Descriptive Statistics Missing Data Outliers |
|
Modify |
Provide a results overview following modification Add an IMPUTE |
|
Model
|
Discovery (prototype and test analytical models) Apply a stepwise regression model and provide a results overview following modeling. Add a REGRESSION Model description Analytics steps Regression results (p-value, odds ratio) Model results (Classification Matrix, Lift, Error, Misclassification Rate) Correlation Matrix (which variables measure the same thing) Selection Model |
|
Assess and Reflection |
Provide overall recommendations to business Model advantages / disadvantages Performance evaluation Model recommendation Summary analytics recommendations Summary informatics recommendations Summary business recommendations Summary clinical recommendations Deployment (operationalization plan: timeline, resources, scope, phases, project plan) Value (return on investment, healthcare outcomes) |
Review, reflect, and retrieve the following key chapter topics only from memory and add them to your learning journal. For each topic, list a one sentence description/definition. Connect these ideas to something you might already know from your experience, other coursework, or a current event. This follows our three-phase learning approach of 1) Capture, 2) Communicate, and 3) Connect. After completing, verify your results against your learning journal and update as needed..
|
Key Ideas – Capture |
Key Terms – Communicate |
Key Areas - Connect |
|
Provider Anamatics |
|
|
|
Provider Inpatient/Outpatient Setting |
|
|
|
EHR/EMR |
|
|
|
EHR Implementation Process |
|
|
|
EHR Implementation Success Factors |
|
|
|
Open vs Closed Source |
|
|
|
Cloud vs On-Premise |
|
|
|
Logistic Regression |
|
|
|
Odds Ratio |
|
|
|
Event Classification Table |
|
|
|
Stepwise Regression |
|
|
|
Parsimonious |
|
|
|
Hospital Acquired Conditions Application |
|
|
|
Immunizations Application |
|
|