
Chapter 8: Modeling Government Data
Department of Health and Human Services (HHS)
Centers for Disease Control and Prevention (CDC)
Centers for Medicare and Medicaid Services (CMS)
Food and Drug Administration (FDA)
National Institutes of Health (NIH)
Experiential Learning Activity: Government Data Sharing
Government Billing and Payments
Experiential Learning Activity: Billing Issues and Fraud and Abuse
Model Tab Enterprise Miner Node Descriptions
Experiential Learning Application: Fraud Detection
Experiential Learning Application: Hospital Readmissions
The purpose of this chapter is to develop data modeling skills using SAS Enterprise Miner with respect to the Model capabilities within the SEMMA process. This chapter explores modeling with the neural network model. This chapter also includes experiential learning application exercises on fraud detection and hospital readmissions. The focus of this chapter is shown in Figure 8.1.
Figure 8.1: Chapter Focus – Model

● Describe the Model process steps
● Understand government-level data sources
● Develop data modeling skills
● Apply SAS Enterprise Miner model data functions
● Master the neural network model
The U.S. government has established a number of organizational agencies involved in various aspects of healthcare. Key government agencies include the Department of Health and Human Services (HHS), Centers for Disease Control and Prevention (CDC), Centers for Medicare and Medicaid Services (CMS), Food and Drug Administration (FDA), National Institutes of Health (NIH), Drug Enforcement Agency (DEA), and Office of Civil Rights (OCR) (HHS, 2017a). To give an idea of the size of the organizational scope in 2017, CMS had an annual budget of $1 trillion. The FDA had an annual budget of $5 billion, the CDC had an annual budget of $12 billion, and the NIH had an annual budget of $33 billion (HHS, 2017b).
The Department of Health and Human Services (HHS) is charged with enhancing the health and well-being of Americans by providing for effective health and human services and by fostering sound and sustained advances in the sciences underlying medicine, public health, and social services. To support this mission, the budget provides $82.8 billion in discretionary funding for HHS as well as new mandatory investments to expand mental health services, opioid abuse treatment availability, and research and development (HHS, 2017c). HHS is an umbrella organization with eleven operating divisions and many agencies providing services and protecting Americans through improving health and well-being. Some of the larger and well-known agencies include the Centers for Disease Control and Prevention (CDC), Centers for Medicare and Medicaid Services (CMS), Food and Drug Administration (FDA), and National Institutes of Health (NIH) (HHS, 2017a). Similar to HHS in the U.S., the National Health Service (NHS) in the United Kingdom (U.K.) is responsible for establishing priorities to improve health care and well-being. NHS has a budget of over £100 billion and aims to ensure efficient and effective care is being provided (NHS, 2017).
The Centers for Disease Control (CDC) is responsible for protecting Americans from health, safety, and security threats both nationally and internationally. Disease can include chronic conditions, curable conditions or preventable conditions, and deliberate attacks. CDC provides health information and supports scientific research in order to protect against and respond to threats. CDC has an annual budget of over $12 billion, working in over 60 countries with over 13,000 staff members (CDC, 2017e; CDC, 2017f).
The Centers for Medicare and Medicaid Services (CMS) covers over 100 million individuals with an overall goal of low-cost, high-quality care. President Lyndon B. Johnson signed a bill on July 30, 1965 that initiated Medicare and Medicaid and included two primary components: 1) Part A for hospital insurance, and 2) Part B for medical insurance. In 1972, Medicare was expanded to include additional coverage and benefits for the disabled (including those with end-stage renal disease and those who are over 65 of age) and prescription drug coverage. Medicaid was also expanded its services to account for income, pregnancy, disabilities, and long-term care. In 2003, The Medicare Prescription Drug Improvement and Modernization Act (MMA) was a major update to Medicare, including a Part C for private health plan coverage and Part D for optional prescription drug benefits. In 1997, the Children's Health Insurance Program (CHIP) was added for uninsured children. In 2010, the Affordable Care Act (ACA) established the Health Insurance Marketplace, which is a central location for patients to enroll in health insurance plans (CMS, 2017c; CMS, 2017d).
The Food and Drug Administration (FDA) is responsible for ensuring safety, efficacy, and security of drugs (both prescription and non-prescription). It also manages biologics (such as vaccines and medical devices that range from simple items such as tongue depressors to more complex items such as pacemakers), foods (including supplements and additives), cosmetics (including makeup and perfume), veterinary products (including pet foods), items that emit radiation (such as microwave ovens), and tobacco regulation (including cigarettes) (FDA, 2017a; FDA, 2017b).
The National Institutes of Health (NIH) is responsible for discovering and applying knowledge to improve health and longevity and to decrease illness and disabilities. The mission is accomplished through innovative research and scientific discoveries. Over 80% of the $32 billion NIH budget is distributed through nearly 50,000 competitive grants to 300,000 researchers at over 2,500 institutions (NIH, 2017a; NIH, 2017b).
The Drug Enforcement Administration (DEA) was established to enforce controlled substances in the U.S. and support non-enforcement programs to reduce the availability of controlled substances nationally and internationally. The DEA was included in an announcement by the U.S. Justice Department on the seizure of the largest international online marketplace. The announcement was part of a coordinated law enforcement effort by the U.S., Thailand, the Netherlands, Lithuania, Canada, the U.K., and Europe. The online marketplace seized by the DEA was a dark web location for illegal drugs and other criminal activities. At the time of the shutdown, there were over 250,000 illegal drug and toxic chemical listings (DEA, 2017a; DEA, 2017b).
The Office of Civil Rights (OCR) protects nondiscrimination and privacy rights through the Health Insurance Portability and Accountability Privacy Rule (HIPAA) and the Patient Protection and Affordable Care Act (ACA). The nondiscrimination provision of the Affordable Care Act (ACA) prohibits discrimination on the basis of race, color, national origin, sex, age, or disability in certain health programs or activities. The OCR assists with nondiscrimination and privacy rights through education of health and social workers and of communities on privacy and confidentiality laws. In addition, OCR is responsible for investigating complaints about civil rights, privacy, confidentiality, and patient safety in order to identify violations of the law and take appropriate corrective actions (OCR, 2017).
Governments around the world are in a position to have a tremendous impact on healthcare. Nevertheless, government adoption of health anamatics has proved challenging. In the U.K., a project was started in 2002 to upgrade the National Health Service (NHS) information systems, including electronic health records and integrated systems. The project wound up being one of the costliest failed projects in world history. The project was ultimately abandoned yet still cost taxpayers an estimated £10 billion (or $13-$20 billion USD, depending on the exchange rate. The project was plagued with technical challenges, changing requirements, management problems, contractual issues, and disputes with suppliers (UK Politics, 2013; Syal, 2013). In an interview conducted by the World Health Organization (WHO) with Desmond Tutu, chairman of the Global eHealth Ambassadors Program (GeHAP), the importance of governments in fueling technology and e-health adoption was discussed. Governments establish the guidelines and regulations for healthcare and have a great influence on the industry in setting the right policies and strategies, including building an environment for e-health adoption through government funding and health-related training. Hamadoun Touré, secretary-general of the International Telecommunications Union, cites technical issues, scalability, and politics as major barriers to successful completion. He underscored the necessity for cooperation between government and all stakeholders (WHO, 2012).
In the U.S., the governmental share of healthcare spending is expected to grow from 64.3% in 2014 to 67.1% by 2024. The share includes programs such as Medicare, Medicaid, public employee health insurance coverage, and tax savings. The U.S. government’s share is one of the highest global rates, even exceeding countries known for universal healthcare programs. The statistic counters most individuals’ beliefs that in the U.S. the majority of healthcare is privately funded and operated (Himmelstein and Woolhander, 2016; Almberg, 2016). Government healthcare cost growth at 5.9% per year is expected to exceed private healthcare cost growth at 5.4% per year through 2025. The faster increase for governmental spending is projected due to Medicare growth from the baby boomer generation along with government subsidies for health insurance enrollments for low-income applicants (CMS, 2017e).
In the U.S., key legislative regulations have occurred over several decades and have had a significant impact on various healthcare entities. The growth started in 1996 with HIPAA and continued through ARRA in 2009, ACA in 2010, and proposed AHCA and BCRA legislation in 2017. A more detailed view of each follows.
Figure 8.2: Key Government Regulations Timeline

● 1996 - Health Insurance Portability and Accountability Act (HIPAA)
● 2009 - American Recovery and Reinvestment Act (ARRA)
o Health Information Technology for Economic and Clinical Health Act (HITECH)
● 2010 - Affordable Care Act (ACA)
● 2017 - American Health Care Act (AHCA)
● 2017 - Better Care Reconciliation Act (BCRA)
1996 – Health Insurance Portability and Accountability Act (HIPAA)
The Health Insurance Portability and Accountability Act (or HIPAA) was passed in 1996 and was a Congressional measure to reform healthcare. The overall objectives of the act were to ensure that individuals could move their health insurance between jobs (the portability) and ensure security and privacy of patient data with standardization of data. HIPAA further defined a set of rules for implementation including transactions, code sets, and identifiers for data standardization, privacy, and security (UCMC, 2010).
HIPAA Transactions and Codesets Rule
Within healthcare, The Department of Health and Human Services (DHHS) estimated that as many as 400 different data formats were being used to exchange data between healthcare entities in addition to the use of paper or other manual methods being used. In an effort to improve the process, the transactions and code-sets rule described a set of standard Electronic Data Interchange (EDI) transactions, which is covered in Chapter 7. The rule included standards for sending and receiving healthcare claims, healthcare enrollment, healthcare eligibility, healthcare payment, healthcare status, healthcare referrals and authorizations, coordination of benefits, and reporting of injury. Later, other transactions included paperwork attachments (UCMC, 2010).
Security and Privacy Rules
The privacy rule’s main component is the area of Protected Health Information (PHI). PHI includes items such as name, address, birthdate, Social Security number, and biometric information. In addition, patient permission is required to use or disclosure information. Civil and criminal penalties were included for those who violate or disobey the rule, and the penalties range up to $1,500,000 in fines and/or ten years in prison (HHS, 2016). The security rule develops standards and safeguards to protect electronic protected health information (ePHI) (UCMC, 2010). The security and privacy rules are further discussed in the context of health care administration in Chapter 9.
2009 - American Recovery and Reinvestment Act (ARRA)
Despite spending billions on U.S. health information technology over the last several decades, there are still issues relating to costs, errors, efficiency, and coordination of care, which reflect the limited saturation of health information technology within healthcare systems. Inefficient paper-based systems, inaccessible medical information during care, limited patient access to health information, misinterpreted handwriting, and unavailable best treatment options affect the current healthcare systems (Woodside, 2007a). In 2004, the Bush Administration called for the next ten years to the be decade of health information technology, and, by 2014, EHRs would be universally adopted. An Office of the National Coordinator of Health Information Technology (ONCHIT) was established to lead the effort and was supported by the Health Information Technology and Clinical Health Act (HITECH) in 2009 (Burke and Will, 2013).
2010 – Affordable Care Act (ACA)
The Patient Protection and Affordable Care Act, or commonly known as the ACA (or Obamacare), was passed in 2010 by the U.S. Senate and contained over 900 pages of legislation with varying implementation dates. The goal was to provide access to quality and affordable healthcare while reducing costs. The Congressional Budget Office (CBO) estimated that the ACA would provide over 94% of Americans with coverage within a $900 billion budget limit that President Obama established, which would reduce
healthcare costs and the deficit over the next decade. The ACA contains nine major sections (or titles) for healthcare reform, including:
● Quality and affordable healthcare for all Americans (such as health insurance exchanges)
● Role of public programs (such as Medicaid)
● Improving quality and efficiency (such as through value-based and pay for performance programs)
● Prevention of chronic disease and public health (such as healthy communities)
● Healthcare workforce (such as support through education, and training)
● Transparency and program integrity (such as public information reporting and research)
● Improvements in access to innovative medical therapies (such as biologics or biosimilar products and drug discounts)
● Class act (such as community living assistance support and long-term care insurance)
● Revenue provisions (such as taxes on high cost employer health coverages and voluntary procedures)
● Strengthening quality and affordable healthcare (such as incentives and value-based programs)
As the main component of the ACA, the first title is quality and affordable healthcare for all Americans. The section includes a number of key components including: Elimination of discriminatory practices such as excluding coverage due to pre-existing conditions, provided coverage for everyone, provided tax credits to ensure affordability, eliminated limits on benefits, provided coverage for immunizations and preventive services, increased coverage for dependents through age 26, developed similar coverage documents to more easily compare insurances, created limits on non-medical and administrative expenses by insurance companies, and created shared responsibility. As a method to create shared responsibility, if coverage is not maintained, a penalty will be due for most individuals. The penalty will increment over time and is approximately $700 per adult. In 2017, due to potential changes in legislation, the Internal Revenue Service (IRS) indicated that tax returns would still be processed even if the ACA requirement is not met (US Senate, 2010; NCSL, 2011; Goldstein, 2017). The tax position was later clarified by the IRS in early 2018. As a result of the Tax Cuts and Jobs Act, the IRS would require taxpayers to report coverage, have an exemption, or pay the penalty (IRS, 2018). The ongoing legislative landscape of 2017 and 2018 takes us to our next section on AHCA.
2017 – American Health Care Act (ACHA)
The American Health Care Act (AHCA) of 2017 was intended to replace the ACA. The ACA was commonly referred to as Obamacare as advocated by President Obama, and the AHCA was commonly referred to as Trumpcare (or Ryancare) as the legislation was advocated by President Trump and Speaker of the House Ryan. The naming is a result of the U.S. President in office at the time of the legislation and as the major driving force behind the legislation as a result of campaign promises to reform healthcare. The main components of AHCA include a repeal of the ACA and Health Care and Education Reconciliation Act of 2010, a tax deduction for health insurance, and an update to Health Savings Accounts (HSAs), among other changes. The bill was introduced to the House of Representatives on January 4, 2017. Before a formal vote was made, the bill was withdrawn, in part based on some opposition to provisions within the bill (Roe, 2017). Due to uncertainty in government payments through the ACA health insurance exchange system due to planned AHCA legislature, Anthem announced plans to exit state markets in 2018 such as Ohio. Anthem was the only insurance company that sold health insurance exchange produces in all 88 Ohio counties and the only insurer in 20 counties (Humer, 2017). After changes to the bill, including protections for pre-existing conditions, the bill was passed by the House on May 4, 2017 in a 217-213 vote (Soffen, et al., 2017).
2017 – Better Care Reconciliation Act (BCRA)
Although the AHCA was the U.S. House of Representatives version, the Better Care Reconciliation Act (BCRA) was the U.S. Senate draft version of a new healthcare bill. Key differences between BCRA and ACHA included a longer schedule to reduce Medicaid and retention of some ACA components such as premium subsidies and taxes. BCRA, like AHCA, would not completely repeal ACA, and rules such as dependent coverage through age 26, exclusions on lifetime limits, Medicare provisions, and prohibition of discrimination would remain intact (Kendrick, et al., 2017). In July 2017, there were several Congressional discussions on bill amendments, including an abridged “skinny” repeal of ACA without a replacement, which is also known as the Healthcare Freedom Act (HCFA). Despite these modifications, the bill failed to pass and temporarily ended the passage of a major comprehensive health care bill (Caldwell and Hillyard, 2017). A later version of BCRA, named the Graham-Cassidy health care bill, was also shelved following lack of Congressional support. The Graham-Cassidy bill sponsors, Senator Lindsey Graham of South Carolina and Bill Cassidy of Louisiana, have indicated they will continue to pursue the repeal and replacement of the ACA (Mukherjee, 2017).
Experiential Learning Activity: Government Data Sharing
|
Government Data Sharing |
|
Description: In the U.S., the http://healthcare.gov website administered by the federal CMS agency is intended to allow consumers to purchase subsidized health insurance. The website contains connections with outside vendors and advertisers that might be able to identify you on the site through information shared such as age, income, ZIP code, and health factors including smoking and pregnancy. Although no information breaches or security issues have been found, and vendors are prohibited from using information for company purposes, some consultants and advocates raise privacy and security concerns about data that is retained about individuals (Alonso-Zaldivar and Gillum, 2015). According to the terms of the website, CMS might share your information with contractors that perform functions for the healthcare.gov marketplace, government agencies to combat fraud and abuse, insurance companies, Internal Revenue Service (IRS), health plans, consumer credit agencies, homeland security, social security, and employers listed on your application to verify eligibility (CMS, 2017f).
Several governments entities have also developed health information exchanges (HIEs) where protected health information (PHI) is shared. In North Carolina, several health systems have agreed to supply data to the state-sponsored HIE known as NC HealthConnex containing nearly 4 million patients from 100 data providers (Snipes, 2017). A health information exchange (HIE) is intended to allow a standardized method to exchange electronic health information across organizations. The HIE can operate in the context of a regional health information organization (RHIO) typically at a state level, or a national health information network (NHIN) at a national level. The HIE can be used to exchange information, improve health outcomes for individuals, assist with medical provider decision making, monitor and improve quality, evaluate policy and allow accreditation. A few states have developed HIEs through several barriers exists including policies, financial, legal, and technical considerations (Hebda and Czar, 2013).
To discuss this government information sharing in the context of a code of ethics, we turn to AHIMA. The American Health Information Management Association (AHIMA) is a worldwide association of over 103,000 health information management (HIM) professionals worldwide. The AHIMA was founded in 1928 with an aim of improving health record quality and management of health data according to world class practices and standards (AHIMA, 2017a). AHIMA has developed a set of ethical obligations for HIM professionals, which include safeguarding, protecting, maintaining, and ensuring access and integrity of health information. As consumers are becoming increasingly aware and concerned about personal health information security and privacy, there are often questions on how personal health information is used, disclosed, collected, shared, handled, accessed, and retained. Although compliance regulations exist at a federal, state, and employer level, ethical considerations must also be considered. The ethical considerations are a component of professional responsibility and extend beyond an employer. The following set of ethical principles was developed as part of the AHIMA core values (AHIMA, 2011).
A health information management professional will do the following: ● Advocate, uphold, and defend the individual's right to privacy and the doctrine of confidentiality in the use and disclosure of information. ● Put service and the health and welfare of persons before self-interest and conduct oneself in the practice of the profession so as to bring honor to oneself, their peers, and to the health information management profession. ● Preserve, protect, and secure personal health information in any form or medium and hold in the highest regards health information and other information of a confidential nature obtained in an official capacity, considering the applicable statutes and regulations. ● Refuse to participate in or conceal unethical practices or procedures and report such practices. ● Advance health information management knowledge and practice through continuing education, research, publications, and presentations. ● Recruit and mentor students, peers and colleagues to develop and strengthen professional workforce. ● Represent the profession to the public in a positive manner. ● Perform honorably health information management association responsibilities, either appointed or elected, and preserve the confidentiality of any privileged information made known in any official capacity. ● State truthfully and accurately one’s credentials, professional education, and experiences. ● Facilitate interdisciplinary collaboration in situations supporting health information practice. ● Respect the inherent dignity and worth of every person.
|
|
Does the government data sharing comply with the AHIMA code of ethics? Include the specific code components that you believe comply/do not comply.
|
|
Would you recommend any additions, changes or revisions to the code of ethics?
|
Government insurance billing works similar to the process for commercial insurance billing, typically through electronic data interchange (EDI), though can also occur through paper-based claims. Given the share of government payments in the overall healthcare marketplace, fraud and abuse have been a critical area of focus, as healthcare fraud and abuse costs both public and private sectors billions of dollars. In the U.S., the costs to public and private programs are estimated as high as 10% of annual spending or $100 billion per year. Many health systems rely on human experts for manual review, which is often expensive and ineffective. Data mining can reduce costs and identify previously unknown patterns and trends (Yang 2006; Liou et al., 2008). Increasingly, healthcare entities are using data mining tools to identify fraudulent behaviors. Data mining methods (including classification trees, neural networks, and regression) have been applied to healthcare. The Utah Bureau of Medicaid Fraud, Australian Health Insurance Commission, and Texas Medicaid Fraud and Abuse Detection mined data to identify fraud and abuse, saving and recovering millions of dollars. Although most fraud and abuse cases are associated with diagnosis and services, some studies used provider name, ID, demographics, claim patient, procedure, charge, bill date, and payment deductible, copayments, insurance, and payment dates to detect fraud (Viaenea 2005; Liou et al., 2008).
In Chapter 3, we discussed the capabilities of statistical sampling, which can also be applied to test for and identify fraud. In a recent case, industry groups have attempted to prevent statistical sampling from being used to prove liability for cases beyond the initial case. Opponents argue that preventing statistical sampling would allow larger scale fraud to continue. In another case. there was an allegation that a senior center and hospice facility in South Carolina conducted services that were not medically necessary. The whistleblowers identified only one facility. However, the case plaintiffs proposed the use of statistical sampling to apply the findings to all facilities. With this method, a random sample of services would be taken, and the percentage found to be fraudulent would be calculated across all claims. A lower court ruled that statistical sampling could not be used, with the 4th U.S. Circuit Court of Appeals declining to address the question of statistical sampling (Lauer et al., 2017). Other lower court rulings on statistical sampling have been mixed in the past. Based on the False Claims Act, damages of up to $11,000 per claim can be assessed, which could have a major impact on the tens of thousands of claims against a single facility or across all facilities (Schencker, 2017).
In 2017, The U.S. Justice Department added to a previous lawsuit that claims that the UnitedHealth Group, Inc. Medicare Advantage program overbilled hundreds of millions to billions of dollars by adding conditions (or more severe levels of conditions) to patients. This is a claim that UnitedHealth vowed to fight as untrue. The news caused shares to decline over 4% (Court, 2017b). The U.S. Justice Department also released information that an investigation into four health insurers had occurred due to a claim that Medicare was being defrauded by means of billing for treatments that patients did not receive or did not need (Raymond, 2017). In July 2017, the U.S. Justice Department announced that charges had been filed for over 400 individuals (including 56 physicians) for healthcare fraud totaling $1.3 billion in fraudulent charges. Officials indicated that this was one of the largest targeted healthcare fraud actions in history (Wilber, 2017).
|
Billing Issues and Fraud and Abuse |
|
Description: In healthcare, an estimated 3-10% of all costs are attributed to fraud and abuse, and detection remains an important issue as healthcare is highly susceptible to fraud and abuse. Fraud can be classified as unauthorized benefits along with abuse, which often might not be against any laws or might occur without deliberate intent. Fraud and abuse might occur by patients, providers, and payers. Examples of patient fraud include obtaining multiple prescriptions for the same medication from different physicians, identity theft of another patient’s health information, or using one patient’s insurance for another patient’s services. Examples of provider fraud and abuse include billing for services not provided, upcoming or including a more expensive service than what was performed, unbundling or charging separately for a single service, and receiving payment or kickbacks from other medical providers. Examples of insurer or payer fraud and abuse include falsifying reimbursements and collecting payment without providing services. General abuse examples include providing below acceptable levels of standard care, providing unnecessary tests or services, insufficient documentation, and charging additional items for insured patients versus uninsured patients (Rashidian et al., 2012). Methods to address fraud generally fall into three categories: prevention, detection, and response. Prevention strategies attempt to stop fraud beforehand. Prevention might be done through influencing cultural norms and compliance systems and processes. Studies in the U.S. showed that between 10-50% of physicians reported willingness to manipulate reimbursement rules in order for patients to receive necessary care. Patients were also willing to allow deception if it was to their benefit. Detection strategies attempt to locate fraud as soon as possible and create a notification for investigation. In a study in Taiwan, logistic regression, neural networks, and decision trees were used to detect fraud and abuse of diabetic services. In a related model, the ability to detect fraud was approximately 65% accurate. The final category of response strategies uses legal or administrative options to address the fraud and abuse such as fines and penalties. In a related study, the more lenient policies in the U.S. between 1997-2001 might have contributed to the increase in fraud and abuse over the same time period (Rashidian et al., 2012).
|
|
List the 3 intervention categories for fraud and abuse: 1. 2. 3. |
|
Based on the study, which of the 3 intervention categories is the least common, and which do you feel is most important?
|
|
From the study, findings state that up to 40% of physicians reported manipulating reimbursement rules to allow for necessary patient care. Do you feel this is legal and ethical?
|
|
Find an outside article and describe an example of fraud and abuse. From Table 1, which type of fraud and abuse example does this fit best (For example, Provider Fraud → Up-coding)?
|
Now that you are familiar with government agencies, regulations, and government billing and payments, we’ll continue with our SEMMA modeling process using data available through government billing systems, and review the neural network model.
During the modeling process step, the data mining model is applied to the data. During the partitioning phase, data is segmented into training and validation data sets. The training data set is used to fit the model, and the validation data set is used to validate the model on a new set of data to demonstrate the reliability of the model. Based on the results the model can then be tuned to optimal performance.
There are many different models that can be selected during this step. The decision to choose each model is based on earlier exploration of data and knowledge of each model. We will continue this chapter with the neural network model.
Model Application Examples
Neural networks are a class of nonlinear regression and statistical methods and have been studied extensively. Neural networks can be applied to a variety of applications including speech recognition, fraud, signature validation, mammogram screenings, identification of food infections, measurement of nurse burnout, and detection of heart failures.
Researchers have used neural networks for a variety of epidemiological events (or the patterns of diseases). Researchers predicted morbidity (or death) from environmental contaminants such as air pollution, weather, and conditions such as asthma. Another study used inputs of temperature, humidity, precipitation, sunshine amount, and rat density as viral carriers to study fever in Shenyang, China in the 1980s through early 2000s. Some epidemiological studies on environmental factors and morbidity showed a prediction accuracy rate using neural networks near 60% (Song et al., 2017).
In a study using neural networks to study nurse burnout, input factors including job stressors, personality, and syndromes were used. Nursing is considered an occupation that is susceptible to stress and affects professionals globally. The occupation has experienced a number of changes over the last several decades including readmission rates, efficiency emphasis, and demands of patients with acute and chronic conditions. Individual nurse interventions can then be made to reduce the risk of burnout and improve the work environment (Ladstatter, et al., 2016).
Researchers have also used EHRs in conjunction with neural networks to detect disease. Using EHR data, medical professionals can detect early onset of heart failure. Heart failure intervention often occurs only after diagnosis and carries a high risk of mortality near 50% within five years of diagnosis. Earlier detection of heart failure can improve patient outcomes through earlier treatment and changes such as reduced salt intake and mild exercise. Inputs to the model included age, gender, visits, diagnosis codes, medication codes, and procedure codes. The results were also compared with a logistic regression model. The neural network generally outperformed the logistic regression model, although the neural network took longer in terms of prediction time, in which logistic regression might be useful for real-time requirements, whereas neural network might be used for batch processing (Choi et al., 2017).
Neural Network Node
The Neural Network node is used for running a neural network model and is associated with the Model tab in SAS Enterprise Miner.
Figure 8.3: Neural Network Node

Neural Network Model Description
Neural networks are modeled after the human brain and were initially used for artificial intelligence to develop an ability to learn. In the brain, neurons accept inputs from other neurons, weight them, and produce outputs using a set of electrical signals. Similarly, in a neural network model, we have an input layer (or the variable inputs), a hidden layer where items are combined and weighted, and an output layer (or the target variable). Neural networks are sometimes referred to as a “black box,” meaning that data is submitted as input to the neural network, and output is received. The inner workings of the algorithm are not easily presented (Klimberg and McCullough, 2013). The neural network model differs from a decision tree in which the algorithm creates easy to interpret IF...THEN rules (or regression) in which an easy to apply regression equation is created. Despite the interpretability drawback, neural networks often have one the lowest error rates and are a very effective model. Neural networks can also accept different types of input variables and target variables that are similar to a decision tree.
Model Assumptions
For neural networks, a parsimonious model and a model with uncorrelated variables are preferred due to the complexity and performance time required to complete the algorithm and return the solution. Similarly, although a decision tree (or regression) might be able to accommodate hundreds of variables, that type of setup would not be preferred due to performance and run times. Generally, a single hidden layer is used. As a starting point, the number of nodes used initially in the hidden layer can be a number that is between the number of inputs and outputs. If there are five input variables and one target variable, there might be 3three nodes in the hidden layer to begin with for the first model run. Although no formal rule exists, one strategy is to begin with a simple number of nodes (parsimonious model) and increase the number of nodes, while measuring performance run times against results as measured by error rates. Neural network models with uncorrelated variables are preferred, and neural networks might be affected by outlier or extreme values. Overfitting can also occur. This happens when we measure the model solely on the training sample data, and we attempt to perfect the model for the training data only. This might lead to cases where new data performs poorly, or we are unable to generalize the model beyond the initial data set.
Data Preparation
Unlike decision trees, neural networks are affected by outliers and missing data. In addition, non-normalized or standardized data might affect the model weighting. To ensure proper results, all variables should be standardized before running the model. Outliers and missing data should be corrected or removed from the data before standardization.
Partitioning Requirements
For neural networks, we partition our data into a training and validation data set. The model is formed based on our training data set, and is then run through our validation or holdout data set to confirm validity of the model. If the model performs well on the training data set though poorly on the validation data set, this can indicate that we have overfit the model. In other words, we tuned the model too well to the training data set, and now, it no longer performs well on a new or general data set. In this case, we might wish to remove variables to create a simpler, more general model.
Model Results Evaluation
To evaluate the results of our neural network, we can use several items including errors, lift, and misclassification rate. The p-value will be available for models with an interval target variable.
Errors
Errors are calculated from the predicted value less the actual value, which is also known as the residuals. Common measures of errors are sum of squared errors (SSE) and root mean square error (RMSE). The measures are calculated by taking the square or square root of the errors.
Lift
Lift is a measurement between a random or baseline model against the analytical model. A higher lift or outperformance of the random selection is best.
Misclassification Rate
For models with nominal or binary targets, misclassification rate is the percentage of total records misclassified as false positive or false negative.
Ensemble Node
The Ensemble node is used to combine different models into a single final model. A common approach is to combine multiple models such as neural networks or decision trees with different parameters applied to a training data set. The final model can be selected based on various criteria such as error rates or statistical tests. The Ensemble node is associated with the Model tab in SAS Enterprise Miner (SAS, 2018a).
Figure 8.4: Ensemble Node
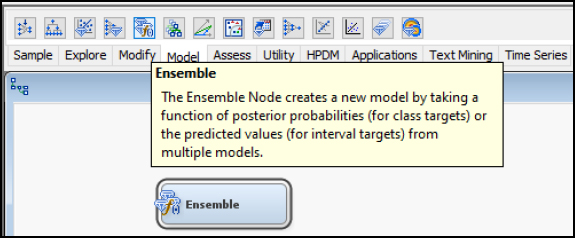
Ensemble Model Description
The Ensemble model combines several models into one model. The Ensemble model determines the target variables based on the average of the individual models. For interval targets, an average would be used. For categorical targets, a voting method where the most common class would be used. Each model can also be given different weights for the final prediction. Combining predictions from multiple models can improve accuracy. In neural networks, each model and algorithm can produce different outputs, based on the random weights and model parameters. Averaging these neural network models can improve results (SAS, 2018b).
Now that we have covered the neural network model often used in conjunction with an Ensemble model, let’s continue with an experiential learning application to connect your knowledge of neural networks with a health application on fraud detection.
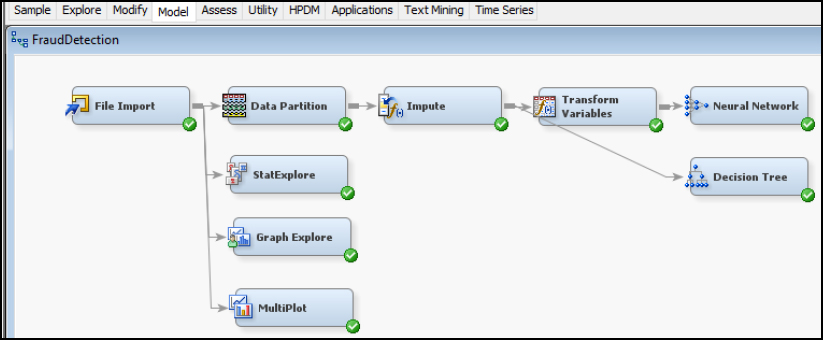
For our experiential learning application, let’s consider the example where we want to study the detection of fraud (Liou et al., 2008). To start our process, we first want to review our file to identify our input and target variables. After reviewing, both our input variables are continuous interval variables and our target variable Fraudulent Hospital is binary.
Data Set File: 8_EL1_Fraud_Detection.xlsx
Variables:
● HospitalID
● AverageDaysOfDrugDispense
● AverageDrugCost
● AverageConsultationAndTreatmentFees
● AverageDiagnosisFees
● AverageDispensingServiceFees
● AverageMedicalExpenditures
● AverageAmountClaimed
● AverageDrugCostPerDay
● AverageMedicalExpenditurePerDay
● FraudulentHospital
Step 1: Sign in to SAS OnDemand for Academics.
Step 2. Open SAS Enterprise Miner Application (Click the SAS Enterprise Miner link).
Step 3. Create a New Enterprise Miner Project (Click New Project).
Step 4: Use the default SAS Server, and click Next.
Step 5: Add a project name, and click Next.
Figure 8.5 Create New Project

Step 6: SAS will automatically select your user folder directory (If you are using the desktop version, choose your folder directory), and click Next.
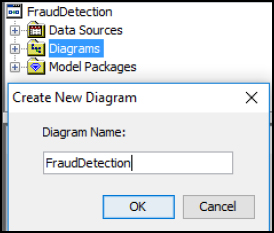
Step 7: Create a New Diagram (Right-click Diagram).
Figure 8.6 Create New Diagram and Add Name
Step 8: Add a File Import node (Click the Sample tab, and drag the node onto the diagram workspace).
Step 9: Click the File Import node, and review the property panel on the bottom left of the screen.
Step 10: Click Import File and navigate to the 8_EL1_Fraud_Detection.xlsx Excel file.
Figure 8.7 File Import
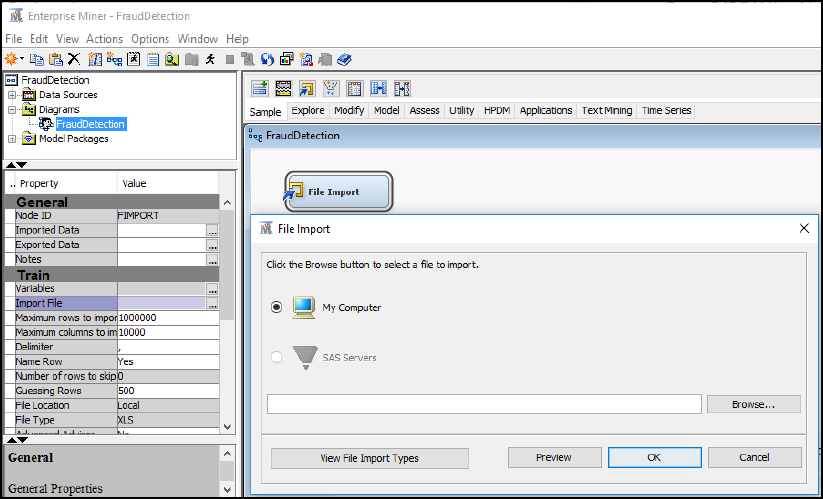
Step 11: Click Preview to ensure that the data set was selected successfully, and click OK.
Step 12: Right-click the File Import node and click Edit Variables.
Step 13: Set Fraudulent_Hospital to the Target variable role, set Hospital_ID to the ID role, and all other variables to the Input role. Explore and set the remaining variables according to their nominal, interval, or binary levels. To review an individual variable in order to verify its role and level assignment, click the variable name and click Explore. After you have finished setting all the variables, click OK.
Figure 8.8 Edit Variables

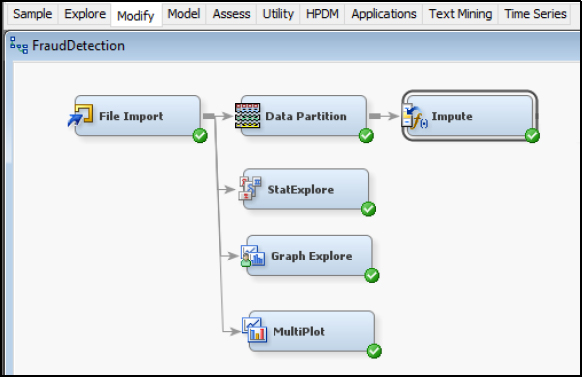
Step 14: Add a Data Partition node (Click the Sample tab, and drag the node onto the diagram workspace). Set the Data Partition Property Data Set Allocations to 60.0 for Training, 40.0 for Validation, and 0.0 for Test. Review the data Partition Results.
Figure 8.9 Data Partition Node

Step 15: Add a Stat Explore node, Graph Explore node, and MultiPlot node (Click the Explore tab, and drag the nodes onto the diagram workspace). Set the Graph Explore Property Sample Size to Max.
Figure 8.10 StatExplore, Graph Explore, and MultiPlot Nodes

Step 16: Review the results. From the StatExplore results, we find that there is a total of 1267 records, with no missing data across variables, and initial indication of good data quality. The 1 (or True) cases for the FradulentHospital variable total 113 records (or 8.9%) of the data set. The skewness and kurtosis for all variables is within acceptable ranges of -2 to 2, indicating an absence of extreme outlier values. Since neural networks might be affected by missing or outlier values, we still want to add Impute and Transform nodes to our final model diagram as a best practice, since future unknown data sets might contain these issues and we want to reuse the same model.
Figure 8.11 StatExplore Results

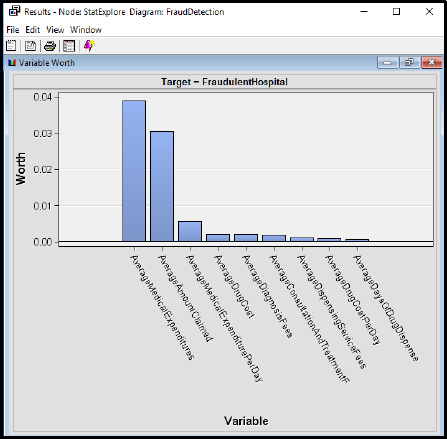
Step 17: Review the results. From the StatExplore results, we find that the top three variables with a target of FraudlentHospital include AverageMedicalExpenditures, AverageAmountClaimed, and AverageMedicalExpenditurePerday. The variable worth can also help develop a parsimonious model (or the simplest-best model) by including only a few variables in the final data set and model, which would improve performance of the model with similar accuracy.
Figure 8.12 StatExplore Results
Step 18: Review the results. From the Graph Explore results, there are 113 cases with 1 (or True), and 1154 cases with 0 (or False).
Figure 8.13 Graph Explore Results

Step 19: Review the results. From the MultiPlot results, review the different variables. For AverageMedicalExpenditures by FradulentHosptial, we find a greater distribution of 1 (or True) cases as the AverageMedicalExpenditures amount increases.
Figure 8.14 MultiPlot Results

Step 20: Add an Impute node (Click the Modify tab, and drag the node onto the diagram workspace). Verify that the Impute Property is set to Count for Class variables and Mean for Interval variables. Although no missing data was identified within this data set, as a best practice, include the Impute node as future data sets used for this model might contain missing data.
Figure 8.15 Impute Node
Step 21: Add a Transform Variables node (Click the Modify tab, and drag the node onto the diagram workspace). Right-click Transform Variables and click Edit Variables.
Figure 8.16 Transform Node

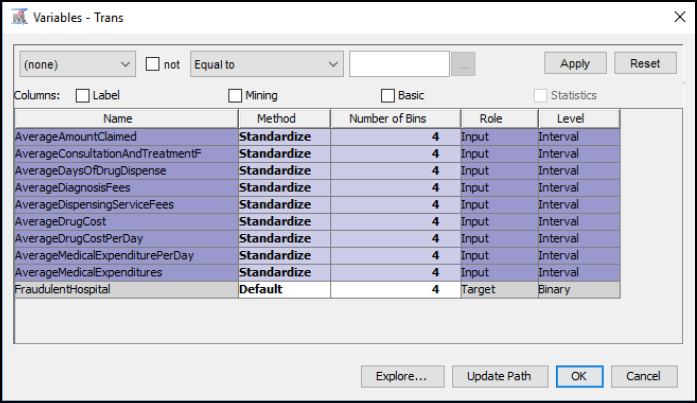
Step 22: Set the Transform Variables. Since neural networks are susceptible to outliers (or non-standardized variables), we want to standardize our data set using the Transform Variables node. Set all the Input Role records to Method Standardize. You can highlight multiple records by clicking the Name and holding the Shift key, and then change the Method all at once. By standardizing the data, we are using the same scale for all the variables, which is useful when applying the weights and training the neural network. For example, our variables contain both Days variables and Dollars variables. Days might range from 1-365, whereas Dollars might range from $1 - $1 million. Since these variables have varying ranges, we want to standardize all variables to be within a similar range and avoid one variable influencing the model results.
Figure 8.17 Transform Node Standardize
Step 23: Review the Transform Variables Results. From the results, we now have a second set of variables created with a Method of Computed, and these variables are also prefixed with STD_for standardized. The range (or minimum and maximum) is significantly reduced between variables, and all variables now have a standard deviation of 1.
Figure 8.18 Transform Node Standardize Results

Step 24: Add a Neural Network node (Click the Model tool tab, and drag the node onto the diagram workspace).
Figure 8.19 Neural Network Node

Step 25: Right-click the Neural Network node and click Edit Variables. Note that the standard deviation variables are prefixed with the STD_ and are used for the model by default. Click OK.
Figure 8.20 Neural Network Node Variables

Step 26: Right-click the Neural Network node and click Run.
Step 27: Expand the Output Window Results.
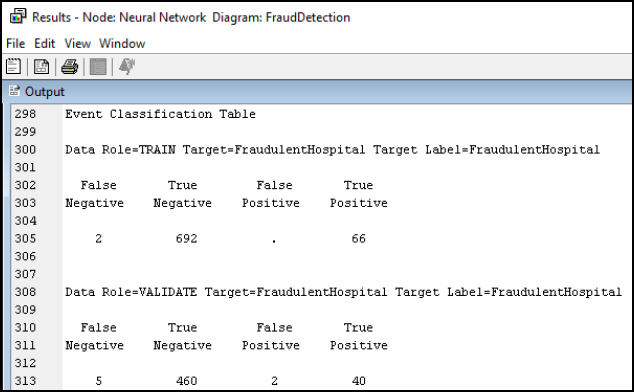
Step 28: Review the Model Results. Since the target variable of FradulentHospital is binary (0/1), the results are presented within an Event Classification Table. The Event Classification Table shows the overall model performance. When validating the model, note that we received 5 False Negatives, 460 True Negatives, 2 False Positives, and 40 True Positives. To calculate the error rate, we add the False Negatives and False Positives and divide by the total number: (5 + 2) / (5 + 460 + 2 + 40) = 7/507 = 1.38% error rate.
Figure 8.21 Event Classification Table
Step 29: Review the Fit Statistics Results. The Fit Statistics output window can be used for various error rate comparisons, including our misclassification rate from the event classification matrix. Notice that in the last entry on Misclassification Rate, 7 records were incorrectly classified, and the result matches the calculation above at 1.38% for Validation.
Figure 8.22 Fit Statistics

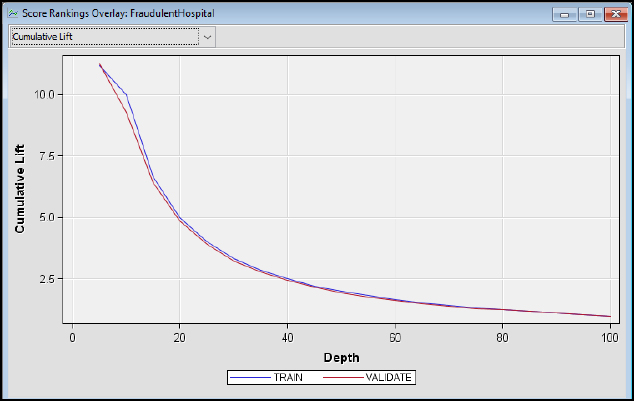
Step 30: Review the Model Results. The cumulative lift shows that the model outperforms a random model. At the top 10% of records (or depth), the train model outperforms a random model by nearly ten times, and at the top 20% of records, the train model outperforms a random model by nearly five times.
Figure 8.23 Cumulative Lift
Step 31: Add a Decision Tree node. From the previous chapter, we can also include a Decision Tree model for our data set. The Decision Tree can be connected directly to the Impute node since the model is not affected by non-standardized variables, and the Decision Tree splits allows easier interpretation based on the actual values. Run the Decision Tree node.
Figure 8.24 Decision Tree Node
Step 32: Review the Model Results. The Decision Tree main branch (or first split) is Average Medical Expenditures, with a split value of 856.5, splitting to the left (or right) branches. The next branch split is Average Amount Claimed, and following the left branch Average Medical Expenditures and Average Diagnosis Fees to complete the final leaf at Node Id 19. The output could also be used to develop the set of English Rules to program potential fraud detection based on the model splits and parameters.
Figure 8.25 Decision Tree Results

Step 33: Review the Model Results. From the fit statistics, the decision tree has a higher misclassification rate for the validation set at 4.44% versus 1.38% for the neural network. There are often tradeoffs between the models in terms of performance, interpretability, and error rates.
Figure 8.26 Decision Tree Results Fit Statistics

Step 34: Add three additional Neural Network nodes for a total of four. Rename the four Neural Network Nodes to Neural Network 3, Neural Network 10, Neural Network 25, and Neural Network 50. The names reflect the number of hidden nodes for each. Adjust the hidden nodes by clicking on each node, and then click Network on the property panel. Update the hidden units to 3, 10, 25, and 50, respectively, to match the naming for each node.
Figure 8.27 Neural Network Nodes - Hidden Units

Step 35: Add an Ensemble node. The Ensemble node will compare the 3, 10, 25, and 50 hidden unit neural network models and decision tree model to determine the best result.
Figure 8.28 Ensemble Node

Step 37: Update the Ensemble node properties to use a Voting function when determining the class target. For this application, the Ensemble model will use the votes from each of the models to determine the fraud classification of yes or no.
Figure 8.28 Ensemble Node Properties

Step 37: Review the Model Results for the Ensemble node, each of the Neural Network nodes, and the Decision Tree Node to compare the results. Specifically, from the fit statistics, review the misclassification rate for the validation set for each model. With the Ensemble node, we can run several neural network models with our hidden unit adjustments and decision tree models to improve accuracy and reduce variance (Maldonado et al., 2014). For this data set, the Neural Network 10 is the parsimonious (or simplest-best) model from the fit statistics misclassification rate. With considerations for future use, although the Neural Network 10 model and Ensemble model perform similarly when comparing misclassification rates, the Ensemble model might prove more accurate and robust when applying the model to a new data set and could be tested further. The evidence of reduced variability can be seen from the sum of squared errors (SSE), with the Ensemble model reporting the lowest SSE, which is the difference between the predicted and actual values. There are often tradeoffs between the models in terms of performance, interpretability, and error rates when deploying the final model.
Table 8.1: Model Results
|
Model |
Validation Misclassification Rate |
Validation Sum of Squared Errors (SSE) |
|
Neural Network 3 |
1.38% |
13.94 |
|
Neural Network 10 |
0.79% |
8.31 |
|
Neural Network 25 |
2.17% |
16.86 |
|
Neural Network 50 |
1.97% |
13.93 |
|
Decision Tree |
4.34% |
39.25 |
|
Ensemble |
0.79% |
7.35 |
In summary, the neural network will take the form of 1 or more inputs and 1 target variable. The inputs can be interval, binary, or nominal. The target can also be interval, binary, or nominal. To evaluate the neural network, we can use error, lift, and misclassification rate for a binary, nominal or categorical target variable. We can also use the Ensemble model node to combine several neural network models into a final model to improve accuracy.
● Model: Neural Network node
● Neural Network: 1+ input and 1 target variable
● Input: Interval, Binary, or Nominal
● Target: Interval, Binary, or Nominal
● Evaluation: Error, Lift, Misclassification Rate
Hospital readmissions are one of the most common measures of quality, and a common measure is if the patient is readmitted to the hospital within 30 days. Readmissions are an international healthcare issue, causing a strain on healthcare systems and leading to shortages of hospital beds. Patients with ongoing readmissions often experience psychological stress and financial hardships (Low et al., 2015).
Underlying risk factors for readmissions vary and have been found to be based on factors including age, race, provider of care, socio-economic status, surgery, co-morbidities, length of stay, previous admissions, and medications (Robinson and Hudali, 2017). A high readmission rate might indicate that the underlying conditions were not treated properly or the patient was discharged from the hospital early to save costs. In an effort to address readmissions, as part of the ACA, the Hospital Readmissions Reduction Program was also enacted, which as a CMS requirement, reduces payments between 1-3% for hospitals with excessive readmissions. As a result, hospitals must be able to identify those patients with a high risk of readmission both from a quality of care and financial standpoint (CMS, 2016c; Kulkarni et al, 2016). For the 2017 fiscal year, CMS has withheld over $500 million in Medicare reimbursements as part of the program, an increase from the previous year. A total of nearly 2,600 hospitals received a penalty at an average reduction of 0.73%, with 49 hospitals receiving the maximum 3% penalty (Punk, 2016; Murphy, 2016). Even with the many patient factors available for detection of readmission, healthcare providers often have poor predictive accuracy for patients at risk for readmission. Methods have been developed to help providers with identifying at risk patients; two of these tools are the HOSPITAL score and the LACE index (Robinson and Hudali, 2017).
The HOSPITAL score method uses seven components to identify high risk patients (Donze, et al., 2017).
● H - Hemoglobin level before discharge, a protein in red blood cells
● O - Oncology or cancer service discharge
● S - Sodium level before discharge, a mineral in blood
● P - Procedure performed during hospitalization
● I T - Index admission Type, such as emergency or elective
● A - Admissions in previous year
● L - Length of stay
The LACE index is a method recommended by the Institute of Health Improvement, which has moderate to high predictive value in identifying patients at risk for readmission. Although LACE method tools vary, four components are included to calculate the overall risk (low, moderate, high) of readmission (Besler, 2018).
● L - Length of stay (LOS) for initial admission, such as 1 day or 7+ days
● A - Acuity of admission, such as emergency or elective admission
● C - Co-morbidities, such as previous heart disease or diabetes
● E - Emergency department visits within the last six months, such as 0 or 4+
A 2017 study compared HOSPITAL to LACE as a method to predict 30-day hospital readmissions, and found that the HOSPITAL score outperformed LACE at a single hospital facility. Similarly, studies in Denmark and Switzerland found the HOSPITAL score to have better predictive performance. In contrast, larger nationwide Medicare studies in the U.S. have found no significant differences between HOSPITAL and LACE (Robinson and Hudali, 2017).
In one research study, authors used techniques to determine whether a patient would be readmitted to the hospital within 30 days of being discharged. The authors used a combination of model approaches (including neural networks, logistic regression, and decision tree) to find the best discriminating power and accuracy when using validation cases after training. The authors reviewed several factors for determining readmission, including the medical conditions, length of the hospital visit, care rendered during the stay, size of the medical facility, type of medical insurance, and discharge environment (Kulkarni et al, 2016; CMS, 2016c).
For this experiential learning application, you have been provided a data set of 112,749 records. Help your management team with the following objective.
Objective: develop a model for detecting hospital readmissions
Data Set File: 8_EL2_Readmissions.xlsx
Variables:
● RecordID, unique identifier
● DischargeDisposition, Discharge Setting of Hospital, Skilled Nursing Facility (SNF), Rehab, Other, Home
● Cohort, Cardiorespiratory, Cardiovascular, Medicine, Neurology, Surgery
● FacilitySize, Hospital size by number of beds
● InsuranceType, Managed Care, Medicare, Medicaid, Self-Pay, Workers Compensation, or Other
● Age, in years
● ICDCounts, count of diagnosis codes
● LengthOfStay, in days between admission and discharge
● Readmission, 1 indicator if patient was readmitted
Follow the SEMMA process for your experiential learning application and provide recommendations. A template has been provided below that can be reused across future projects.
Figure 8.30 SEMMA Process
|
Title |
Hospital Readmissions |
|
Introduction |
Provide a summary of the business problem or opportunity and the key objective(s) or goal(s). Create a new SAS Enterprise Miner project. Create a new Diagram. |
|
Sample |
Data (sources for exploration and model insights) Identify the variables data types, the input and target variable during exploration. Add a FILE IMPORT Provide a results overview following file import: Input / Target Variables Generate a DATA PARTITION |
|
Exploration
|
Provide a results overview following data exploration Add a STAT EXPLORE Add a GRAPH EXPLORE Add a MULTIPLOT Summary statistics (average, standard deviation, min, max, and so on.) Descriptive Statistics Missing Data Outliers |
|
Modify |
Provide a results overview following modification Add an IMPUTE Add a TRANSFORM VARIABLES |
|
Model
|
Discovery (prototype and test analytical models) Apply a neural network model and provide a results overview following modeling. Add a NEURAL NETWORK with 3, 10, 25, and 50 hidden units Model description Add an ENSEMBLE MODEL Model description Analytics steps Model results (Lift, Error, Misclassification Rate) Selection Model |
|
Assess and Reflection |
Provide overall recommendations to business Model advantages / disadvantages Performance evaluation Model recommendation Summary analytics recommendations Summary informatics recommendations Summary business recommendations Summary clinical recommendations Deployment (operationalization plan: timeline, resources, scope, phases, project plan) Value (return on investment, healthcare outcomes) |
Review, reflect, and retrieve the following key chapter topics only from memory and add them to your learning journal. For each topic, list a one sentence description/definition. Connect these ideas to something you might already know from your experience, other coursework, or a current event. This follows our three-phase learning approach of 1) Capture, 2) Communicate, and 3) Connect. After completing, verify your results against your learning journal and update as needed..
|
Figure 8.Key Ideas – Capture |
Key Terms – Communicate |
Key Areas - Connect |
|
Government Anamatics |
|
|
|
Government Legislation |
|
|
|
HIPAA |
|
|
|
ARRA |
|
|
|
ACA |
|
|
|
AHCA |
|
|
|
BCRA |
|
|
|
Government Agencies |
|
|
|
Government Data Sharing |
|
|
|
Fraud and Abuse Interventions |
|
|
|
Neural Network |
|
|
|
Fraud Detection Application |
|
|
|
Readmissions Risk Application |
|
|