Chapter 4: Discovering Health Data Quality
Experiential Learning Activity: Healthcare Data Quality Check
Healthcare Data Quality Case Study
Experiential Learning Activity: Public Data Exploration
Data Exploration – Data Discovery and Descriptive Statistics
Explore Tab Enterprise Miner Node Descriptions
Experiential Learning Activity: Health Data Surveillance
Modify Tab Enterprise Miner Node Descriptions
Experiential Learning Application: Heart Attack Payment Data
Heart Attack Payment – Missing Data
Experiential Learning Application: Data Quality Exploration
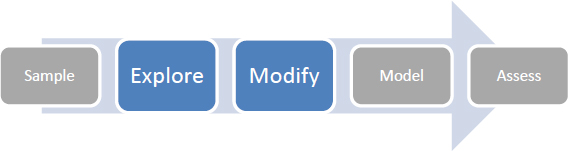
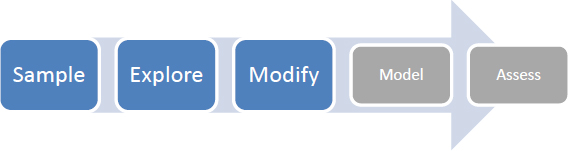
The purpose of this chapter is to review data quality and develop data discovery skills using SAS Enterprise Miner with regard to the Explore and Modify capabilities within the SEMMA process. This chapter also includes experiential learning application exercises on heart attack payment data and data quality exploration. We continue this chapter with the Explore and Modify phase as shown in Figure 4.1.
Figure 4.1: Chapter Focus - Explore and Modify
● Understand healthcare quality
● Describe data quality
● Define the Explore and Modify process steps
● Develop data exploration skills
● Apply SAS Enterprise Miner Explore and Modify data functions
Medical errors are the third leading cause of death among patients, and adverse events occur in up to one-third of all admissions, with only 1 of 2 patients receiving recommended treatment (Makary and Daniel, 2016). The Centers for Disease Control and Prevention (CDC) generate an annual list of the causes of death in the U.S. However, these causes are associated with an International Classification Disease (ICD) code, which does not include human-related or system-related causes such as communication errors, diagnostic errors, judgment errors, and skill errors. John Hopkins researchers have estimated over 250,000 deaths occur annually in the U.S. due to medical errors (Makary and Daniel, 2016).
Due to the concerns over medical errors, various entities (business groups, insurance organizations, state legislatures, health policy groups, and the U.S. Congress) have focused on improving healthcare quality within the U.S. for several decades. Congress passed the Healthcare Research and Quality Act of 1999, requiring a national quality report to be established. The Agency for Healthcare Research and Quality (AHRQ) identifies two key public challenges: improving quality of healthcare, and ensuring that no one is left behind in quality improvement. As part of AHRQ, required annual congressional reports are used to examine healthcare system quality and disparities through key measures. The reports identify several improvement areas such as recommended cancer screenings, nutrition counseling, environment changes to improve asthma-related conditions, and recommended diabetes screenings. Overall, access and quality of care is often determined based on racial, ethnic, or economic grouping. AHRQ has turned to more advanced information systems capabilities through web-based tools and improved data, graphing, and reporting. These capabilities increase access to and insights into quality trends. The state snapshots functionality allows graphical dashboard comparison of measures and helps identify quality improvement areas (Brady et al., 2007; Naidu, 2009; Weaver and Hongsermeier, 2004).
The Institute of Medicine (IOM) released the “Crossing the Quality Chasm” report in which six aims of a high-quality healthcare system are identified. The report states that quality healthcare systems should be: 1) safe, 2) effective, 3) patient-centered, 4) timely, 5) efficient, and 6) equitable. The National Health Services (NHS) in the U.K. similarly has focused on quality since 1998, with the one distinction from the U.S. being that the government is the purchaser of healthcare services. In the U.K., those with economic means can go outside the public healthcare system to receive care, defying the equitable aspect of quality care. Similarly, the six key areas for U.K.'s NHS include health improvement, fair access, effective delivery, efficiency, patient and caregiver experience, and health outcomes (Weaver and Hongsermeier, 2004).
Despite the charge and activities toward quality, leaders still struggle to determine which data to measure for quality purposes, which quality framework to use, and the amount of resources and technology to implement quality initiatives. Resistance to mandatory reporting and adoption of standardized safety practices have occurred due to medical and legal concerns. In the U.S., healthcare services are often not purchased based on quality (Weaver and Hongsermeier, 2004). Variability in healthcare throughout the world is well-known, resulting in differences in health outcomes. A further challenge is translating and developing worldwide evidence for local applications. Assessment and improvement of healthcare quality is a key example of evidence-based methodologies. These methods and metrics are used by the National Committee for Quality Assurance (NCQA), the Joint Commission on Accreditation of Healthcare Organizations (JCAHO), and similar accrediting organizations. The information (or evidence) along with experts are used. However, in many clinical areas, such as mental health, the evidence is underdeveloped. Quality of healthcare delivery and rapid, measurable, and sustainable improvements are a high priority for health systems. Like quality in most services, healthcare quality is difficult to measure because of inherent intangibility, heterogeneity, and inseparability features. Quality in healthcare is often more challenging to determine than in financial or aviation industries because the output is individually perceived quality of life. Successful quality improvement has been demonstrated at a state and national level. However, most measures of quality are improving at only a modest pace, with a 3.1% improvement rate over the last three years (Clancy et al, 2005; Woodside, 2014).
Beyond direct patient care, quality of services can be linked to financial and competitive improvements. In the healthcare industry, quality perceptions from medical patients have been found to account for up to 27% of financial variances in earnings, revenue, and asset returns. In addition, negative word of mouth, advertising can cost upward of $400,000 in revenue loss throughout a patient’s lifetime (Naidu, 2009). Third-party groups (such as the Joint Commission on the Accreditation of Health Care Organizations (JCAHO) for hospitals, the Agency for Healthcare Research and Quality (AHRQ), National Committee for Quality Assurance (NCQA), Health Employer Data Information Set (HEDIS), and the National Quality Forum) develop outcomes against a set of benchmarks. The use of benchmarks is a Six Sigma method to easily compare performance and improve continuously (Weaver and Hongsermeier, 2004). Outcomes measurement is the assessment of population health through process and outcome measures. The Institute of Medicine (IOM) has identified healthcare quality as the degree to which desired health outcomes (such as improvement in health and patient experiences) are achieved (Woodside, 2013c).
Quality improvement approaches have been adopted within the healthcare industry in an attempt to improve quality of care. Most of the activities to date have focused on manual activities without a direct link to the data within the healthcare information system. Support systems can provide patient outcome information and clinical pathways to assist patient care, and identify factors that influence quality and treatment. Data mining, which allows for knowledge discovery from large sets of data, can be used to identify patterns or rules to improve healthcare quality. Patient characteristics (including age, gender, department, disease class, and quality indicators) were used as part of decision tree analysis to determine in-patient quality factors. An index score can be developed to identify how quality rates compare to overall proportions, and which segments to focus on (Chae 2003).
Quality improvement proponents have recommended a healthcare quality information system (HQIS) to accurately measure and manage healthcare quality information collection, analysis, and reporting. Outcomes and treatment-cost improvements exist, and the public is seeking more information about healthcare quality in order to make informed decisions. To ensure successful HQIS, hardware, software, and a complete information framework of standard data fields and processes must be developed. A patient-centered data structure is often implemented, linked by a patient ID, and used to manage quality of care. Quality typically includes both a technical dimension and a functional dimension. Patients might be unable to accurately determine technical quality, and, typically, functional quality is used as the primary method. Despite much literature on healthcare quality, few tools exist for assessing and managing quality. Within the healthcare services review sector, direct patient care is affected, and key components of quality are supported through anamatics capabilities. Information quality is vital as for organizations to reduce uncertainty and enhance their decision-making capabilities. System quality is addressed through information processing needs or the supported communication requirements that are based on individual and unit interactions as well as system support for information processing capability through use of technologies. Service quality can also be described through information processing capability through the information technology support that is given to end users to assist with performance outcomes (Woodside, 2014).
The Affordable Care Act (ACA) has several components that are targeted toward improving quality in healthcare. High-quality healthcare requires technology tools and systems to realize the ACA goals and objectives (Woodside, 2014). As a result of legislation and healthcare quality focus, the Health and Human Services (HHS) Secretary announced a move from traditional fee-for-service payments to quality or value-based payments. HHS set a goal of 50% of alternative payment models, such as Accountable Care Organizations (ACOs), by the end of 2018 and 90% of Medicare payments to quality models. In a fee-for-service model, each service provided is reimbursed a fixed fee. An ACO is a group of providers, such as physicians or hospitals, that provide coordinated quality care to a group of patients. The ACO model for providers aims to deliver higher quality care while reducing costs through eliminating duplicated or unnecessary services (HHS, 2015).
As part of the American Recovery and Reinvestment Act of 2009 (Recovery Act), the Centers for Medicare and Medicaid Services (CMS) have awarded incentive payments for “Meaningful Use” through an electronic health record (EHR) to improve quality, safety, efficiency, outcomes, research, and efficiency. Meaningful use sets objectives, comprehensive guidelines, and core objectives that eligible providers and hospitals must follow to be qualified for the CMS incentive programs. In stage 1, all medications should be entered by a computerized physician order entry (CPOE) system, and a drug-to-drug and drug-to-allergy interaction check should be implemented within the system. In addition to quality checks, the guidelines also include minimum data capture for completeness. For example, the following vital signs are required to be recorded and charted: height, weight, blood pressure, BMI, and a plot of children growth charts for ages 2-20, including BMI. A summary of the three stages of meaningful use, timeline, and key components are included in Figure 4.2. It should be noted that stage 2 (which was originally scheduled for completion in 2014) was extended to 2016. Stage 3 (which was originally scheduled for completion in 2016) was extended to begin with an option for 2017 for providers with two years completed under stage 2, based on recommendations from industry (Reider and Tagalicod, 2013; HealthIT.gov, 2017a; HealthIT.gov, 2017b; CMS, 2017a).
Figure 4.2: Meaningful Use

The impact of healthcare efficiency and effectiveness is evident from an estimated $300 billion in annual value created through improved use of analytics by McKinsey Global Institute. IBM estimates a mid-size health plan can improve annual economic benefit by over $600 million if using all available anamatics (information technology and analytics available). The overall goals of value across all industries including healthcare is to simultaneously increase revenue and reduce costs. In healthcare, cost reduction can be generated through operational efficiencies, and revenue can be increased through improving clinical outcomes and engaging patients in healthcare (McNeil, 2015). As one example, HealthGrid was awarded the Microsoft Innovation award for their solutions. Their intelligent technology allows providers and patients to improve information sharing for decision-making, which is a key component of the Meaningful Use goals across all stages. HealthGrid enabled Family Physician Group (FPG) to shift to value-based care and meet Meaningful Use guidelines, resulting in additional appointments per provider, which is a significant reduction in clinical care gaps, and improved care plan compliance. HealthGrid and FPG estimate a 9:1 return on investment (HealthGrid, 2017).
Today, healthcare organizations are becoming increasingly computerized, thereby capturing increasing amounts of data in various places. Extracting, formatting, analyzing, and presenting this data can improve quality, safety, and efficiency of delivery within a healthcare system. With the growth of healthcare data, one of the commonly overlooked traits of data in healthcare deals with the veracity or the quality of the data, leading to significant numbers of preventable medical errors and limited application of recommended care guidelines. In order to ensure the healthcare quality dimension and appropriate evidence-based care, the underlying data sources must be of high quality to realize the full value. Healthcare information systems and technology allows the capture of data, analysis, and use of decision support capabilities (Weaver and Hongsermeier, 2004). Analytics applied to poor data can lead to faulty decisions. This is the concept of garbage in garbage out (GIGO). Analytics can also be used to detect and correct data errors (Simpao et al, 2014), which we will use throughout this chapter to Explore and improve overall data quality in order to lead to quality decision-making. In an IBM report, one in three business leaders do not trust the information to make decisions. Poor data quality costs the U.S. an estimated $3.1 trillion a year (Woodside 2014; IBM, 2014). Data quality can be described as accurate, complete, consistent, legible, relevant, timely, and unique. These attributes ensure high quality data and information (HIQA, 2012; Baltzan, 2015). The following table lists the healthcare data quality attributes, descriptions, and examples of common data quality errors and issues.
Table 4.1: Healthcare Data Quality Attributes
|
Healthcare Data Quality Attribute |
Description |
Data Error/Issue Example |
|
Accurate |
All data values are correct. |
A patient’s year of birth is set as 1957 instead of 1975. |
|
Complete |
All data values are fully populated. |
A secondary diagnosis code is missing. |
|
Consistent |
All data values follow standards. |
Some diagnosis codes use the ICD-9 rather than the ICD-10 standard. |
|
Legible |
All data values are readable |
Notes are written in erasable ink and smeared. |
|
Relevant |
All data pertains to the decision. |
A report is developed by providers outside of your service area. |
|
Timely |
All data values are up-to-date. |
The latest patient allergies are included in their record. |
|
Unique |
All data values are not duplicated. |
A claim is billed twice for the same service. |
|
Healthcare Data Quality Check |
||||||||||||||||||||||||||||||||
|
Description: Identify the healthcare data quality attributes in the claims data below and provide a recommendation where a computerized method can be used to improve the quality:
|
||||||||||||||||||||||||||||||||
|
Health informatics initiatives increasingly require quality impact as the basis for justification and value. As healthcare organizations seek to continually improve overall quality outcomes and adopt new capabilities, health informatics plays a critical role in providing such capabilities as well as streamlined access to summarized information for decision-making support. Clinical Decision Support Systems (CDSS) are implemented in order to improve patient safety and quality of care. CDSS often suffer from the quality of the underlying data. Sweden is viewed as an early adopter of many healthcare information technology systems and has an EHR hospital adoption rate of 100%, with one computer per employee on average. Despite this, EHR systems might not be fully used within the emergency care setting due to user resistance and usability factors. A study was performed on vital-sign data quality within a set of Swedish emergency departments to determine the factors influencing data quality. Summary factors included people and process components, and information technology components. Only half of the emergency departments had a fully electronic vital-sign documentation process, and documentation was found to lack currency and completeness. To improve data quality, a five-step approach was followed: 1) Standardize the care process -- the aim was to improve completeness of records and establish a process to re-check and document vital signs every 15-30 minutes on identified patients to improve currency. 2) Improve digital documentation -- EHRs were identified to make better use of documentation and integrate the systems to improve complete and current vital signs. 3) Provide workflow support -- Mobile solutions were developed for the EHR to improve usefulness and portability of paper-based methods, which also improved completeness and currency. 4) Ensure interoperability -- EHR systems improved the exchange of vital signs. Previous versions had different keywords and templates without standardized data reference models. 5) Perform quality control -- ongoing management feedback on quality was important to improve completeness and training through staff review of data quality and error sources (Skyttberg et al., 2016).
Six Sigma is used across various industries and thousands of organizations as a method to improve and set the highest standards for quality. Six Sigma uses a data-driven methodology to identify and eliminate defects or errors and improve to six standard deviations of the mean using a statistical basis. From statistics, two standard deviations from the mean would incorporate approximately 67% of all cases. Three standard deviations would incorporate 95% of all cases, and six standard deviations would incorporate 99.9997% of all cases. To successfully achieve Six Sigma quality standards, organizations must achieve six standard deviations of the mean, incurring no more than 3.4 defects or errors per million opportunities. A defect or error is any instance that does not meet a customer’s expectations. To begin a Six Sigma project, one can follow a DMAIC process (Define, Measure, Analyze, Improve, and Control). Organizations that are committed to Six Sigma use teams to work on problems, have management support for Six Sigma quality across the organization, and have individuals trained in statistical data thinking (ASQ, 2016; iSixSigma, 2018). In one case study, the data quality within the Dutch National Intensive Care Evaluation (NICE) registry was reviewed. Results showed that 4.0% of data was incomplete and 1.7% was inaccurate for automatic data collection, and 3.3% was incomplete and 4.8% was inaccurate for manual data collection. As with other studies, this would put the error rate and quality between 3 and 4 sigma, again with an end goal of 6 sigma, or 3.4 defects per million opportunities (Arts et al., 2016).
Previous studies have focused primarily on patient outcomes as a measurement for healthcare quality. Although patient outcomes represent a core quality dimension, healthcare organizations must also contend with other, often conflicting, quality dimensions. The desire to meet shareholders return on investment expectations must be balanced with the desire to improve quality of care and outcomes for patients. In addition, neither quality of care nor quality of return can be fully realized without a deliberate effort to achieve quality in employee satisfaction. Health anamatics initiatives are increasingly requiring quality impact as the basis for justification and value. Healthcare data capabilities and processes enable individual organizations to focus specifically on those areas that have the greatest impact on the multi-faceted organizational quality. As healthcare organizations seek to continually improve overall quality outcomes and adopt new capabilities, health anamatics plays a critical role in providing such capabilities as well as streamlining access to summarized information for decision-making support. To achieve organizational quality, healthcare entities must balance the needs of various stakeholders. Financial returns must be weighed against quality of care provided to customers and training provided to employees. Within service sectors (such as healthcare), employee requirements, resulting interaction with customers, and impact on shareholder returns all must be considered with a greater degree. Other industries have experienced similar challenges in balancing stakeholder requirements (Woodside, 2013c).
Due to competitive markets and globalization, organizations must continually seek to add value to their services, deliver additional profits, and exceed customer expectations. Satisfied employees tend to be more involved and dedicated to quality. Presenting positive employees leads to a positive customer attitude toward a given product. Dissatisfied or hostile employees create hostile customers regardless of the organization’s tasks and service performance. Customer satisfaction has also been shown to have a long-term profit impact. Satisfied customers are more likely to purchase in greater quantity with greater frequency and add additional services. Satisfied customers are also more willing to pay premiums and are less-price sensitive than non-satisfied customers (Hurley 2007; Yee 2008). Within a given organization, there is often significant variability at a business unit level. In past studies, units that score above the median on employee and customer satisfaction measures were found to be 3.4 times more effective financially as measured by total revenue, performance targets, and year-over-year gain in sales and revenue. If the focus is on employees only, the business unit can be too inwardly focused. If the focus is on customers only, employee satisfaction will erode over time. Unchecked quality of the customer and employee experience can create issues. Often the variability goes unnoticed or unmanaged, and revenues and profits are bled off and growth is stagnant. In many organizations, the objective of achieving a unified corporate culture and brand goes unrealized. Performance must be continuously improved, and feedback given at the lowest level of variability and specificity (Fleming 2005; Woodside, 2013c).
While recognizing the need for quality, Total Quality Management (TQM) and other quality initiatives such as Six Sigma have often initially led to high levels of turnover within an organization. Organizations must find ways to continue to motivate and retain employees, with employee participation being a critical component to quality, and the associated personal enrichment, which goes along with direct involvement and decision-making. In an employee improvement process, individual transformation and understanding of knowledge will occur. The individuals will add new meaning to events and interactions. They will have a judgment and decision basis for organizational transformations, and they will assist others to move into similar practices and capabilities, leading to improved organizational quality (Connor, 1997, Woodside, 2013c).
Following our review on healthcare data quality, we will review data sources and exploration further for our experiential learning activity.
|
Public Data Exploration |
|
Description: There are many different types of public data sources available. These data sources include primary data sources and secondary data sources. Primary data sources are those that are collected directly from patients or providers. The primary data collection can occur through monitoring devices, tests, physician notes, forms, and surveys. Secondary data sources are those that are collected after patient or provider care, and are developed through collecting information from medical records, claims, government agencies, quality improvement reports, and study data. Visit a public data site and find a public data set, examples: ● General Health Data: https://healthdata.gov/ ● Florida Health Data: http://www.flhealthcharts.com?aspxerrorpath=/charts/default.aspx ● Vital Statistics Data: https://www.cdc.gov/nchs/data_access/ftp_data.htm ● Public Health Data: https://wonder.cdc.gov/ ● Core Data Elements: https://www.cdc.gov/nchs/data/ncvhs/nchvs94.pdf ● National Cancer Data: https://www.facs.org/quality-programs/cancer/ncdb/qualitytools ● Outcomes Reporting Data: https://www.cms.gov/Medicare/Quality-Initiatives-Patient-Assessment-Instruments/OASIS/DataSpecifications.html
|
|
Select a data set and describe the data set summary or specifications:
|
|
Identify key data elements in the data set, including the types of variables:
|
|
Identify any potential quality issues that can occur in the data set:
|
Now that we have covered healthcare data quality components, we can now begin our formal process to Explore and Modify the data using SAS Enterprise Miner.
Exploration Process Step Overview
During the exploration process step, the data is reviewed and described, and quality issues are identified.
Figure 4.3: Exploration Step

The first phase of the SEMMA process is sampling the data covered in the previous chapter. In the second phase of the SEMMA process, data exploration occurs. When exploring data, we typically start with describing the data. That is, we can run a set of descriptive statistics on the data (Anderson et al., 2002). Even if you are familiar with many of these measures already, a brief description is included as follows:
● Count: This is the total number of records or occurrences within a data set or population sample. For example, there can be a set of 100 patient records.
● Average: Also known as the mean, this measure provide a central point for the data set. To calculate the mean, you add all the occurrences and divide by the count of records. If three claims are billed at $100, $150, and $200, the average is ($100+$150+$200) / 3 = $150.
● Median: The median is similar to the average, being a measure of a central point for the data set. However, the median uses the middle of the data if it were arranged in order. The median might be a preferred measure over average if there are data values outside the typical values. If three claims are billed at $100, $150, and $14,700, the average would result in ($100+$150+$14,750) / 3 = $5,000. A median or midpoint would be the center or $150. This might be a more reasonable value despite the one outlier value. In cases where there are an even count of records, the average of the middle two records would be used for the median.
● Mode: The mode is the number that occurs most often in terms of count. If the claim billed amount of $150 appears 75 times out of 100 records, the mode would be $150.
● Minimum: The minimum represents the smallest data value for the variable in the data set. If three claims were billed at $100, $150, and $200, the minimum value would be $100.
● Maximum: The maximum represents the largest data value for the variable in the data set. If three claims were billed at $100, $150, and $200, the maximum value would be $200.
● Range: The range represents the smallest and largest data values for the variable in the data set. If three claims are billed at $100, $150, and $200, the range of values would be $100-$200.
● Variance: The variance represents a measure of the distance between the actual value and the average value for the data.
● Standard Deviation: The standard deviation represents a measure of the distance between the value and the average value for the data, using the variance, and is the square root of the variance. If three claims are billed at $100, $150, and $200, the standard deviation would be $50.
● Outliers: The outliers represent data values outside the norm. As a rule of thumb, any data values outside two standard deviations from the mean can be considered as outliers. In some cases, these might be valid and require secondary inspection. In other cases, these might be the result of data entry errors or miscoded data values. An outlier is a value that is typically several standard deviations outside the average or mean. In a population distribution, 67% of all records are within two standard deviations of the mean, 95% are within three standard deviations of the mean, and 99% are within four standard deviations.
● Skewness: Measures the symmetry of the distribution of the data set. If a data set is normally distributed, the skewness is zero. A typical range for skewness is -2 to 2. If we say that the data set is skewed left, there will be a negative value for skewness, and the left side tail is longer than the right side tail. If we say that the data set is skewed right, there will be a positive value for skewness, and the right side tail is longer than the left side tail (NIST/SEMATECH, 2017).
● Kurtosis: Measures the tail of the distribution, or the number of outliers as compared with a normal distribution. In other words, a high level of kurtosis indicates a higher level of outliers. Low kurtosis indicates an absence of outliers (NIST/SEMATECH, 2017).
Stat Explore Node
The Stat Explore node is used to display the descriptive statistics of a data set, including univariate, bivariate, and correlation.
Figure 4.4: Stat Explore Node
![]()
Graph Explore Node
The Graph Explore node is used for graphical or visualization of the data. The node can be used to create additional graphs such as pie charts, line charts, or box plots to detect outliers.
Figure 4.5: Graph Explore Node
![]()
Multiplot Node
The Multiplot node is used for graphical representation (or visualization) of the data to identify information, such as histogram distributions, to detect skewness and kurtosis. Histograms are an effective charting method for determining skewness and kurtosis or for identifying outliers.
Figure 4.6: MultiPlot Node
![]()
|
Health Data Surveillance |
|
Description: The CDC (Centers for Disease Control and Prevention) analyzes BRFSS (Behavioral Risk Factor Surveillance System) data for metropolitan and micropolitan statistical areas (MMSAs) to provide localized health information that can help public health practitioners identify local emerging health problems, plan and evaluate local responses, and efficiently allocate resources to specific needs. The BRFSS is a system established in1984 that collects information about U.S. residents through telephone surveys. Completing more than 400,000 surveys per year, the BRFSS is the largest continuously conducted health survey system (CDC, 2016a). From the BRFSS page, click Prevalence Data and Data Analysis Tools, and then click Prevalence and Trends Data. Review the page section on the right labeled Explore BRFSS Data by Topic. Explore the Data by Class and Topic -> Select a Class Category (for example, Cholesterol Awareness) and Topic Sub-Category (for example, Cholesterol High), Click GO. The chronic disease indicators (CDI) allows public health professionals and policy makers to access standard data for chronic diseases and risk factors in order to evaluate public health interventions. The CDI is a joint effort by the Centers for Disease Control (CDC) and state health departments to develop a standard set of health indicators. The CDI includes 124 indicators within 18 category groups: alcohol, arthritis, asthma, cancer, cardiovascular disease, chronic kidney disease, chronic obstructive pulmonary disease, diabetes, disability, immunization, mental health, nutrition, older adults, oral health, overarching conditions, reproductive health, school health, and tobacco. Explore the state data, describe the data, Explore the data in geographic, table, and graph format. Describe the data, and recommend an action plan for public health practitioners. |
|
List the category and factor that you are reviewing.
|
|
List the data variables included in the output.
|
|
Which states have the highest or lowest rates.
|
|
Provide a summary action plan recommendation for public health practitioners based on your findings above (priorities, locations, best practices, methods, and so on).
|
Modify Process Step Overview
During the third process step, data is modified after detecting any anomalies during the exploration process step. Often this step corresponds with correcting poor data quality. The data is updated to make the results more accurate, or the data is standardized to make the input more consistent. Although these functions and capabilities are available to correct data during the process, best practices would seek to have high levels of data quality in the original source data, thereby eliminating the requirement to further correct data during analysis. The stage in which data modification occurs can be important since model results may change based on the data updates during the modification stage. Because the source system data can also be used for a variety of purposes, such as patient-physician interaction, you would not want to wait until analysis to clean the data and ensure accuracy.
Figure 4.7: Modify Process Step

Impute Node
The Impute node is used to correct and replace missing values. The node would relate to the complete aspect of data quality. The missing values can be replaced using the mean or average of the values in the data set or the count. The count would be the item with the most frequency and would be used for the missing value.
Figure 4.8: Impute Node
![]()
Interactive Binning Node
The Interactive Binning node allows the creation of bins. For example, an age variable that is specified as an interval (such as 1,2,3,…100,) can be binned into sets of four age bins (or groups) such as 0-25, 26-50, 51-75, 76-100.
Figure 4.9: Interactive Binning Node
![]()
Replacement Node
The Replacement node is used to interactively replace missing values for both class and interval variables. The replacement node can be used to update either missing or non-missing data, such as outliers or miscoded data, before running an impute node for missing values.
Figure 4.10: Replacement Node
![]()
Transform Variables Node
The Transform node is used to generate new variables or Modify existing variables. Transform can be used to standardize variables to improve the overall model fit.
Figure 4.11: Transform Variable Node
![]()
Myocardial infarction, more commonly known as a heart attack, occurs when one of the arteries carrying oxygenated blood to the heart becomes blocked and the oxygen-starved heart tissue dies. In the U.S., over 70,000 people have a heart attack each year, with the majority as a first heart attack (CDC, 2017a; WebMD, 2017). About 20-25% of heart attacks occur without warning, others have preceding chest pain, shortness of breath, dizziness, faintness, or nausea. Men and women can also experience different symptoms or rates. Women are more likely to experience heart attack symptoms relating to indigestion, nausea, or fatigue (Davis, 2018). A study in Quebec, Canada, between 1981 and 2014, measured the quantity and duration of snowfall to calculate the relationship between snowfall and myocardial infarction. The results found that an increase in myocardial infarction was found after increased snowfall among men but not among women. The researchers concluded that men might be at greater risk due to their propensity to shoveling snow. In particular, after heavy and continuous snowfalls, shoveling snow is a demanding exercise, with risks increased due to cold temperatures that affect blood pressure and blood flow (Auger et al., 2017).
The state-level data includes payment measures for 30-day episode of care filtered for 2,429 heart attack patients (CMS, 2017b).
Data Set Files:
● 4_EL1_Heart_Attack_Payment_Data.xlsx
● 4_EL1_Heart_Attack_Payment_Missing_Data.xlsx
Variables:
● Provider ID
● Hospital Name
● Address
● City
● State
● ZIP code
● County Name
● Phone Number
● Measure Name
● Measure ID
● Compared to National
● AvgPayment
● Measure Start Date
● Measure End Date
Step 1: Sign in to SAS Solutions On Demand, or Open SAS Enterprise Miner Local Installation.
Step 2. Open the SAS Enterprise Miner Application (click the SAS Enterprise Miner link).
Step 3. Create a New Enterprise Miner Project (click New Project).
Step 4: Use the default SAS Server, and click Next.
Step 5: Add Project Name HeartAttackPayment, and click Next.
Step 6: SAS will automatically select your user folder directory that is using SAS Solutions On Demand and click Next. (If you are using a local installation version, choose your folder directory, and click Next.)
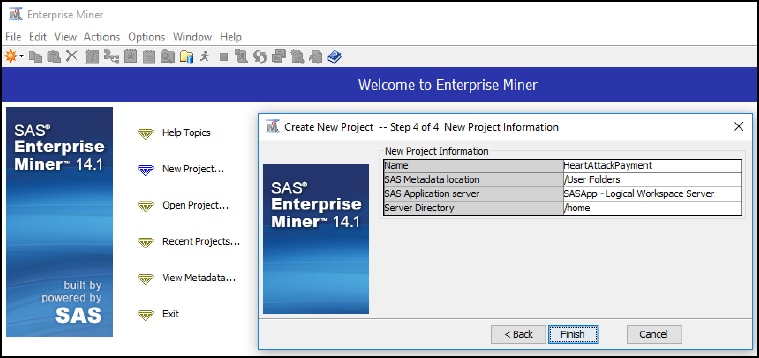
Step 7: Create a new diagram (Right-click Diagram).
Figure 4.12: Create New Diagram Step 1 of 2
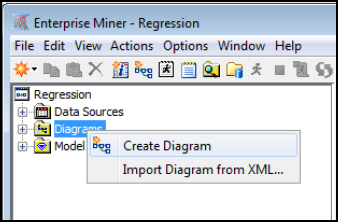
Figure 4.13: Create New Diagram Step 2 of 2

Step 8: Add a File Import node (Click the Sample tool tab, and drag the node into the diagram workspace).
Figure 4.14: Add a File Import Node

Step 9: Click the File Import node, and review the property panel on the bottom left of the screen.
Step 10: Click Import File … and navigate to the Chapter 4 Excel File 4_EL1_Heart_Attack_Payment_Data.xlsx.
Figure 4.15: Browse for File

Step 11: Click Preview to ensure that the data set was selected successfully, and click OK.
Step 12: Right-click the File Import node and click Edit Variables.
Figure 4.16: Edit Variables

Step 13: Set the Measure_Start_Date and Measure_End_Date to the Time ID Role, and set all other variables to the Input Role. Ensure that the roles and levels for each variable were assigned correctly. You can also click each individual variable and then click Explore to review the data further for each variable name. After you have completed your review, click OK.
Figure 4.17: Edit Variable Roles

Step 14: Add a StatExplore node (Click the Explore tab, and drag the node into the diagram workspace).
Figure 4.18: Add StatExplore Node

Step 15: Connect the File Import node to the StatExplore node.
Step 16: Right-click the StatExplore node and click Run.
Step 17: Expand the Output window results.
Figure 4.19: StatExplore Results

Step 18: Complete Table 4.2 with the StatExplore descriptive measures.
Table 4.2: Descriptive Measures
|
Measures |
Value |
|
Count of Providers |
|
|
AverageHeartAttackPayment |
|
|
MedianHeartAttackPayment |
|
|
MinHeartAttackPayment |
|
|
MaxHeartAttackPayment |
|
|
RangeHeartAttackPayment |
|
|
StdDevHeartAttackPayment |
|
|
VarianceHeartAttackPayment |
|
|
Skewness |
|
|
Kurtosis |
|
|
ProviderProportionwithGreater than the National Average Payment |
|
Step 19: As most individuals are familiar with Excel for computing descriptive measures, a summary of an Excel output has been provided for comparison. As an option, you can also take the data set and run the Excel formulas to compare the results to SAS Enterprise Miner.
Figure 4.20: StatExplore Excel Comparison

Step 20: Next, let us import a similar file, but one that has missing data. Add a File Import node (click the Sample tab, and drag the node into the diagram workspace). Right-click and rename the node as File Import Missing Data.
Figure 4.21: File Import Node Missing Data

Step 21: Click the File Import node, and review the property panel on the bottom left of the screen.
Step 22: Click Import File … and navigate to the Chapter 4 Excel File 4_EL1_Heart_Attack_Payment_Missing_Data.xlsx.
Step 23: Add a StatExplore node. Right-click and rename the node as StatExplore Missing Data.
Figure 4.22: StatExplore Node Missing Data

Step 24: Re-run the same file import and StatExplore node and see how the totals change due to the missing data. For the AvgPayment variable, we see that there are 14 missing values. The Skewness and Kurtosis is also high indicating that there might be other data quality issues present such as outliers.
Figure 4.23: StatExplore Results

Step 25: Add a GraphExplore node. Right-click and rename the node as GraphExplore Missing Data. We are adding this node to further Explore the data quality issues.
Figure 4.24: GraphExplore Missing Data
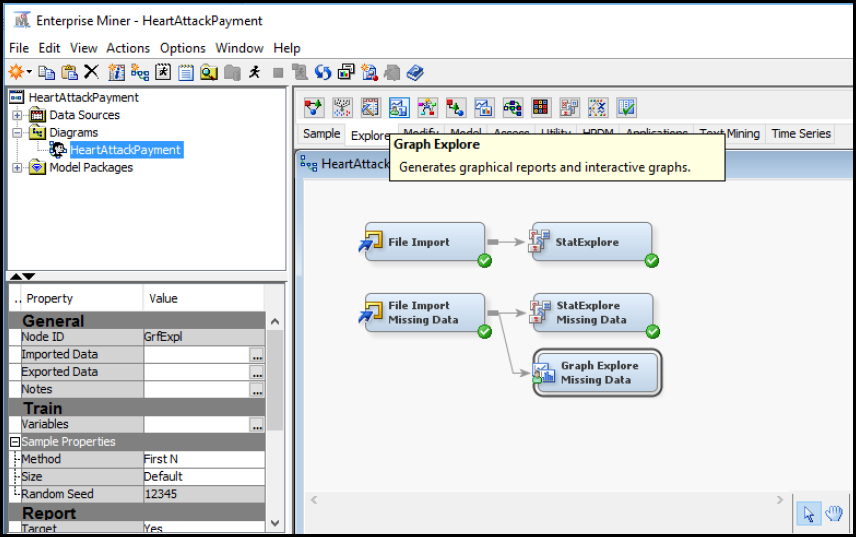
Step 26: Click the Graph Explore Missing Data node. On the bottom left, set the property Size to Max. The setting will ensure that all the data is selected for the graph to be explored. Otherwise, only a sample subset would be selected.
Figure 4.25: GraphExplore Missing Data Size Property

Step 27: Select View ▶ Plot. We want to create a visualization for the data set.
Figure 4.26: GraphExplore Missing Data Plot

Step 28: Select the Box chart type. This will allow for more easily visualizing any outliers.
Figure 4.27: GraphExplore Missing Data Box Chart Type

Step 29: Select the role of Y for the AvgPayment variable. We want to view the box plot for the average payment. Click Finish.
Figure 4.28: GraphExplore Missing Data Box Chart Type Role

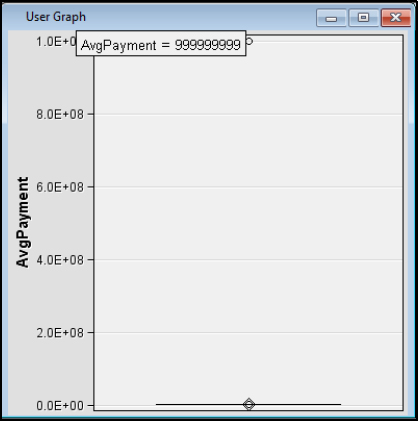
Step 30: Review the results. After review, we see there is one value that is significantly different from the others. If you place your pointer over the outlier value at the top, we see 9s. The outlier might have been a data entry error, a default value, or a conversion error from a system. Close any open windows and return to the main diagram.
Figure 4.29: GraphExplore Missing Data Box Chart Type Role
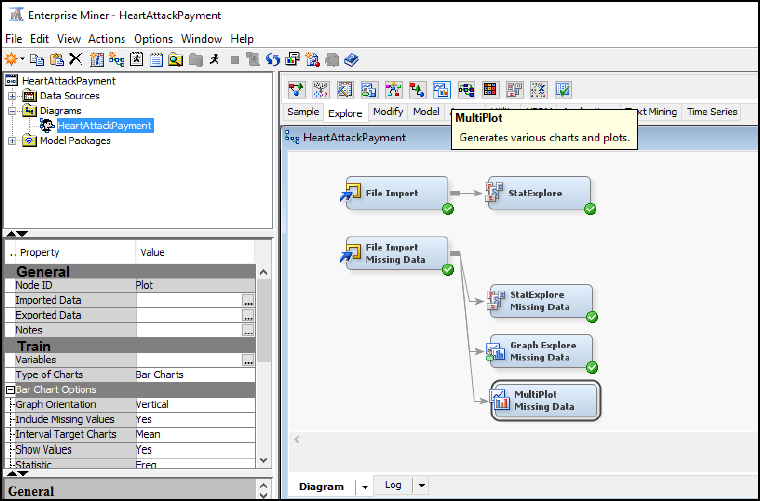
Step 31: Add a MultiPlot node to the diagram.
Figure 4.30: Add MultiPlot Node
Step 32: Review the results. After review of the MultiPlot for AvgPayment, we see an outlier value on the far right. On the far left, we also see missing data as represented by a period (or dot) in 14 records. Close the windows to return to the main diagram, and we will work to clean up this data set.
Figure 4.31: Add MultiPlot Node Results

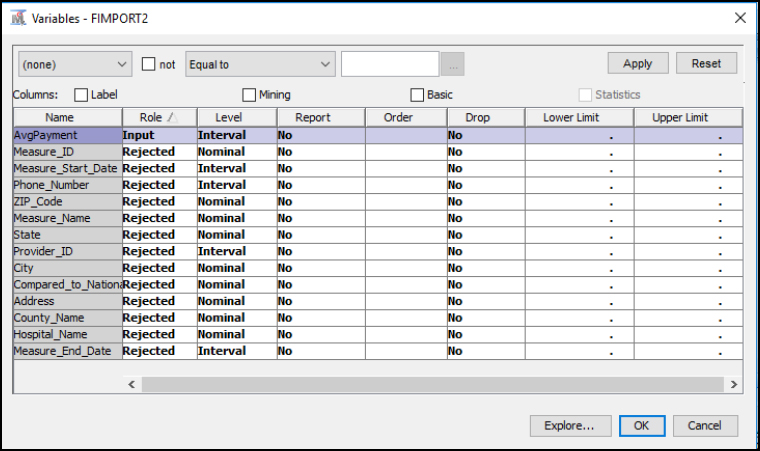
Step 33: Since our focus is on the AvgPayment variable, on the main diagram, right-click the File Import Missing Data node and click Edit Variables. Set all variables to the role Rejected, and keep AvgPayment as the only Input.
Figure 4.32: Update File Import Variables Missing Data
Step 34: First, let us add the Replacement node. We want to eliminate the extreme outlier value from our data set. In Figure 4.33 notice how the StatExplore Missing Data node and the Graph Explore Missing Data node were moved below Replacement. The nodes were moved below because each of these nodes can run independently. All nodes must follow in sequence after File Import Missing Data, since they are dependent on the file information to run.
Figure 4.33: Add Replacement Node

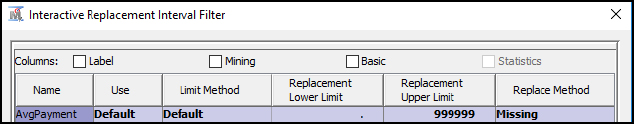
Step 35: Click the Replacement node, and set the Default Limits Method to User-Specified Limits. Then click the Replacement Editor property and click the ellipses. In order to eliminate the extreme outlier value from our data set, set the Replacement Upper Limit to 999,999. The upper limit means anything at or above a $1 million average payment would be replaced. We want to replace this with a missing value, which we will clean up with the next step. Click OK.
Figure 4.34: Update Replacement Node Properties
Step 36: Run the Replacement node and view the results to ensure that one record was replaced with a missing value.
Figure 4.35 Replacement Node Results

Step 37: Next, let us add and run the Impute node, which will replace missing values.
Figure 4.36: Add Impute Node

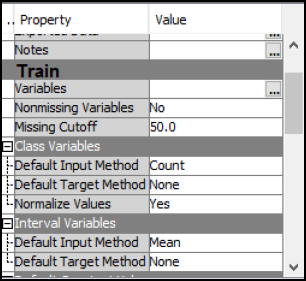
Step 38: Review the Impute node properties. From the properties, we see that there is a 50.0 missing cutoff, which means that if more than 50% of the values of a given variable are missing, the variable will be ignored. Also note the default methods for class variables and interval variables. For Class Variables, we see that the default input method is Count, which means that the value that has the greatest count will be used to replace a missing value. For Interval Variables, we see that the default input method is Mean, which indicates that the average (or mean) of the values will be used to replace missing values.
Figure 4.37: Review Impute Node Properties
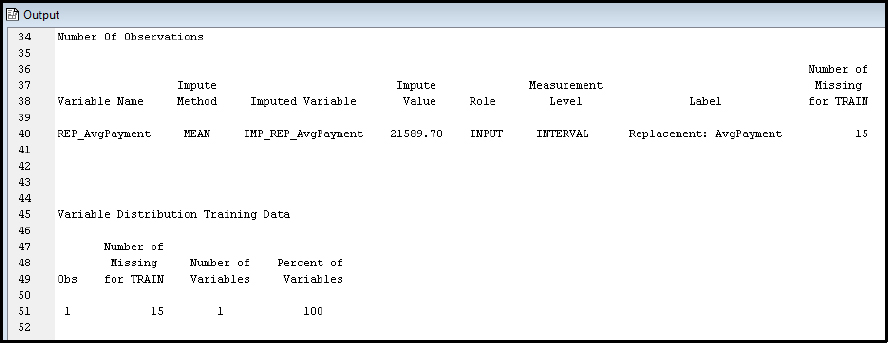
Step 39: Run the Impute node and view the results. From the results, a total of 15 variables were replaced with the average value of 21,589.70. The 15 includes the original 14 missing plus the 1 outlier that is replaced for a total of 15.
Figure 4.38: Review Impute Node Results
The National Committee for Quality Assurance (NCQA) was founded in 1990 and is a private non-profit organization with the aim of improving health quality. Organizations that earn the NCQA seal symbolize quality and pass a rigorous review of over sixty standards with ongoing annual reporting on their performance in over forty areas. In the U.S., NCQA accredited organizations cover 109 million Americans. The Healthcare Effectiveness Data and Information Set (HEDIS) is used by 90% of the health plans in the U.S. to measure performance on healthcare quality and service. HEDIS contains eighty-one measures across five domains of care: effectiveness of care, access/availability of care, utilization, relative resource use, and health plan information. NCQA aggregates HEDIS results from health plans and providers through a questionnaire, which is online through an Interactive Data Submission System (IDSS). HEDIS is used to improve healthcare through performance statistics, benchmarks, and standards. HEDIS data is collected for Medicare, Medicaid, and commercial entities. For your exploration, you’ll be using a HEDIS data subset for one measure on medication management compliance for asthma patients. The variables and descriptions are included below (NCQA, 2017a; NCQA, 2017b; NCQA, 2017c; NCQA, 2017d; NCQA, 2017e).
Data Set File: 4_EL2_HEDIS.xlsx
Variables:
● MemberID, the unique identifier of the patient.
● Age, the age in years.
● MemberMonths, the number of months that the member has been enrolled in the health plan for the current year, from 1-12.
● Gender, the gender assigned at birth, F - female, M - Male, O - if the member refused to provide gender. No other options are allowed.
● MedicationManagementandCompliance, The value 1 is used if the member is in compliance with their asthma medication management, and 0 is used if the member is not in compliance, or information about the member is missing.
Figure 4.39: SEMMA Process
|
Title |
Data Quality Exploration |
|
Introduction |
Provide a summary of the business problem or opportunity and the key objective(s) or goal(s). Create a new SAS Enterprise Miner project. Create a new Diagram. |
|
Sample |
Identify data (sources for exploration and model insights). Identify the variables data types, the input, and the target variable during exploration. Add a FILE IMPORT. Provide a results overview following the file import. Input / Target Variables. Generate a DATA PARTITION |
|
Exploration
|
Provide a results overview following data exploration. Add a STAT EXPLORE. Add a GRAPH EXPLORE Add a MULTIPLOT. Account for the following summary statistics (average, standard deviation, min, max, and so on): ● Count of Members/Gender/MedicationManagementCompliance ● AverageAge/MemberMonths ● MedianAge/MemberMonths ● ModeAge/MemberMonths ● MinAge/MemberMonths ● MaxAge/MemberMonths ● RangeAge/MemberMonths ● StdDevAge/MemberMonths ● Outliers Age/MemberMonths ● Skewness Age/MemberMonths ● Kurtosis Age/MemberMonths Use descriptive statistics. Account for missing data. Account for outliers. |
|
Modify |
Provide a results overview following the modification. Add an IMPUTE. |
Review, reflect, and retrieve the following key chapter topics only from memory and add them to your learning journal. For each topic, list a one sentence description/definition. Connect these ideas to something you might already know from your experience, other coursework, or a current event. This follows our three-phase learning approach of 1) Capture, 2) Communicate, and 3) Connect. After completing, verify your results against your learning journal and update as needed..
|
Key Ideas – Capture |
Key Terms – Communicate |
Key Areas - Connect |
|
Healthcare Quality |
|
|
|
Healthcare Data Quality |
|
|
|
Six Sigma Quality |
|
|
|
Value Based Healthcare |
|
|
|
Meaningful Use: Explore Process Step |
|
|
|
Modify Process Step |
|
|
|
Public Data |
|
|
|
Descriptive Statistics |
|
|
|
Stat Explore Node |
|
|
|
Graph Explore Node |
|
|
|
Impute Node |
|
|
|
Interactive Binning Node |
|
|
|
Replacement Node |
|
|
|
Transform Variable Node |
|
|
|
Heart Attack Payments |
|
|
|
NCQA HEDIS |
|
|