Chapter 11: Identifying Future Health Trends and High-Performance Data Mining
Population and Consumer Changes
Growing World Population and Increased Longevity
Artificial Intelligence and Robotics Automation
Experiential Learning Activity: Robotic Surgery
Healthcare Globalization and Government
Big Data and High-Performance Data Mining Model
HPDM Tab Enterprise Miner Node Descriptions
Experiential Learning Application: SIDS
Healthcare Digital Transformation
Experiential Learning Application: Lifelogs
Experiential Learning Application: Health Anamatics Project
Chapter Summary
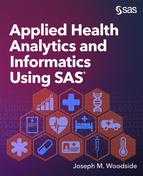
The purpose of this chapter is to identify future trends in health anamatics and to develop high-performance data mining skills using SAS Enterprise Miner. The high-performance data mining (HPDM) focus of this chapter is detailed in Figure 11.1. This chapter builds on the models from previous chapters. This chapter also includes experiential learning application exercises on SIDS and lifelogs. This chapter is intended to prepare you for a future work environment and to continue developing the learning skills and knowledge for a successful long-term career. Individuals that obtain knowledge and viewpoints on emerging trends and technologies can help their organizations anticipate, prepare for, and navigate changes in the future. Organizations that understand and embrace the evolution of health anamatics can guard against obsolescence. Future trends can significantly impact all areas of health anamatics and stakeholders of healthcare including patients, providers, government, and administration.
There are five major trends identified and discussed within this chapter:
● Population and Consumer Changes
● AI and Robotics Automation
● Healthcare Globalization and Government
● Public Health
● Big Data Health Anamatics
Figure 11.1: Chapter Focus - HPDM
Chapter Learning Goals
● Describe future trends and their impact on health anamatics
● Describe high-performance data mining
● Understand Big Data sources
● Develop Big Data modeling skills
● Apply SAS Enterprise Miner HPDM data functions
● Master HPDM
Population and Consumer Changes
The world’s population doubled in the 40 years between 1959 and 1999 from 3 billion to 6 billion. The U.S. Census Bureau has projected that the world’s population will continue to grow to 9 billion by 2044, which is about a 50% increase over 45 years, and grow to 9.3 billion by 2050. This growth implies that even though the population is growing, the growth rate has slowed from the previous century (US Census Bureau, 2016a; US Census Bureau, 2016b). Population growth and population centers are also anticipated to change through 2050. Some continents such as Europe are projected to shrink in overall world population. At the same time, the greatest population growth is projected in Asia and Africa, which might require redistribution of health resources (Roser and Ortiz-Ospina, 2017).
Figure 11.2: World Population

Each generation now, on average, lives a few years longer than the previous generation, and because of continuing improvements in health, life expectancy is expected to increase through 2030. South Korea is projected to be the leader in life expectancy by 2030, with a life expectancy for women of 90.8 years. For men, life expectancy rates are impacted by higher rates of smoking and alcohol consumption than for women even though the difference between men and women is projected to be close. For men, the top country for life expectancy in 2030 is expected to be Switzerland at 83.95 years of age. In reviewing high-income countries, the U.S. is expected to have the lowest life expectancy at 83.3 years of age for women, and 79.5 years of age for men. The mortality rate for high-income countries continues to be high between the ages of 40-60. Factors affecting both high-income and emerging country life expectancies include overall diet, obesity, homicides, accidents, and limited universal health coverage (Senthilingam, 2017a).
A life table is a method to display the probability of a population that lives to or dies at a set age. The Social Security Administration (SSA) develops life tables to review mortality rates in the population over time. Based on the SSA life tables, a newborn has a probability of death within the next year less than 1% and a remaining life expectancy of 76.28 for males and 81.05 for females. By contrast, at the social security full retirement age of 67, there is a 2% probability of death within the next year and a remaining life expectancy of 16.32 years for males and 18.73 years for females, reflecting a declining life expectancy (SSA, 2013). There are some concerns over usage of actuarial tables for healthcare decision-making. A major concern is that healthcare is treated as a simple product and that the cost of a product is being weighed against the cost of a life. Cases where an expensive treatment might prolong end of life might not be deemed “cost effective.”
Increasing aging and life expectancy also has an effect on the cost of healthcare. Researchers have found that the mortality rate for patients in the U.S. with Alzheimer’s disease has increased to 55% in the studied period between 1999 and 2014, with no known cure for the disease. Alzheimer’s disease primarily occurs in those over 65 years of age and is the sixth leading cause of death in the U.S., with more than 5 million with the disease. The number is projected to increase to 16 million in the U.S. by 2050. As individuals live longer, their chances for Alzheimer’s disease increases. Researchers suggest that the increase might be due to a number of factors including the increasing number of those over 65 years of age, improved earlier diagnosis, improved reporting by physicians, and a decrease in deaths caused by other diseases such as heart disease (Senthilingam, 2017b).
Further, end-of-life healthcare accounts for a disproportionate share of healthcare costs. In one study, inpatient costs were measured over the last two years of life for Medicare patients with heart failure, lung disease, cancer, dementia, vascular disease, kidney disease, and liver disease over a four-year period at 3,000 U.S. hospitals. The findings showed a wide range of costs between Mayo Clinic with an average cost per patient of $53,432 and New York University with an average cost per patient of $105,000. Since the patient fatal outcome was similar, the extra costs and care were attributed to additional hospital and intensive care unit days, physician visits, and specialist consultations. Although the costs were not adjusted for disease intensity, the larger remaining question was whether any cost savings caused an extension or improvement of any lives. Due to medical advances in treatment of conditions, it can be difficult to determine when end of life begins, and whether, ethically, everything should continue to be done to prolong life, including additional costs spent to improve end-of-life care and to deliver compassionate care even when a terminal patient outcome is already determined (Neubert, 2009).
The evidence of the high cost of end-of-life care has been shown from studies dating to 1960s (Scitovsky, 2005). Approximately 25% of Medicare spending occurs on end-of-life care for only 5% of the patients, with a total cost of $125 billion. This has an impact on the overall program costs for Medicare as well as out-of-pocket expenses for individuals. Medicare patients in the last five years of life averaged $51,000 for couples, exceeding financial assets 40% of the time. Hospice care focuses on end-of-life services, often in patients’ homes. The focus is on comfort of care and less aggressive interventions, which can be delivered at a reduced cost over other options such as hospital stays. Researchers found that hospice care reduces Medicare spending in the last year of life up to $7,000 per patient (Wang, 2012).
Another growing trend is patients who follow a consumer-driven approach to healthcare, in reviewing healthcare options and basing decisions on cost and quality. Patients expect greater customer service, delivery on requirements, and a value offering. Organizations (such as referralMD, Healthgrades, and Vitals) provide patients with the tools to measure cost and quality (Govette, 2017).
Consumer preferences on natural foods, viewpoints on personal health and wellness, and company commitment to sustainability are also changing healthcare. Panera Bread banned nearly 100 ingredients from their menu items, calling the new menu “clean,” which means that it contained no artificial flavors, preservatives, sweeteners, or colors from nonnaturally occurring sources. The new menu required considerable changes through redesigning recipes, training employees, and educating customers, with the total initiative dating back nearly ten years (Jargon, 2017).
As another example of changing preferences, consumers in the U.S. now drink more bottled water than soda at 39.3 gallons per person versus 38.5 gallons per person, respectively. However, soda has a higher purchase cost, and therefore total sales revenues are nearly double that of bottled water despite consumption of soda at nearly a 30-year low. Impressively, between 1976 and 2015, bottled water consumption grew 27 times. Many of the largest soda companies, including both Coca-Cola and PepsiCo, own or have acquired bottled water brands after recognizing this trend. On a positive note, most of the bottled water, while originating from tap water, has been further filtered or has vitamins added. Conversely, soda leads to an estimated number of 184,000 deaths per year as a result of diabetes, heart disease, and obesity-related diseases (Cottrell, 2017).
Artificial Intelligence and Robotics Automation
Increasing amounts of data and new artificial intelligence (AI) brought to market in the last few years are projected to cause similar disruption to healthcare as with other industries within the next 5-10 years. In the U.S., nearly 10% of the total U.S. population of over 300 million, or 30 million people, have diabetes (Maney, 2017). If including the number of people in the U.S. with diabetes or prediabetes, this number jumps to 100 million (CDC, 2017g). The U.S. is not alone. In ten years, the number of people in China with diabetes will be greater than 100% of the U.S. population. In other words, over 300 million people in China will have diabetes. Diabetes is estimated to be the most expensive disease in the U.S. with up to $10,000 per person a year spent on medication, plus additional physician and hospital bills, as well as with lost productivity. There are nearly 130 tech-based start-ups involved in diabetes. One example is Virta Health, which was founded in 2014 and allows patients to enter their glucose reading, weight, blood pressure, activity, mood, energy levels, and hunger using a smartphone app and cloud computing. The app’s AI analyzes the data to provide information to the patient and doctor on potential warning signals or symptoms along with recommendations on diet and medication. Early estimates are that the software increased productivity and decision-making by a factor of 10 and could save $100 billion in U.S. diabetes related costs. AI can also help automate processes. For example, IBM’s Watson uses patient data, medical research papers, news, and diseases to help diagnosis medical conditions (Maney, 2017).
Robotic process automation (RPA) has the ability to code and computerize many simpler tasks that require physical effort or tasks with limited knowledge understanding and insight requirements. Employee tasks are increasing as a result of the growth in data, regulation, and bureaucracy. RPA will allow employees to spend their time on more meaningful, or value-added, activities to improve healthcare. An estimated 36% of all healthcare job activities can be automated. Healthcare and administrative industries still have one of the lower ranges in terms of industry automation potential, with 36% and 31%, respectively. In contrast, the food services industry has an automation potential of 75%. The most difficult activities to automate will be those involved with managing people, making decisions, or doing creative work. Those activities that involve direct patient care also have a lower automation potential. For example, nurses might have less than 30% of activities automated, and dental hygienists might have less than 13%. Other activities (such as information collection, reading radiological scans, or anesthesia) could be more easily automated (Lhuer, 2016; Chui et al., 2016).
In addition to process automation, robotics can be applied to other healthcare opportunities such as surgeries and patient mobility. The Carson Tahoe Regional Medical Center began using robotic surgical systems in 2017 and are expanding the use of robotics for hernia repair and prostate cancer treatment. The Chief Operating Officer at Carson Tahoe Health explained that the robotics are not intended to replace surgeons but rather to improve their abilities through high-definition 3-D images and smaller incisions made with robotic arms that allow a greater range of motion than the human wrist (Carson Tahoe Health, 2018). Another example of robotics in healthcare is the ReWalk, a wearable robotic exoskeleton that allows individuals with hip, knee, or spinal cord injuries to stand, walk, turn, and climb stairs. The ReWalk device is the first of its kind to receive FDA approval for use in the U.S. (ReWalk, 2017a). The ReWalk 6.0 has a list price of $77,000, but ReWalk Robotics is also developing a lower cost, lighter, and simpler exoskeleton suits for those who have suffered a stroke or have multiple sclerosis (Smith, 2017). In a recent court decision, Blue Cross and Blue Shield of Florida (Florida Blue) was required to provide coverage of the device for a patient with spinal cord injury. The ruling showed that the technology was no longer experimental, and was medically necessary. Although denial of coverage has occurred across the U.S., in over 80% of appeals, the coverage was granted (ReWalk, 2017b).
|
Robotic Surgery: For or Against |
|
Description: Review the following summaries for and against robotic surgery use.
For Robotic Surgery: In India, urology and gynecology are two early application areas of robotic surgery, with general surgery, cardiovascular, oncology and transplants on the rise. The first surgical robotic program in India began in 2006. Today, there are 19 surgical robotic systems in the country, which is a far cry from the number that is needed to serve the population of 1.2 billion. The da Vinci robot, manufactured by Intuitive Surgical, aims to assist with minimally invasive surgery. The robotic device was first approved by the FDA in 2000, and in 2017 had a total of 133 da Vinci surgical robotic systems that were sold (Thomas, 2017). Costs of the robotic systems are often cited as a concern, although as more options enter the market, the cost is expected to decrease. Costs can also be decreased through increased usage, typically on the order of 100-150 patient procedures per year per robotic system. Learning and developing expertise for medical professionals is also being added to existing centers of excellence to improve usage. Overall, the learning curve for robotic systems was less than for non-robotic methods and resulted in a reduced length of stay for patients (Desai et. al, 2015).
Against Robotic Surgery: Although robotic surgery has been supported for many years by medical centers of excellence, it has lacked adoption by the general surgical community due in part to high costs and limited benefits. Advantages of robotic surgery include magnified 3-D vision, ergonomic movements with full range of motion, reduction in strain, precision, increased patient service, and minimization of hand tremors. Drawbacks include space required for the robot, increased operating room time, changing docking position of the operation table, lack of tactile feedback, and safety. Lack of tactile touch is seen as too high a price to pay for the technology. Complications of surgery or malfunctions are thought to be underreported. Robotic surgery has an initial investment of $2 million with annual maintenance of $400,000 along with disposable components. In comparing prostate cancer outcomes, open surgery resulted in a 5-year outcome rate of 80%, 78% for laparoscopic surgery, and 84-90% for robot-assisted laparoscopic surgery. For technology to be of benefit to countries, and in particular developing countries such as India, a five-step approach is recommended called the 5 As: Affordable, Acceptable, Accessible, Available, and Appropriate (Udwadia, 2015).
|
|
List a point for robotic surgery:
|
|
List a point against robotic surgery:
|
|
Which point of view do you agree with? Discuss your justification:
|
|
Discuss Global Robotic Surgery Readiness in Terms of the 5As:
Acceptable:
Affordable:
Accessible:
Available:
Appropriate:
|
|
Based on the preceding factors, which countries do you foresee as the leaders in robotic surgery? What are the barriers and how can these be addressed? Will robots render healthcare professionals obsolete?
|
|
Describe one robotic procedure and technology. Are robotic surgeries safe? What is the government’s role in robotics?
|
Healthcare Globalization and Government
Pricewaterhouse Coopers (PwC) identified a few of the top health issues as part of their industry report. The overall themes trended around value of care, including adapting, innovating, and building value-based care. Key areas around adapting include uncertainty of the healthcare legislation on Affordable Care Act (ACA) and incentive-based payments. Key areas around innovation include emerging technologies such as artificial intelligence and virtual reality, along with population health management. Key areas around building value-based care include reducing medication prices and improving education in a new value-based healthcare world (PwC, 2017). Given the ongoing legislation of healthcare proposals in the U.S. (including the repeal and replacement of the ACA), some advocates are calling for a more dramatic change to a single-payer healthcare system. A similar system is already in place in Canada, France, the U.K., and Australia. This model provides universal coverage through government-based funding or hybrid public/private setup. In the U.S., the states of California and Illinois have discussed legislation on a single-payer system, and even CEOs of health insurance companies such as Aetna have discussed publicly a single-payer system. The Physicians for a National Health Program also supports a single-payer insurance model, also known as Medicare for all, and would give coverage to everyone in the U.S. for medically necessary services including physician, hospital, preventative, and long-term care, as well as mental health, reproductive health, vision, prescriptions, and medical supplies. Co-pays, deductibles, restrictive coverage networks, and premiums would be eliminated. The program estimates that 95% of households would save money. Also, the program would be paid for by primarily replacing the inefficiencies that are currently in place, which, along with changes in taxes, would result in an estimated $400 billion in savings. Even under the ACA mandate for universal coverage, still some 30 million remain uninsured. Those without coverage would continue with the American Health Care Act (AHCA) plan. In addition, both the ACA and AHCA add administrative costs and healthcare spending through new legislative changes, which is an estimated $1.1 trillion over the next decade (Bryan, 2017; PNHP, 2017).
International healthcare growth in overseas markets and changes in governmental coverage and control are driving insurers to provide healthcare coverage and services internationally. In China, 90% of the population lack coverage, compared with 16% in the U.S. The market in China is expected to grow to an estimated $56 billion by 2020. Although healthcare costs have increased, they are still far less than in developed markets, which is attractive to insurers. Latin America has also experienced a rapid influx of multi-national corporations that provide healthcare coverage. During the period of 1996-1999, revenues of multi-national healthcare corporations increased faster in Latin American than in U.S. revenues. As the U.S market becomes saturated, companies are seeking new market locations for sustained growth (Lim 2006; Ran, Waitzkin, Merhy 2004; Woodside, 2008). In international studies, setup costs were identified as a major barrier to electronic system implementations. Healthcare services that occur outside the country of residence require a lengthy manual process in order to gain reimbursement. Trust factors (such as information security, infrastructure, education, government, and culture) influence adoption rates. Security issues include data theft, corruption, and personal or confidential data. Trusted authorities are also a key component to security and trust. Global certificate and intermediary services that improve security are being developed internationally. Culture might also influence the communication language that is selected or a willingness to engage in nonpersonal contracts between systems (Angeles, Corritoreb, et al. 2001; Hassan, Pans, Collins 2003; Hennick 2007; Woodside, 2008).
Government initiatives that intend to improve healthcare and to encourage healthier behaviors have also drawn concerns. Similar to car insurance safe-driving discounts, some government initiatives have proposed the offer of healthcare discounts or penalties according to food consumption, genomic sequencing results, or preventative care completion. Critics consider healthcare monitoring to be an invasion of privacy and micromanagement of one’s life by government. However, precursors to the creation of larger government regulations have been tested through wellness programs and taxation initiatives. One example of an initiative is the reduction of soda consumption via a tax. Several states and cities (such as New York, Seattle, and Chicago) have proposed taxes on soda and related drinks although nearly 45 such proposals have been defeated. However, Philadelphia approved a tax of 1.5 cents per ounce tax on diet soda, regular soda, iced tea, energy drinks, juice drinks with under 50% juice, and other sports drinks. This was Philadelphia’s third attempt at the soda taxes to encourage healthier drinking and to raise funds. Critics such as the American Beverage Association argue that the tax is regressive and impacts the poorer population disproportionately. Since implementation in the beginning of 2017, the city has reported greater-than-expected revenue of nearly $5.7 million in the first month. However, retailers have reported nearly a 50% decrease in sales, leading to layoffs, which have been blamed on the tax. The city had previously projected a 27% decrease in sales as a result of the tax. Court cases on repealing the tax are ongoing (Premark, 2016; Zwirn, 2017).
Similar to the soda tax, initiatives on genetic testing have also been proposed for improving healthcare management. As a government establishment, the Food and Drug Administration (FDA) approved genetic testing through companies such as 23andMe to allow patients to learn their risks for ten diseases: Parkinson’s, Alzheimer’s, Celiac, Alpha-1 antitrypsin deficiency, Primary dystonia, Factor XI deficiency, Gaucher disease type, Glucose-6-phosphate dehydrogenase deficiency, Hereditary hemochromatosis, and Hereditary thrombophilia (Pirani, 2017). A recently introduced bill allows employers to require employees to complete genetic testing and allows employers access to the information, with the risk of penalties for employees not completing the testing. Currently, the genetic privacy and nondiscrimination (GINA) law passed in 2008 and the 1990 Americans with Disabilities Act prohibit this testing and access. Employers argue that the testing is needed for workplace wellness programs that are not covered by the current laws (Begley, 2017).
Recently, governments have focused on the life sciences aspect of healthcare, namely on rising drug costs and research of new medicines. Life sciences incorporate pharmaceutical, biotechnology, medical device, vaccines, and research organizations that bring therapies to market. The combination of safety, patents, and approvals led to an estimated cost of $1.2 billion for each new therapy (Handelsman, 2014). Analytics has been used in the discovery process of new treatments. The mapping of the human genome in 2001 was a major discovery process that led to new treatment opportunities. Analytics can also be applied to the development of trials to measure safety and effectiveness, which is a form of descriptive analytics. Analytics is also applied to manufacturing to address shortages, identify demand, and improve the supply chain. Six Sigma has been used in reducing the number of defects during manufacturing. In 2007, the FDA released the report titled Pharmaceutical Quality for the 21st Century to identify manufacturing quality improvements using analytics and other methods in order to prevent recalls and safety concerns. Sales and marketing can also use analytics to determine physician targeting, marketing mix, and rebate optimization. Healthcare reform can have an impact on the life sciences through cost controls and differentiated treatment requirements that target new areas of need rather than replications of existing therapies (Handelsman, 2014).
Another growing area of importance of government and public health is income inequality and social inequality. Top incomes continue to grow while the percentage of those in poverty continues to grow. Poverty is calculated by comparing annual income based on family household size, number of children, and age. Poverty rates varied by state from 8.5% to 21.9%. Based on the latest U.S. Census Bureau data, there were nearly 44 million people who live below the poverty line, which is approximately $25,000 for a family of four (Bishaw and Macartney, 2010, U.S. Census Bureau, 2017). In 2011, the CDC released the Health Disparities and Inequality report, with a follow-up report in 2013, which highlighted disparities and inequality in healthcare based on gender, race, ethnicity, income, education, disability, and additional factors. A health disparity is a health difference that is connected with an economic, social, or environmental disadvantage. The CDC findings showed that inequalities in income and health demonstrate that gaps are evident. Individuals with low levels of income generally experienced increased rates of mortality, morbidity, and decreased rates of access to healthcare and quality of healthcare. U.S. Department of Health and Human Services (HHS) and other agencies have launched strategic initiatives to reduce health disparities including an increased access to healthcare and healthcare coverage, recruitment of underserved areas for healthcare workers, and work to target specific diseases that show higher levels of disparities such as childhood obesity, maternal health, and cardiovascular disease (CDC, 2015).
Public Health
Nearly one quarter of deaths worldwide are due to addressable environmental factors, including physical, chemical, and biological elements. Components that can be directly modified include air pollution, water quality, sanitation, ultraviolet radiation, working conditions, and ecosystem change. There is the potential to prevent up to 12.6 million deaths, with over 100 diseases attributed to the environment. These diseases can include respiratory infections, asthma, cardiovascular, injuries, infections, malaria, and cancers. The environment disease burden is higher in lower income and developing nations (Pruss-Ustun, 2016). A 2017 cholera outbreak in Yemen had an estimated number of 200,000 cases and 1,300 deaths, qualifying it as the worst cholera outbreak in the world, up to that time. Still, an estimated number of 3-5 million cases of cholera in the world occur each year. Cholera is a diarrheal illness caused by bacteria in drinking water, causing those infected to lose fluids, leading to dehydration. The United Nations International Children's Emergency Fund (UNICEF) and World Health Organization (WHO) worked with local response teams to educate households on clean drinking water. The cholera outbreak was, in part, a result of several years of conflict in the country. The conflict led to limited funding for healthcare, which led to a lack of clean water and sanitation systems (CDC, 2016c; Lake and Chan, 2017).
Product recalls are another area of public health and occur regularly. Ten individuals in California contracted botulism that was traced to nacho cheese sauce as reported by the Sacramento County Department of Health and Human Services (Andone, 2017). Botulism is a rare illness with 145 cases reported per year in the U.S. Symptoms begin 18-26 hours after consuming the food and include blurred vision, slurred speech, and paralysis. The disease can be fatal in 3-5% of cases (Andone, 2017). After three consumer complaints of metal within the packages, 200,000 pounds of hot dogs were recalled, although no reports of injuries or reactions were found (AP, 2017). In June 2017, nearly 2.5 million pounds of breaded chicken products were recalled, as the products might have contained milk, a known allergen, which was not declared on the product labeling. The supplier of the bread crumbs indicated that the bread crumbs might have potentially contained undeclared milk. The U.S. Department of Agriculture (USDA) has three recall classifications. Class I is a health hazard situation where a reasonable probability exists that the use of the product would cause serious, adverse health or death. Class II is a health hazard situation, which has a remote probability of adverse health. Class III is when no adverse health conditions would be caused (Medina, 2017). The USDA’s Food Safety and Inspection Service (FSIS) announced the recall of bread crumbs as a Class I, with no confirmed cases of any adverse reactions to the products. In 2018, an E. coli outbreak in 11 states caused the CDC to issue a consumer warning to avoid all romaine lettuce for a second time in the same year. Of striking interest to researchers and health officials was that approximately 70% of the illnesses were reported by women. This follows a similar pattern to 2016 where 73% of those ill from an alfalfa sprouts outbreak were also women. In analyzing the data, researchers have found that diet can be the greatest contributing factor, with women's diets including more vegetables. Others suspect another factor is that the willingness to report symptoms to their doctors can occur at a higher rate for women than for men. Despite these recalls associated with lettuce, health officials stress that this health outbreak is not an excuse to stop eating vegetables (Rossman, 2018).
One method of detecting public health occurrences is through geographic information systems and mapping. These geographic (or spatial) types of tools can help public health officials monitor and deploy resources more easily to affected areas. Walgreens developed the Flu Index, which is a weekly report that provides state-level and market-level detail incidence of flu. The index is calculated based on prescriptions filled for influenza. In a 2017 report, several of the top states were concentrated in a southeastern section of the U.S., including North Carolina, South Carolina, Kentucky, Tennessee, and Virginia (Walgreens, 2017). In a 2018 report, the top ten designated market areas with flu activity were all within the single state of Texas, demonstrating how the patterns might change over time (Walgreens, 2018). A spatial epidemiological approach to healthcare studies provides significant insight into evaluating health intervention and decision-making and offers organizations the opportunity to analyze unusual geographical patterns of disease. Factors such as neighborhood economics, social fragmentation, and rurality can also affect individual risk factors. Routine, aggregated healthcare data that is stored in health systems can be used to identify disease clusters (or utilization patterns). A typical advantage is that routine service data is readily available and, in some cases, data can be available in real time. Cluster analysis can be used to study whether diseases such as lung cancer or causes of death such as suicide are spatially clustered (Woodside and Sikder, 2010; Woodside and Johnson, 2015; Johnson et al., 2016).
Big Data Health Anamatics
Big Data Health Anamatics is truly an interdisciplinary topic that spans the entire organization and areas of management. Given the high failure rates of big data projects, most managers do not focus on the organizational span or focus solely on skills-based learning. Managers must apply Big Data Health Anamatics to build both short-term skills along with lifetime learning capabilities for their organizations and their members. The learning capability aligns and connects with our knowledge of mental models for short-term learning (mental-model maintenance) and long-term learning (mental model building). Mental models influence behavior and create a basis for reasoning, which improves human decision making. By allowing pre-defined models, which speed information processing speed is improved when supplemented by Big Data Analytics (Vandenbosch and Higgins, 1995). Learning theories have evolved from memorization to understanding of information and have often influenced organizational practices from simple structured learning domains to complex unstructured learning domains. Knowledge can be defined as the repository of intellectual assets that have been combined from experience, learning, and practice. Knowledge is often described in terms of data and information. However, knowledge can only be distinguished through an individual's personalization and interpretability to others. Increasing amounts of information and Big Data are useful only when processed by an individual through learning processes (Nonaka, 1994).
Big Data is characterized by Vs: volume, velocity, variety, veracity, variability, and value of the data. Health analytics seeks to uncover hidden patterns and information in Big Data that is retrieved from health systems, with methods of analytics including descriptive, diagnostic, predictive, prescriptive and cognitive (Hughes, 2011; Heudecker, 2014). The current volume of healthcare data is estimated at 150 exabytes and is soon growing to zettabytes and yottabytes. Cognitive computing systems are aimed at using this data and systems to enable clinical decision support, allow knowledge sharing between teams, use the latest evidence-based guidelines, increase preventative care, and improve health (Govette, 2017). Benefits of Big Data include reducing cost to analyze and use evidence-based practices. Given that Big Data in healthcare generates one-third of the world’s data and is estimated at $300 billion over the next decade, many new companies and recent IPOs are in healthcare and analytics-related areas. Today, healthcare organizations are becoming increasingly computerized, thereby capturing increasing amounts of data in various places. In other industries, the use of information systems can be tied to improved quality and competitive advantage. Extracting, formatting, analyzing, and presenting this data can improve quality, safety, and efficiency of delivery within a healthcare system. Big Data analytics has been used in radiology to address the complex, poorly integrated, and functionally limited legacy systems as practices transitioned from analog to digital. Big Data analytics allows the decision maker to develop trends and interactively drill down to answer further questions as they become apparent. Procedural and performance metrics can be tracked to improve patient care and to reduce costs. Examples include resource utilization by scanner, time variances between scheduled and actual time, evidence-based outcomes, billing tracking, and quality outcomes measurements such as length of stay and charge costs (Woodside, 2014).
Big Data and access to information for patients, providers, payers, governments and others will allow joint responsibility for information and self-management of conditions that lead to improved levels of quality and care and of outcomes. Outcomes can be improved through measurements, surveillance, analysis, and interventions:
● Outcome measures can include patient assessments, health status, surveys, cost, providers, and other factors.
● Outcome surveillance is the monitoring of conditions or services for outcomes and can be used for environmental or communicable conditions. Also population-based approaches to health, such as cancer screenings, are useful.
● Outcome analysis converts the data into useful information.
● Outcome interventions are a result of the preceding analysis and are judged by effectiveness and efficiency and target improvements in population health.
Big Data is able to be collected from both structured and unstructured data sources. Each set of source systems should be identified, measured, and documented through data types, size, growth, and value (Woodside, 2013). According to a SAS survey, only 14% of respondents were likely to use big data sources, and according to McKinsey organizations use only 12% of the data available to them (Brown, 2012; Merrideth, 2013).
Big Data management solutions will benefit healthcare providers, payers, research, and government organizations. The solutions will also decrease variability, reduce costs, and improve quality by providers, while still delivering personalized care. Healthcare organizations are able to monitor metrics (such as service line, physician, payer, and patient category) to decrease costs per case, increase revenue, and increase utilization of facilities and staff. The capabilities include executive dashboards, reporting, and analysis, with data drill-down capabilities. Physicians can use predictive analytics for care treatment decisions and real-time decision-making and can incorporate both structured and unstructured sources to bring additional evidence. For patients, Big Data can help personalize care for patients based on genomic and test data, increase consistency of costs and treatment, and improve quality. A patient’s social media data can be analyzed to improve lifestyle, care, and costs. In addition, historical trends can be reviewed and future trends predicted with greater confidence. Patients can be measured against larger comparison groups, patient outcomes predicted, and best pathways of care established. For providers, Big Data facilitates the review of unstructured and structured data,the identification of care patterns, and the identification of risk factors, all leading to improved outcomes through education, research, and care. For payers, Big Data can be used to improve patient wellness, compliance, fraud detection, incentive programs, and controlling costs. Researchers can integrate large disparate sets of information automatically in order to develop findings from previously siloed information, improving pattern detection and surveillance (Woodside, 2013).
Big Data and High-Performance Data Mining Model
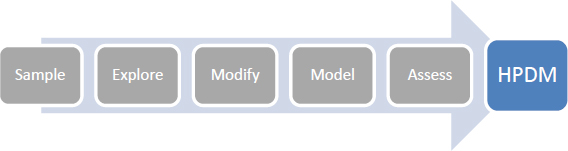
Although SEMMA is a standard data mining methodology that is used for most data sets and projects, when using Big Data, a separate set of tools and methods can be used. A data mining method that is designed specifically for Big Data is BEMO (Business Opportunity, Exploration, Modeling, and Operationalization) and is a standard parsimonious process that was developed for conducting data mining projects in a reusable and repeatable fashion in a Big Data environment. The BEMO model is technology- and industry-agnostic and uses new high-performance data mining technologies such as SAS High-Performance Data Mining (HPDM). The principle of parsimony requires the abandonment of complex models and the use of simpler models that can generalize new problems. A parsimonious model is one that meets the necessary requirements while limiting factors. Occam's razor is a principle that states that, all things being equal, the simpler solution is preferred. For example, data mining decision trees are often pruned to develop simpler solutions and to prevent overfitting. During Business Opportunity, the goals (or objectives) are defined along with the problem being solved. During the Exploration step, data quality (including variable selection, outlier correction, duplication correction, and so on) is reviewed and updated. During the Modeling steps, the predictive models are used based on the combination of inputs and outputs. In the Operationalization step, the model is implemented and practical considerations of operations are incorporated (Woodside, 2016).
Figure 11.3: Big Data Mining Process
Business Understanding
During the Business Opportunity step, the goals (or objectives) are defined along with the problem being solved. This is a critical, although sometimes overlooked, component of a data mining project that ensures successful definition and outcomes in support of the business objectives. During this step, an executive summary is provided to communicate to key stakeholders from a customer, financial, employee, or operational perspective. An organizational and industry background is provided along with key objectives (or goals) that are expected as a result of the data mining project. The Business Opportunity section is kept intentionally brief and at a summary level for stakeholders who are conducting the data mining project.
Exploration
During the Exploration step, data quality is reviewed and updated. Data quality factors include variable selection, outlier correction, duplication correction, data reduction, data visualization, and data standardization (or normalization). During Exploration, variables must be assessed for type for future model use. With Big Data, traditional data processes, data management, and data quality components must be reassessed and improved.
Model
During the Modeling step, the predictive models are used based on the combination of inputs and targets. The models are similar to the ones that we have covered earlier, including regression, decision trees, and neural networks.
Operationalization
In the Operationalization step, the model is implemented, and practical considerations of operations are incorporated. Model advantages and disadvantages are discussed in the context of a business setting application. An overall project plan is developed to ensure that the project deliverable is on time, on budget, and on scope. The plan includes practical considerations of resources, timeline, and iterative phases. A formal assessment of the project is also made. Assessment items include return on investment (ROI), payback, net present value (NPV), and break-even analysis.
High-Performance Data Mining (HPDM) capabilities have been developed in SAS in part due to the rise of Big Data and the ability to leverage technology such as parallel processing and distributed processing. The technology allows computationally intensive operations to be split across computer processors or a set of computers to improve overall speed of analysis. The HPDM capabilities are similar to those covered in previous chapters, including logistic regression, decision trees, and neural networks. The primary difference is the multi-processor and computer capabilities. For illustration and learning purposes, we are able to run the HPDM nodes on a single computer. However, to take full advantage of the capabilities, a distributed multi-computer environment can be set up. In one demonstration example from SAS, a data set with over 100 million records took over seven hours to run using traditional methods, although only one minute was used with the HPDM capabilities (SAS, 2016e). The distributed capability is valuable for computationally intensive research and can be used for more timely decision- making at the point-of-care by providers.
The HPDM nodes that are associated with the HPDM tab are not meant to replace existing nodes that are associated with the SEMMA tabs, though used based on big data processing requirements. Although a subset of nodes exists today, more nodes are planned for the future. For the most part, HPDM and other nodes from the associated SEMMA tabs cannot be combined. They are indented to indicate that they can be used separately. However, exceptions are the File Import and Model Comparison nodes. The High-Performance (HP) node icons match those for the non-HP SEMMA nodes. However, the HP nodes are identified by a red icon in the upper corner, and each node name contains the HP prefix. Here is an example:
Figure 11.4: HP Data Partition Node
![]()
The HP Data Partition node splits the data set into training and validation.
Figure 11.5: HP Explore Node
![]()
The HP Explore node generates a set of summary descriptive statistics.
Figure 11.6: HP Impute

The HP Impute node generates values for missing values data sets.
Figure 11.7: HP Regression Node
![]()
The HP Regression node generates high-performance linear and logistic regression models.
Figure 11.8: HP Tree Node
![]()
The HP Tree node generates high-performance decision tree models.
Figure 11.9: HP Neural Node
![]()
The HP Neural node generates high-performance neural network models. Now that you are familiar with the major trends, including Big Data health anamatics and High-Performance Data Mining (HPDM), we’ll continue with an experiential learning application that deals with SIDS.
Experiential Learning Application: SIDS
In the U.S., 1 of 1000 children under one year of age die each year from unexplained causes. These unexplained deaths are referred to as Sudden Infant Death Syndrome (SIDS). One preventation method that was started in the 1990s, was to start putting babies to sleep on their backs, instead of their stomachs or sides. The SIDS prevention method and associated ‘Back to Sleep’ educational campaigns, led to a decrease in the number of deaths, and rate has remained consistent ever since. SIDS is often a combination of factors during a critical development time and most often occurs during the second month of life. Research studies in the past have often used a few hundred cases at a time to examine the problem. In a new effort led by Microsoft and Seattle Hospital, the aim is to examine and mine large data sets from the CDC to find patterns. By attempting to find the relationships between every single variable and SIDS, the researchers hope to find patterns that were not previously identified in small samples of data. Researchers have used similar large data sets in developing treatments for cancer and other diseases. The CDC collects 90 variables for each child born in the U.S., and between 2004 and 2010, that collection represents nearly 30 million records. Variables include medical care of the mother, race, education, income, along with other factors such as cause of death. One discovery that has already been made by the data scientists is that mothers who receive prenatal care within their first trimester have a lower risk of having a baby with SIDS, with the risk increasing up to 40% when starting prenatal care later. Other findings include the optimal number of physician visits, which can help policy makers determine best practices for prenatal care and physician appointments. Because the data shows how the risk of smoking while pregnant increases the SIDS rate each day, the recommendation to quit smoking earlier in pregnancy is an easy sell (Phillips et al., 2010; Bass, 2017; CDC, 2017h; Mayo Clinic, 2017c).
Although SIDS can impact any infant, a set of factors has been identified by researchers that can lead to higher risk. The factors include male gender, infants 2-3 months of age, race, family history, second-hand smoke, premature birth, and maternal factors such as age under 20, smoking, drugs, alcohol, and prenatal care (Mayo Clinic, 2017c). Premature births also have a similar set of risk factors. In a study in the U.S., the preterm birth (one that occurs before 37 weeks of gestation or pregnancy time) rate has been increasing and stands at nearly 10% of births. The study found that the U.S. has the highest rate of newborn deaths in the developed world, ranking below 130 countries. Factors that can lead to pre-term birth include lack of prenatal care, obesity, tobacco use, age, ethnicity, and accessibility of care (Fox, 2017).
The CDC tracks SIDS and unknown causes using ICD-9 and ICD-10 codes. SIDS is represented by 798.0 (or R95), accidental suffocation represented by E913.0 (or W75), and unknown causes represented by 799.0 (or R99), respectively, with the label Sudden Unexpected Infant Death (SUID). The CDC also monitors SUID within sixteen states, covering 30% of SUID cases within the U.S. Using the CDC SUID cases, the Michigan Public Health Institute (MPHI) identified an increase in SUID with families that also receive child protective services. In response, training and policies were implemented for all child protection workers, and a bill was passed to require hospitals to provide educational materials to new parents (CDC, 2017i).
Other researchers have examined parental behavior to link with SIDS. In one U.S. study, researchers reviewed alcohol consumption in relation to SIDS. The findings demonstrated the greatest spikes in alcohol consumption and SIDS cases occurred on New Year’s Eve between 8 p.m. and 3:59 a.m. on New Year’s Day. Additional increases in alcohol consumption and SIDS cases occurred on weekends. Although alcohol can be a risk factor in combination with other factors that lead to SIDS, the authors hypothesize that an alcohol-impaired caregiver might be less likely to have an infant sleep in the correct position and less likely to adequately monitor the infant during New Year’s and weekends (Phillips et al., 2010). Another study in Croatia examined factors such as socioeconomic status, smoking, age of mother, age of father, and birth weight, among others. Their finding showed a greater relationship between SIDS and smoking, sleeping position, age of infant between 2-4 months, time of death, parental age above 30, and male gender. Socioeconomic factors were not found to have a significant relationship with SIDS (Rozman et al., 2014).
A sample has been provided for you to get started. The SIDS data set includes 13 variables and 21,000 records.
Objective: Determine the factors linked with SIDS.
Data Set File: 11_EL1_SIDS.xlsx
Variables:
● PatientID, unique identifier
● Gender, (F=Female, M=Male)
● Age_Months, in months
● Race, (Alaska Native, American Indian, Black, White)
● FamilyHistory, indicator (1=True, 0=False)
● SecondhandSmoke, indicator (1=True, 0=False)
● Premature, indicator (1=True, 0=False)
● MotherAge, in years
● MotherSmoke, indicator (1=True, 0=False)
● MotherAlcohol, indicator (1=True, 0=False)
● MotherPrenatalCare, indicator (1=True, 0=False)
● DiagnosisCode, ICD code
● SIDS, indicator (1=True, 0=False)
Step 1: Sign in to SAS OnDemand for Academics.
Step 2. Open SAS Enterprise Miner (Click the SAS Enterprise Miner link).
Step 3. Create a New Enterprise Miner project (Click New Project).
Step 4: Use the default SAS Server, and click Next.
Step 5: Add the project name, and click Next.
Figure 11.10: Create New Project

Step 6: SAS will automatically select your user folder directory (If using the desktop version, choose your folder directory), and click Next.
Step 7: Create a new diagram (Right-click Diagram).
Figure 11.11: Create New Diagram and Add Name

Step 8: Add a File Import node (Click the Sample tab, and drag into the diagram workspace).
Step 9: Click the File Import node, and review the property panel on the bottom left of the screen.
Step 10: Click Import File and navigate to the 11_EL1_SIDS.xlsx Excel file.
Figure 11.12: File Import

Step 11: Click Preview to ensure that the data set was selected successfully, and click OK.
Step 12: Right-click the File Import node and click Edit Variables.
Step 13: Set SIDS to the Target variable role, set PatientID to the ID role, set the DiagnosisCode to Rejected, and all other variables to the Input role. Explore and set the remaining variables according to their nominal, interval, or binary levels. To review an individual variable in order to verify its role and level assignment, click the variable name and then click Explore. After you have finished setting all variables, click OK.
Figure 11.13: Edit Variables

Step 14: Add a Data Partition node (Click the Sample tab, and drag the node onto the diagram workspace). Set the Data Partition Property Data Set Allocations to 60.0 for Training, 40.0 for Validation, and 0.0 for Test. Review the data Partition Results. For non-HPDM applications, this would be similar to the process steps for selecting Data Partition from the Sample tab.
Figure 11.14: Data Partition Node

Step 15: Add an HP Explore node (Click the HPDM tab, and drag the node onto the diagram workspace). For non-HPDM applications, this would be similar to the process steps for selecting StatExplore, Graph Explore, and MultiPlot from the Explore tab.
Figure 11.15: HP Explore Node

Step 16: Review results. From the HP Explore results, we find that there are a total of 21,000 records, with no missing data across variables and an initial indication of good data quality. There are two interval variables, Age_Months and MotherAge, as shown by the Scale VAR. The remaining variables are of Scale CLASS, indicating a binary variable or a nominal variable, or a class or category variable. The skewness and kurtosis for all variables is within acceptable ranges of -2 to 2, indicating an absence of extreme outlier values. Since neural network might be affected by missing or outlier values, we still want to add the Impute and Transform nodes to our final model diagram as a best practice, since future unknown data sets might contain these issues and we want to reuse the same model.
Figure 11.16: HP Explore Results

Step 17: Review results. Note that the execution mode of a single machine and number of threads. The threads are the cores, in this case. A quad-core processor was used on a single machine. A thread is the set of processing instructions that are sent through a single computer core. In this case, four simultaneous instructions were able to pass through four central processing units or cores, improving the run-time efficiency.
Figure 11.17: HP Explore Results

Step 18: Add an HP Impute node (Click the HPDM tab, and drag the node onto the diagram workspace). Verify that the Impute Property is set to Count for Class variables and Mean for Interval variables.
Figure 11.18: Impute Node

Step 19: Add an HP Regression node, an HP Decision Tree node, and an HP Neural Network node (Click the HPDM tab, and drag the nodes onto the diagram workspace).
Figure 11.19: Model Nodes

Step 20: Right-click the Regression node, Decision Tree, and HP Neural nodes, and click Run.
Step 21: Expand the Output Window Results for each model. Review the Fit Statistics for each model, including the misclassification rates and cumulative lift.
Step 22: Add a Model Comparison node (Click the Assess tab, and drag the node onto the diagram workspace). Instead of having to manually compare each of the three model outputs, the Model Comparison node will compare the three models and select a model based on the criteria in the Model Comparison node properties. By default, we will use the validation misclassification rate to select the best model, or we will use the model with the lowest event classification error percentage from our validation data set. Right-click the Model Comparison node, and click Run. Note that although the Model Comparison node is not present on the HPDM tab, it is compatible with the HPDM nodes.
Figure 11.20: Model Comparison Node

Step 23: Expand the Output Window Results for each model. Review the Fit Statistics for each model, including the misclassification rates and cumulative lift. With the results of the Model Comparison node, all three model results are included at once. In the Cumulative Lift chart, the Decision, Tree, Regression and Neural Network model perform similarly. For the validation misclassification rate, again all three models have a matching misclassification rate of 0.19%. The Decision Tree model is selected based on the slightly lower error rate. The decision tree can also prove to be a more valuable model because it can be interpreted easily.
Figure 11.21: Model Comparison Nodes Cumulative Lift

Figure 11.22: Model Comparison Nodes Fit Statistics

Step 24: Click the Decision Tree node in the model diagram, and expand the output window results. The first split of the tree is based on the Premature variable. The first split is to Node Id 1, Premature = 1 (or True), which contains the majority of the records. Following Node Id 3, the next split is MotherSmoke. The displayed English Rule for Node Id 3, where Premature = 1 and MotherSmoke = 1, shows that the infant is highly susceptible to SIDS. Using these IF…THEN rules can help reduce occurrence of SIDS, for example, through patient education that premature birth, smoking, and family history might increase the risk of SIDS.
Figure 11.23: Decision Tree Output

Model Summary
In summary, High-Performance Data Mining (HPDM) capabilities have been developed in SAS in part due to the rise of Big Data and the ability to leverage technology such as parallel processing and distributed processing.
● Input: Interval, Binary, or Nominal
● Target: Interval, Binary, or Nominal
● Model: HP Regression node, HP Tree node, and HP Neural node
● Evaluation: Assess Model Comparison node, or individual nodes evaluation: R^2, Adjusted R^2, Error, Lift, p-value, Odds Ratio, English Rules, Misclassification Rate
Healthcare Digital Transformation
In the context of future trends, digital disruption and digital transformation have perhaps the greatest potential to change markets more quickly than any other historical force. In Australia, an estimated one-third of companies are at immediate risk for disruption. Sectors such as finance, media, and information and communications technology are likely to experience the most immediate impact. As an advantage, sectors such as healthcare, which will also experience changes, have a longer timeline to react and to potentially learn about and more adequately prepare for the arriving change (Deloitte, 2017). In the U.S., Aetna recently announced plans to change their headquarters from Hartford, Connecticut to New York City. Aetna, a large health insurer, was founded in Hartford in 1853 and has been headquartered there for over 160 years. As part of the major change, Aetna’s CEO indicated that the relocation was necessary due to their need to increase innovation through younger knowledge workers and technologists (Zacks, 2017).
Digital change within an industry can be measured along a continuum of no change, minor change, some core change, mainstream, predominately digital, and fully digital. Currently, most industries, including healthcare systems and services, fall into some core change area, indicating the future potential for change (Bughin et al., 2017). Despite the warning of impending change, in a Cisco Global Center for Digital Business Transformation survey, nearly half of companies have not acknowledged or addressed the threat of digital disruption, with only 1 in 4 taking a proactive approach to transform themselves before others do (Bradley, 2015). Based on an Accenture survey, by 2020 up to 40% of incumbent businesses are expected to be displaced by digital disruption, despite the fact that the digital economy will still represent only 25% of the overall global economy with even more room to grow (Adonis, 2018, Knickrehm et al., 2016). Several decades ago, the healthcare industry began its digital transformation through the introduction of electronic health records (EHRs). Today, increasing technologies (such as gene sequencing, consumer tracking products, robotics, and analytics) promise to make major shifts (Hewlett Packard, 2016). These capabilities will enable the next phase of digital transformation in the digital experience era, which enables digitally empowered consumers (or patients) to integrate experiences across all channels, improving content, engagement, and personalization (Seebacher, 2015).
McQuivey (2013) defines digital disruption as the new and extended opportunity for more people than ever before to directly interact with customers at the lowest costs possible. Whereas people, along with infrastructure, equate to disruption, innovators, along with digital infrastructure, equate to digital disruption, with massive digital disruption to occur at a scale and pace that is largely unprepared for by organizations. Using technology enablers, the digital disruptors can directly reach the end consumers and bypass all the traditional obstructions. In this newly created environment, continuously finding ways to adapt to the customers’ requirements and to offer a better and more affordable solution is the ultimate goal and the essential key for successful disruption. Disruption creates the dilemma that companies need to face and decide upon: whether to create new and more affordable products, which might not always meet the existing customers’ quality expectations, or to continue improving on the existing products for generating better profits. As disruption takes place at a continuously increasing pace, it is anticipated to create new trends in customers’ expectations and reactions. Digital disruption increases the rate of competition and facilitates creativity with the cumulative effect of devastation to a company that operates under the norms of the previous century (McQuivey, 2013).
In healthcare, examples (such as FitNow, which is the producer of Lose It!, a personal fitness application) have proven that neither the size nor the tradition of a company matter when competing with a digital disruptor. Competing with traditional businesses like Weight Watchers and Jenny Craig, a team of eight employees and their new product Lose It!, attracted 10 million customers (Jan van Nouhuys, 2016). Digital disruption in healthcare represents nearly $9 trillion in potential value, and digital disruption is already occurring in several avenues of healthcare. However, barriers are present, including regulatory requirements, user adoption, and privacy and security (Newman, 2017).
Figure 11.24: Eras of Transformation in Healthcare

The first wave of digital technology change in healthcare was the adoption of electronic health records (EHRs) (Steger, 2014; Singh, 2017). This is considered the 1.0 era, where providers primarily in the 2000s, were adopting EHRs to improve quality and cost of care resulting in value of millions of dollars. The second wave includes SMACITR (social, mobile, analytics, cloud, IoT, and robotics and AI) technologies, and the shift to value-based care models, primarily in the 2010s. These digital technologies that make up SMACITR have great opportunity and potential within healthcare to reduce costs, improve efficiencies, and improve quality and healthcare value. Although valuable individually, when integrated, they can create additional benefits. Estimates in the U.S. health system from implementation of these technologies ranges from tens of billions to hundreds of billions of dollars in potential savings (Tiwari, 2016; ReportLinker, 2017; Collier et al., 2017; Ray, 2017; Deloitte, 2018). SMACITR technologies are an enabler and a transformer of the current business models to digitization, with the platform having the ability to increase the capabilities in a number of management areas. Transformations through SMACITR are already altering and changing the competitive environment. By 2020, there will be nearly 100 billion web-connected computing devices and nearly 2 zettabytes of data generated (Frank, 2013). IoT, for example, allows digital data exchange within a network of internet-enabled devices such as sensors. IoT is a key component of digital transformation within healthcare, as new business models are emerging, allowing improvements in patient outcomes and process improvements (Dimitrov, 2016; O’Brien, 2016; O’Brien, 2017). This is considered the 2.0 era, where stakeholders were adopting SMACITR technologies, resulting in a savings potential of billions of dollars.
The third wave includes the digital experience (DX) and transformation of healthcare delivery to include digital and non-digital capabilities primarily in the 2020s. This is considered the 3.0 era, with trillions of dollars in potential savings and capitalizing on the initial and ongoing investments from previous eras. The experience movement in healthcare emphasizes the human experience in which all beings care for others. It is embodied in every healthcare interaction in delivering the highest quality of care. The patient experience focuses on a core set of values, including accessibility, agility, innovation, inclusivity, and collaboration (Wolf, 2017). These values are also represented in the digital experience in which organizations are able to personalize digital experience solution to empower and engage patients with on-demand accessible information to improve patient outcomes.
Although nearly all of organizations claim to have a digital disruption strategy in place, the reality is that the exponential pace of change has created a capabilities gap within their organization. To improve capabilities, organizations can bring in new employees to act as catalysts for change, embed digital within the organizational culture, and be committed to digital. An example of a commitment is the appointment of a digital officer or dedicated staff members (Grossman, 2016). To address digital disruption, organizations might respond to minimize impact through three primary methods: 1) Improving legacy costs 2) Developing new revenue streams 3) Positioning corporate strategies (Deloitte, 2017). These methods provide a mechanism for increased agility within a changing environment and increased dynamic capabilities with the organization (Teece, et al., 2003, Deloitte, 2017). To be successful, organizations must capitalize on era 1.0 EHR and 2.0 SMACITR technologies to transform their business, to work directly with other organizations and customers, and to identify the processes where technologies can offer new strategic alternatives. Instead of focusing on technology first, organizations must focus on processes first, with the technology architecture following within the integrated process (Frank, 2013). Healthcare might arguably be the most complex industry for digital transformation (Sullivan, 2017). In order to enable digital transformation to improve the patient experience, healthcare organizations are recommended to include top leadership support, blending digital and physical experiences, using data and information assets for decision-making, and leveraging digital technologies for stakeholders (Sullivan, 2017). As a result of digital transformation, there is an ability to advance healthcare and improve patient outcomes and experiences. Similar to the 1990s, the 2020s are anticipated to be the beginning of another era of integration and significant change as a result of digital transformation in healthcare (Swartz, 2018).
Experiential Learning Application: Lifelogs
In Chapter 5, we introduced the concept of wearable technology, and, throughout the textbook, you have learned a variety of modeling techniques. In keeping with the learning approach of this book, for the final chapter experiential learning application, you will connect your knowledge from the prior chapters and complete an application on lifelogs.
An individual’s lifelog is the set of digital information gathered from his or her life through smart devices, sensors, social network information, and medical data. This information tracked over a lifetime is the encapsulation of Big Data and is used to find patterns in the complex lifelog of individuals and used for real-time healthcare services. Using smart devices, individuals can be measured for personal health information (such as exercise, sleep, stress, heart rate via electrocardiogram, and blood pressure) and are provided with personalized healthcare services based on the resulting analysis. Researchers have developed frameworks for using lifelog data for detecting emergency events through smart devices (Choi et al., 2016).
Wearable technology along with augmented reality are two key technologies that have been increasingly combined and used over the last several years. Surgeons have started to use wearable technology during operations and, combined with augmented reality, can help improve interaction between providers and patients. The technology would allow surgeons to view a virtual 3-D map of a patient’s internal organs without the need for an incision (Reynolds, 2017). There are many additional applications for wearable technology, such as in telemedicine and virtual examinations, as well as in education for healthcare professionals and patients through 3-D training tools (Govette, 2014; Govette, 2017). Shipments of wearable technology such as smart watches and glasses are forecasted to reach over 500 million devices with nearly $100 billion in revenue by 2021 (Wade, 2017). The first true wearable computer was invented and tested at a Las Vegas casino in the 1960s to help win at roulette. By using computers, the wearers were able to have superhuman capabilities as long as the technology remained hidden. A few years later, wearable technologies started to show up on people’s faces, and these wearables were designed to enhance the wearer’s ability to remember, record, and retrieve information. Recent wearable technologies that have generated significant interest and attention is Google Glass, an eyewear with connection to a smartphone, GPS, voice activation, and camera and video recording. Snapchat also has released Spectacles, an eyewear technology product that is similar to glasses, which allows users to take short videos or pictures, and to share them with friends or post online. These devices use demonstrated technology such as Wi-Fi, Bluetooth, Near Field Communication (NFC), and Global Positioning Systems (GPS) (Woodside and Reinhold, 2017).
A next generation of smart wearables involves smart clothing, which generates Big Data through tracking many physiological indicators. Health monitoring has a close relationship with Big Data due to ongoing monitoring capabilities, and assistance with reducing costs, and improved quality of healthcare. Application of smart clothing includes diagnosis, electrocardiographs, and emergency response. Given the future trends of population growth and aging, research indicates that wearable technology and smart computing as a potential solution to address the growing global shortage of medical facilities and personnel. Smart clothing and monitoring has applications for individuals living alone, children with autism, athletes, patients with depression, and pilots (Chen et al., 2016).
Smart devices can be used to monitor physiological signals and to alert medical professionals and medical centers of any emergency indicators. An emerging technology that is included within smart devices is the Internet of Things (IoT), which is the idea of an array of interconnected devices throughout one’s environment. For example, hospitals can use IoT for location tracking of patients, staff, and medical devices. The IoT devices can also be used with environmental monitoring (such as verifying temperatures of refrigerators and IT centers). Companies such as Stanley and the open-source Kaa project seek to improve IoT integration and connectivity (Govette, 2017). Smart devices and lifelog analysis are an option to address rising chronic conditions. Smart devices follow closely with Big Data from the lifelog data collection and the use of analytics on cloud-based data storage. Today, most healthcare systems are set up for acute disease care, but are not prepared for prevention of chronic disease. Based on a World Health Organization study, current health systems can provide a solution for only 10% of medical issues. As a result, in the U.S., over half of the population has one or more chronic conditions, which account for 80% of health spending or nearly $3 trillion annually on chronic diseases alone. Nearly 50% of medical issues are dependent on individual lifestyle habits, 20% is a result of the environment, and 20% is the result of heredity factors. Therefore, smart devices and surveillance are useful strategies for improving existing healthcare systems and for addressing medical issues. The collection of large amounts of data can be used to improve efficiency, to increase quality of care, and to prevent chronic diseases (Chen, et al., 2016).
A sample has been provided for you to get started. The lifelog data set includes 18 variables and 20,012 records.
Objective: Determine the physiological factors that cause an emergency indicator from smart wearables.
Data Set File: 11_EL2_Life_Logs.xlsx
Variables:
● Person_ID, unique identifier
● Person_Gender, (F=Female, M=Male)
● Person_Weight, in pounds
● Person_BloodType, (A, B, AB, O)
● Person_Height, in inches
● Time_Hour, 24-hour time
● Blood_pressure_systolic, mmHg millimeters of mercury
● Blood_pressure_diastolic, mmHg millimeters of mercury
● Pulse, beats per minute
● DeviceID, unique identifier
● Device Type, (Smart Cloths, Smart Watch, Smart Phone)
● Body_Temp, in degrees Fahrenheit
● Diabetes_YN, indicator (Y=Yes/True, N=No/False)
● Alzheimer_YN, indicator (Y=Yes/True, N=No/False)
● CardiovascularDisease_YN, indicator (Y=Yes/True, N=No/False)
● Obesity_YN, indicator (Y=Yes/True, N=No/False)
● Hyperlipidemia_Cholesterol_YN, indicator (Y=Yes/True, N=No/False)
● Emergency_Y/N, indicator (Y=Yes/True, N=No/False)
|
Title |
Lifelogs |
|
Introduction |
Provide a summary of the business problem or opportunity and the key objective(s) or goal(s). Create a new SAS Enterprise Miner project. Create a new Diagram. |
|
Sample |
Data (sources for exploration and model insights) Identify the variables data types, the input and target variable during exploration. Add a FILE IMPORT Provide a results overview following file import: Input / Target Variables Generate an HP DATA PARTITION |
|
Exploration
|
Provide a results overview following data exploration Add an HP EXPLORE Summary statistics (average, standard deviation, min, max, and so on.) Descriptive Statistics Missing Data Outliers |
|
Modify |
Provide a results overview following modification Add an HP IMPUTE |
|
Model
|
Discovery (prototype and test analytical models) Apply a regression, decision tree, and neural network model and provide a results overview following modeling. Add an HP REGRESSION Add an HP TREE Add an HP NEURAL Model description Analytics steps Model results (Lift, Error, Misclassification Rate) Selection Model |
|
Assess and Reflection |
ADD a MODEL COMPARSION Provide overall recommendations to business Model advantages / disadvantages Performance evaluation Model recommendation Summary analytics recommendations Summary informatics recommendations Summary business recommendations Summary clinical recommendations Deployment (operationalization plan: timeline, resources, scope, phases, project plan) Value (return on investment, healthcare outcomes) |
Learning Journal Reflection
Review, reflect, and retrieve the following key chapter topics only from memory and add them to your learning journal. For each topic, list a one sentence description/definition. Connect these ideas to something you might already know from your experience, other coursework, or a current event. This follows our three-phase learning approach of 1) Capture, 2) Communicate, and 3) Connect. After completing, verify your results against your learning journal and update as needed.
|
Key Ideas – Capture |
Key Terms – Communicate |
Key Areas - Connect |
|
Future Trends |
|
|
|
Digital Disruption and Digital Transformation |
|
|
|
Population and Consumer Changes |
|
|
|
Robotics and Automation |
|
|
|
Healthcare Globalization and Government |
|
|
|
Public Health |
|
|
|
Big Data Anamatics |
|
|
|
High-Performance Data Mining Nodes |
|
|
|
BEMO Process Steps |
|
|
|
SIDS Application |
|
|
|
LifeLogs Application |
|
|
Experiential Learning Application: Health Anamatics Project
From this textbook, I have shared my learning in hopes that these best practices will provide you with a competitive learning advantage for health anamatics in your career. Learning from others improves the efficiency of learning, and improving your current knowledge while connecting and expanding that knowledge to new knowledge is the key to long-term storage and lifelong learning. In Chapter 2 we discussed health anamatics and broccoli, now that you’ve completed this book, hopefully you have a renewed fondness of broccoli. Also consider if you have another 10, 20, 30, 40, or 50 years of career to go, how much learning you can gain, or helpings of broccoli that you can consume! As an even more appealing option, possibly consider the combination of health anamatics the same as combining your favorite foods like broccoli fries or broccoli ice cream!
You are now ready to apply and connect your learning and knowledge to new project areas in health anamatics. Below is a template to get started on a selected career project area.
|
Health Anamatics Project |
|
|
Part I: Topic Overview • 1-2 pages, single spaced • Provide an executive summary on the topic explored • Include 3 current industry technologies • Include 3 current industry examples • Develop a discussion question on the topic explored • Post the topic executive summary and discussion question to discussion board. |
|
|
Title: |
|
|
Executive Summary |
Topic outline Big Picture Overview Key messages/objectives/goals Technologies/Analytics (3) Industry examples (3) Outside sources (3) Discussion Question: |
|
Part II: Future Trends • 1-2 pages, single spaced • Develop a discussion question on the topic explored • Post summary and 1 discussion question to discussion board |
|
|
Future Trends |
Next 5, 10, 25 years Future technology/business/legislative changes Impact/opportunity Outside sources (3) Discussion Question: |
|
Part III: Final Project Document • 7-10 pages, single-spaced (includes Parts I and II) • Develop a health anamatics project for a selected organization and topic area |
|
|
Executive Summary |
Part I (use information completed in part I topic overview) |
|
Organization |
Name Industry General Environment Company Background Company Location |
|
Healthcare-Business Problem/Opportunity Event |
Who is the Decision Maker? What is the Decision to be Made? Business Question? When is the Decision to be Made? Why is the Decision important? |
|
Decision Point |
Problem-Specific Information (and alternative options) Technology/Analytics Options |
|
Discussion/Decision Questions |
Discussion/Decision Question 1: Discussion/Decision Question 2: Discussion/Decision Question 3: |
|
Data Set |
Data description and definitions Data Resources ● http://guides.lib.berkeley.edu/publichealth/healthstatistics/rawdata ● www.pewinternet.org/datasets/ ● https://www.cdc.gov/nchs/data_access/Vitalstatsonline.htm ● https://archive.ics.uci.edu/ml/datasets.html ● https://phpartners.org/health_stats.html |
|
Data Mining |
Data mining process (SEMMA, BEMO) |
|
Recent Developments |
What has occurred since the decision point to present |
|
Implications |
How should managers address this scenario? Best practices and recommendations |
|
Future Trends |
Part II (use information completed in part II future trends) |
|
References |
APA or MLA format Outside sources (10) |
|
Exhibits |
Financials Market Data |