
Information and communications technology sector in India
Abstract:
Information and communications technology (ICT) industry in India is one of the significant players in the global outsourcing industry and is also a source of national economic development. The chapter provides a detailed understanding of the Indian ICT industry on the basis of available data and secondary literature. It presents the historical evolution, size, and nature of the subsectors in the industry showing how the industry is predominantly services oriented and has a very minuscule manufacturing component. It shows that R&D investment in the industry is low, the patenting record is poor, and the R&D landscape is dominated by multinationals. The chapter finds that the industry is led by the top 20 large firms, half of which are multinationals. However, the global nature of this industry is resulting in R&D centers being set up in India, where India is increasingly becoming an innovation hub. On the other hand, established domestic firms are partnering with niche firms abroad to expand their R&D portfolio. The chapter concludes by listing the various challenges that the industry might face in the near future and offers relevant policy suggestions.
With an estimated population of 1210 million, India is the world’s second most populous country. According to India’s population census of 2011, almost 70% of Indians reside in rural areas, although in recent decades migration to larger cities has led to an increase in the country’s urban population. India’s literacy rate is 74.04% (65.46% for females and 82.14% for males).
With a CAGR of GDP of 7.14% between 2004–5 and 2009–10, the economy is among the fastest growing in the world. India’s GDP was USD948 billion in 2009–10. When measured in terms of purchasing power parity (PPP), India has the world’s third largest GDP at USD4.164 trillion. India’s per capita income (nominal) was USD810 in 2009–10, while in terms of PPP it was USD3339.
India’s sectoral GDP composition reveals the importance of the service sector to the economy. The service sector has been the main driving factor in the growth of the Indian economy, contributing 57.3% to total GDP in 2009–10.1 It is expected that services will play a major role in India’s growth in the future as well. It is in this context that the growth and importance of the Indian ICT sector has to be viewed.
Sector description and evolution
Information and communication technology (ICT) is an important emerging sector of contemporary India. ICT in India contributes to change at various levels – social, political, and economic. ICT has brought rural areas much closer to the markets and has improved business transactions. There has been an increased flow of information, thereby increasing productivity and innovation. There has also been an increase in the monitoring and accountability of governments through the use of ICT services.
The success of the Indian ICT industry is being imitated by many developing countries (Carmel, 2003; Heeks and Nicholson, 2002) as a tool for national development. However, access to detailed data on the Indian ICT industry is limited for researchers.2 Researchers (e.g., Chandrasekhar and Ghosh, 2008; Parthasarathi and Joseph, 2002) have repeatedly complained about the lack of adequate data for policy analysis of the industry. Data from the National Association for Software and Service Companies (NASSCOM), a trade association, are often used by both the government and researchers. NASSCOM treats business process outsourcing (BPO) as part of the ICT industry.
According to the NASSCOM strategic report for 2011, the Indian IT-BPO industry is estimated to achieve revenues of USD88.1 billion in financial year (FY) 2011, with the IT software and services industry accounting for USD76.1 billion of revenues. Direct employment in FY 2011 was expected to reach nearly 2.5 million, while indirect job creation was estimated to touch 8.3 million. As a proportion of national GDP, sector revenues grew from 1.2% in FY 1998 to an estimated 6.4% in FY 2011.
Most of the indirect employment absorbs the unemployed who are school-leavers, either with or without a school diploma. The revenue generated by the industry is also a driving factor for many other sectors in the country, especially real estate and retail. Apart from direct employment, the ICT sector is credited with creating the first generation of entrepreneurs and the growth of the venture capital industry in India.
The evolution of the Indian ICT sector can be mapped into approximately three phases: until 1984, from 1984 to 1990, and post-1990 (Parthasarathy, 2004). In the first phase, the state attempted to run the industry apart from trying to establish its own technological trajectories, which resulted in a sector with little commercial orientation. State intervention discouraged entrepreneurship and was inimical to foreign investment. In the second phase, the government realized that software was a viable option for income generation and technological capability enhancement. Restrictions were loosened but there was no vision for the industry, and lack of knowledge about the industry plagued the policy-making process. However, the end of the second phase saw the emergence of industry-friendly policy initiatives that were skewed towards software exports. In the third phase, the software export industry blossomed, aggressively promoted by both national and state governments. Consequently, the export-driven growth model ignored the hardware sector and the domestic sector, despite their huge potential (Parthasarathi and Joseph, 2002).
The success of the services segment of the Indian ICT sector is largely attributed to the availability of high-skilled technical labor for exports. Indian software services firms exploited the underutilized engineering talent produced after independence to meet rising global needs, especially from the U.S., which is the world’s largest consumer of software. India’s rise in the global ICT sector during the Y2K boom period is well documented (Balakrishnan, 2006; Parthasarathy, 2004). Two major developments served as catalysts: the exit of IBM in the 1970s left numerous machines in India that provided services opportunities to Indian entrepreneurs, and the establishment of Texas Instruments in 1985 in Bangalore enabled companies to execute designs whose subsequent success demonstrated the feasibility of providing software services using local capabilities. The influx of multinational corporations (MNCs) to establish offshore development centers put India on an IT trajectory that was independent of government impetus to the industry. Given the slim possibility of success in own brand products, many Indian firms moved into product development often via the development of products as a service (the “co-development of products). However, over time these centers have evolved as equal partners with the parent organizations.
According to Balakrishnan (2006) three types of Indian firms drove the Indian service sector: entrepreneurial firms started by professionals who were working for multinationals in the early 1980s (e.g., Patni Computer Systems and Infosys), ICT manufacturing firms that diversified into software (e.g., HCL and Wipro), and software divisions started by established industrial groups (e.g., TCS and Mahindra).
Recent research studies credit the late impetus provided by government policies (Balakrishnan, 2006; Sharma, 2009). Software technology parks (STPs) were introduced in 1991. Under the STP scheme, firms are allowed to import equipment without an import license or having to pay import duty. Similarly, equipment purchased from the domestic market is exempt from excise duty. Foreign equity up to 100% is permitted and firms are allowed to freely repatriate capital investment, royalties, and dividends after paying the necessary taxes. In return, there is an export obligation. Firms have to earn a net amount equal to 150% of the hardware imported within four years. They also have to earn a net amount equal to 150% of their wage bill on an annual basis. Although the STP scheme was meant for 100% export units, in January 1995 STP firms were allowed to sell up to 25% of the value of their exports to the domestic tariff area. The figure was revised to 50% in 1999 (Parthasarathy, 2004: 18). Also, firms registered under the STP scheme get income tax exemption on export earnings for 10 years.
Hence, policy orientation resulted in born-global firms. Though, the scenario is rapidly changing from providing low-end onsite services to high-end offshore services fueled by the reverse migration of Indians and by a greater realization that intellectual property creation is important, the Indian ICT sector is predominantly seen as a software service exporter. India also seems to be developing an edge in semiconductor design and embedded systems and has the potential of becoming an engineering design house for the world. Policy initiatives such as the IT Act 2000, Semiconductor Integrated Circuits Layout-Design Act 2000, and the National e-Governance Plan have helped in shaping the Indian IT landscape further. Firms such as Hewlett-Packard (HP), Microsoft, Motorola, and Siemens established research centers in Bangalore to specifically address the Bottom of the Pyramid (BoP) market. The Indian IT sector having benefited from the phase of learning through outsourcing has successfully moved from offering outsourced application development to working in other regions. In order to move up the value chain and become co-creators of products Indian firms are acquiring foreign-designed products through the takeover of niche firms based in North America and the U.K. in order to integrate products into their portfolio. It is important that Indian firms move from labor-intensive low-end services to high-end customized software and products for large customers in the industry and government.
There is no direct data available on region-wise revenue distribution of the industry. However, given the prominent presence of ICT firms in six clusters – Bangalore (Karnataka), Mumbai and Pune (Maharashtra), Chennai (Tamil Nadu), Hyderabad (Andhra Pradesh), and the National Capital Region which comprises New Delhi (Delhi), Noida (Uttar Pradesh), and Gurgaon (Haryana) – almost 97% of the export revenue comes from these regions (NASSCOM, 2009). A comparison of the major ICT clusters shows that the Bangalore cluster is the most mature ecosystem for the ICT industry (Balachandirane, 2007; Biswas, 2004; Khomiakova, 2007). Pune is smaller than Bangalore, but it is emulating Bangalore. The National Capital Region (NCR) is emerging as a business process outsourcing (BPO) center. Hyderabad and Chennai are late entrants, but due to aggressive policy initiatives they are supplementing the software requirements of other clusters. In industry terms, Bangalore is a development center, while Hyderabad and Chennai are production centers. Though subnational governments are making efforts to spread the ICT industry to Tier II and Tier III cities, desirable growth is yet to be seen (Hutchinson and Ilavarasan, 2008).
The subsectors
India’s ICT sector is dominated by services whose share has been steadily growing from 2000–1 to reach 94.2% of the total by 2007–8. On the contrary, ICT manufacturing has been going through opposite trends with its share in the total ICT sector falling from 10.5 to 5.8% during the same period. The contribution of the ICT service subsector to the GDP of the total service sector grew from 6% in 2000–1 to 10.5% by 2007–8. The increases have been steady, with the exception of a marginal decline in 2002–03 (Malik and Mundhe, 2010).
The manufacturing and services divisions of the Indian ICT sector have two different growth trajectories. The service sector, composed of computer-related services and telecommunications, has been growing at a steady rate compared with the manufacturing sector. India has adopted a “walking on one leg” strategy, in other words, overdependence on the exports of software services for revenue generation while ignoring the hardware manufacturing and domestic services industry (Heeks, 1998; Schware, 1992).
The gross domestic product (GDP) at current prices in India has gone up to INR43 209 billion (EUR758.17 billion) in 2007–8 from INR19 250 billion (EUR464.07 billion) in 2000–1, with a compound annual growth rate (CAGR) of 12.24%. ICT sector GDP has increased to INR2530 billion (EUR45.18 billion) in 2007–8 from INR656 billion (EUR15.8 billion) in 2000–01 with a CAGR of 21.3%. Within the ICT sector, computer-related services grew at a rate of 27.23% per annum between 2000–1 and 2007–8. The growth rate of the ICT manufacturing sector was only 11.4% per annum during the period. The share of the ICT service sector toward total GDP was 5.52% during 2007–8, which was only 3.05% during 2000–1. Within the service sector, computer and related services grew steadily with its share in total ICT services increasing from 46% in 2000–1 to 61% in 2007–8. It is also observed that the share of the ICT manufacturing sector toward GDP remains more or less constant with about 0.35% from 2000–1 to 2007–8. IT services exports increased from EUR5.93 billion (2003–4) to EUR20.20 billion (2008–9). The contribution of exports by the ICT sector has increased from 64.5% in 2004–5 to 66.1% in 2008–9. The export orientation of the sector, however, meant that the domestic sector remained neglected. The contribution of the domestic sector to the total ICT sector has decreased from 35.11% in 2004–5 to 33.89% in 2008–9 (Malik and Mundhe, 2010).
Manufacturing industries
During the mid-1990s, the sector shifted its focus to software from hardware. From 1991 onwards, the policy changed from an inward-oriented, state directed and controlled development strategy to a liberal economy that opened up to external competition and investment. Various issues with respect to tariff policy, export and import policy, specialized hardware manufacturing hubs, marketing the Made in India brand, inviting multinational electronics manufacturing/service companies to set up Indian operations, the development of semiconductor industries, patenting, etc. were taken up in order to bring reforms to this industry (Majumdar, 2010). After the WTO International Trade Agreement, India removed all customs duties on IT hardware by 2004, exposing local manufacturers to global competition. This resulted in consolidation of the sector with many local manufacturers turning into importers of foreign goods who started serving local demands. India remains a major importer of electronic materials, components, and finished equipment that amounted to around USD20 billion in 2007. The country imports electronic goods mainly from China.
During 2001–7, the production of computers and associated components grew at a compounded annual growth rate of 31%, the highest among electronic products in India. This was followed by communication and broadcast equipment (17%), strategic electronics (21%), and industrial electronics (20%) (IBEF, 2008). The growth in demand for telecom products has been high, with the growing use of mobile phones in India. The analysis of the telecom equipment industry by Mani (2005) offers some insights on how the local manufacturing industry declined despite the technological capabilities of government research labs. Local manufacturers were dependent on the government research lab – the Center for Development of Telematics (C-DOT) – which was working on circuit-switching technology oblivious of the emerging packet-switching technology (Mani, 2005: 4277); it was unable to handle open competition after the 1990s.
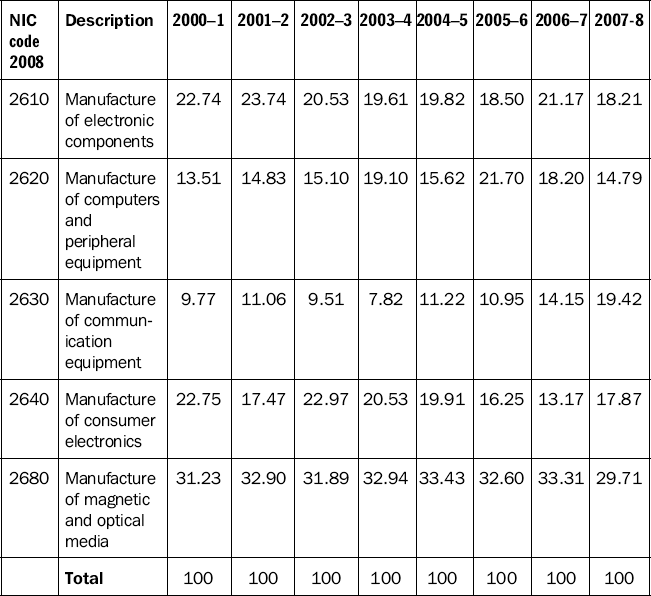
During 2007–8, organized ICT manufacturing industries contributed about 4% of the total manufacturing sector in terms of Gross Value Added (GVA). ICT-organized manufacturing GVA (at current prices) increased from INR69.4 billion in 2000–1 (EUR1.67 billion) to INR147.6 billion (EUR2.5 billion) by 2007–8, with a CAGR of 13.4%. The share of the ICT manufacturing sector in the total manufacturing sector has fluctuated a little over the years but it has reduced from 2.3% in 2000–1 to 2.1% in 2007–8.
Within manufacturing, the manufacture of magnetic and optical media (2680 of NIC 2008) had the largest share (about 30%) in total ICT-organized manufacturing GVA in 2007–8. The manufacture of communication equipment (2630 of NIC 2008) had the lowest share (less than 10%) in 2000–1 but it increased consistently over time to reach 19.5% by 2007–8. This steady increase in the manufacturing of communication equipment can be attributed to high growth in the telecommunication industry in India. Table 1.1 summarizes the distribution and evolution of ICT manufacturing GVA by industry.
ICT services
The ICT service subsector has been the key driver of growth in the Indian ICT sector. In the period 2000/1–2007/8, its annual growth rate has been hovering between 23 and 26%. In absolute terms, its GVA increased from INR587 billion in 2000–1 (EUR14.15 billion) to INR2.4 trillion (EUR41.8 billion) in 2007–8.
The contribution of the ICT service subsector to the GVA of the total ICT sector exceeded 94% in 2007–8. Therefore, its growth basically determines the growth of the whole ICT sector. The contribution of the ICT service subsector to the GDP of the total service sector grew from 6% in 2000–1 to 10.5% by 2007–8. Within the ICT service subsector, the share of telecommunications (communication) has declined. In 2000–1 its share in total ICT services was 54.1% but it had declined to about 39% by 2007–8. On the other hand, the share of computer-related services increased from 45.9% in 2000–1 to 61% in 2007–8. In absolute terms, the GVA of telecommunications grew from INR317.8 billion (EUR7.6 billion) in 2000–1 to INR930.7 billion (EUR16.3 billion) in 2007–8, with a CAGR of 14.4%. The GVA of computer-related services increased from INR269.3 billion (EUR6.5 billion) to INR1.5 trillion (EUR25.5 billion) during the same period, with a CAGR of 23.4%.
Telecommunications services
The results of liberalization have been impressive. Teledensity has increased from merely 2% or so in 1999 to around 76.86% in 2011 (TRAI, 2000, 2011) and almost 6–8 million mobile subscribers are added every month. The total number of telecom subscribers in the country (wireless and wireline) as of end December 2011 stands at 926.53 million. Wireless has been the principal engine for telecom growth in the country. The wireless subscriber base3 has grown from 0.88 million in 1999 to 893.84 million in 2010–11. Given that the mobile sector grew at the compound annual growth rate (CAGR) of 84.01% in the last decade, the telecom subscriber base has outstripped what was envisaged for the 11th Five Year Plan ending in 2102.
While India has achieved immense success in voice communication, the penetration of the Internet and broadband has remained low, mainly due to a limited spread of wireline. India’s broadband story has not, so far, been impressive. China and the U.S.A. had about 120 million and 85 million connections, respectively, by June 2010 in comparison with India’s 13.35 million. However, of the 22.39 million Internet subscribers in India 61.1% are broadband subscribers.
Auctions for 3G and BWA Spectrum were postponed several times and the Indian success in voice has not been replicated in broadband yet. But the launch of 3G services was expected to set the stage for the rapid spread of broadband after the auctions finally took place in April, 2010. The absence of meaningful applications, language barriers, and other demand side factors also explain the slow uptake of Internet and broadband (TRAI, 2010).4
By March 2007, the stock of capital investment in the telecom sector reached INR2346.87 billion (EUR40.4 billion). The total revenue of the telecom sector in 2008–9 was INR1523.60 billion (EUR23.4 billion) and accounted for 3.09% of GDP at current prices. The Earning Before Interest, Tax, Depreciation, and Amortization (EBITDA) of the telecom companies at the end of 2006–7 was INR391.67 billion (EUR6.7 billion) and the EBITDA margin was 37%.
Malik (2007) in her study shows that competition-induced decline in tariffs (and, hence, increased affordability) resulted in the wireless telephony boom in India. Tariffs reduced by up to 35% during 2003–4. International private-leased circuit (IPLC) charges decreased by 35% for low capacity and 70% for higher capacities. The Indian case study clearly demonstrates that competition can deliver, and hence should be fostered by regulation and policy (Malik, 2010).
The Indian case provides an interesting case study of innovation with the budget telecom model or “bottom of the pyramid” (BOP) model. Growth is driven by services – a real “service revolution” with unusual innovations.5 The low prices and high use of the telecom network in India point to the core explanation for the success of connecting billions of people in the past decade. It is the discovery and application of an entirely new business model in South Asia: the “budget telecom network model”, akin to the budget airline model implemented by the likes of Air Asia and Ryan Air.6 The model is based on prepaid wireless and is fitted to meet the demand of the poorest segment of customers; its output is truly impressive, the lowest mobile rates in the world.
Computer services and software (CSS)
The computer software and services industry was worth INR1337 billion (EUR24.7 billion) in 2005–6 and was estimated to increase to INR3483.30 billion (EUR55 billion) in 2010–11. Most of the revenue comes from exports. Computer software and services exports were INR1041 billion (EUR19.3 billion) in 2005–6 and was estimated to increase to INR2696.30 billion (EUR42.55 billion) in 2010–11. Exports as a proportion of total output maintained a share of around 78%. India exports software to 95 countries, among them the U.S.A., U.K., France, Germany, Japan, China, South Korea, Taiwan, and Hong Kong (DIT, 2011).
Of the total software and services exports of EUR42.55 billion, IT services of EUR24.16 billion accounted for 56.7% of exports. Software products and engineering services of EUR8.15 billion accounted for 19%. The bulk of the exports are enterprise applications, followed by technology software.
In software and services most of the revenue comes from on-site services, where Indian firms send workers to client sites abroad on an hourly basis, which is known as body shopping. Offshore services form a small proportion of total revenues. In these projects, Indian programmers go to the client’s office only during integration. The higher revenue contribution from onsite services suggests that is it composed of low-end activities like maintenance and testing of existing client software rather than high-end software services driven by intellectual property blocks and patents. In terms of geographical concentration, most of the revenues are generated from the U.S. Among the industry domains, banking, financial services, and insurance (BFSI) constitute more than the others (Table 1.2).
Table 1.2
Indian ICT industry structure 2007–8
| Description | Details |
| Revenue (USD billion) | Software and Services – 52 Hardware – 12 |
| Revenue (USD billion) | Business process outsourcing/ IT-enabled services – 12.5 Software services – 40 |
| Major export destinations in percent of composition | US – 60%; Europe – 32% |
| Composition of industry verticals in exports | Banking, financial services, and insurance – 41%; Hi-tech/telecom – 20% Manufacturing – 17% |
| Share of top six Indian ICT geographical regions | 97% |
Source: NASSCOM (2009).
In the late 1990s, Indian software firms diversified into providing backend services, also called information technology-enabled services (ITES) or BPO, that are equally successful. However, the ITES sector is smaller than the software service sector. This unevenness in services exports makes the industry vulnerable to global market fluctuations. For instance, changes in temporary visa legislation in the U.S. would have a negative impact on the revenue flow of the on-site-dominated industry. Due to the current slowdown, banking and financial segments have been affected, resulting in a decline in revenues for the entire industry.
Research and development
Until the 1990s, the Indian economy was under state control and there was little incentive for private industry to invest in R&D. The science and technology system in the country was mostly driven by state-run research institutes and research laboratories without any pressure to compete at international levels. Sea changes happened after the economy was liberalized in the 1990s. Domestic players faced global competition from MNCs on their home turf, and the need to invest in R&D was tremendous. State-run research institutes and laboratories were asked to generate their share of revenues through commercialization and to showcase their capabilities through patents (Pattnaik, 2005).
R&D expenditure
The overall level of R&D investment in the ICT sector is low. Total GERD in India reached some EUR3.8 billion in 2004 representing around 0.7% of GDP, from 0.58% in 1990–1 and growing to 0.89% in 2005–6 (see Table 1.3).7 Banerjee (2009: 136) in addition states that “both in nominal and real terms, there has been a decline in the overall GERD and the GERD to GDP ratio has declined during the post reform period” and observes that the business enterprise sector shows sharp BERD increase, but still at only 20% of total GERD.
Table 1.3
Indian ICT R&D expenditure profile (2004)
| Total GERD | EUR3.8 billion8 |
| Total GERD/GDP | 0.69%9 |
| Total BERD | EUR0.76 billion |
| ICT BERD | EUR0.27 billion |
| ICT BERD/Total BERD | 35.9% |
| ICT R&D employment | 15 000 persons |
Source: Adapted to euros from data in Malik and Ilavarasan (2011).
There are two sets of players in India who perform ICT R&D activities: large domestic players and subsidiaries of multinationals. Large domestic players undertake two kinds of innovative activities: internal and external. Internal activities help in service delivery process improvement and are consumed by the firms themselves. The amount spent on these activities is not shown by the firms. The compilation by independent academic researchers shows that R&D expenditure by Indian firms is very low.
The second set of activities is performed for external clients who outsource their product development activities. In industry terms these are called “engineering services and R&D and software products” and are listed as high-end work. They contributed USD8.6 billion in 2008 and constituted around 13% of total industry revenues in 2008–74% of engineering services and R&D and software products are exported. However, the revenue generated from software products or licensing of software intellectual property blocks by firms in India is small, with only USD1.1 billion of the total revenues of the industry and USD64 billion in 2008 (NASSCOM, 2009).
Patents
Data on patents by the Indian ICT sector is minimal, but analysis by independent researchers and trade press reports show that more patents were awarded to multinational firms than to Indian firms. For instance, Nollen (2004) showed that in the years 2001–3, only four U.S. software patents were awarded to Indian firms compared with 118 patents awarded to U.S. and other foreign firms operating in India. Evidence by Dataquest (2008) reinforces this view (Table 1.4).
Table 1.4
| Firm | Patents granted in 2008 | Patents granted in 2007 |
| HP (multinational) | 50 | 77 |
| Infosys | 2 | 0 |
| TCS | 17 | 3 |
| Sasken | 5 | 6 |
| Subex | 8 | 4 |
| i-flex | 0 | 0 |
| Mindtree | 0 | 0 |
Note: This table is indicative, as the list is not exhaustive. Texas Instruments India Center, one the the top patent filers, is missing from this list.
Source: Adapted from Dataquest (2008).
On traditional measures like patents or copyrights, most of the innovation in India is done by multinationals rather than Indian firms. However, Indian ICT firms, especially those in the services domain, had experimented with products. Almost all the leading domestic software firms had products in their offering when they started operations. The focus on the product segment lost steam as the growth of the domestic industry was inadequate, the distance from end users in foreign markets was long, funds were lacking to market the products, and heavy expenditure was needed to evolve the product according to market demands (Athreye, 2005; Sharma, 2009). In addition, the high demand for software services in the U.S. resulted in Indian firms shifting their focus to the export services domain. Subsequently, innovation among Indian firms is targeted towards process innovation that enhances service delivery efficiency.
The role of foreign direct investment (FDI) in ICT R&D
Foreign direct investment (FDI) followed three successive stages in India. In the 1980s, the first set of firms came to India to exploit the local market. For instance, Suzuki (Japan) was the first major automaker to collaborate with the Indian government, followed by all major players of the world. The second stage, in the early 1990s, saw the entry of large software houses in India, either directly or through joint collaborations driven by globalization of the ICT industry. The third stage, in early 2000, is marked by the entry of R&D centers being established by already entered players or new players (TIFAC, 2006). IBM and Microsoft starting their research labs in addition to their existing software development centers is an example of the third stage.
In 1998–2003, in the list of the top 100 firms by R&D investment and country analyzed by TIFAC (2006: 5), the U.S. leads the list with 53 firms followed by the U.K., Japan, and Germany with 7 firms each. Other countries that have a presence are Switzerland, Sweden, South Africa, Norway, the Netherlands, Mauritius, Denmark, Canada, and Australia. During the same period, R&D investment worth USD1.13 billion flowed into India. Irrespective of the technological domain, Bangalore is the preferred location among investors.
Among the ICT firms that invest in R&D centers in India, U.S. companies dominate. An attempt (Ilavarasan, 2010) to understand the nature of ICT R&D centers in India reinforces this opinion. Investment from European Union countries is very low. Of 160 ICT multinationals that have R&D centers in India, U.S. firms have 73%.
There are multiple reasons for the U.S. dominance in the number of R&D centers. The U.S. is the major consumer of software services that originate from India. Firms that explored the Indian market for offshoring are from the U.S. Also, historically, high-skilled Indians migrated to the U.S. for higher studies, and later stayed to work in the high-technology sector. The reverse migration of Indian immigrants, who connected demand in the U.S. with the supply in India through their professional networks and understanding of market and technology, helped the industry cement sector linkages between the U.S. and India in the ICT sector (Saxenian, 2002; Sharma, 2009). Apart from market conditions, English is an important reason. Indians’ exposure to English at the school level is instrumental in bringing U.S. customers closer to them compared with other languages in the world.
Non-U.S. firms coming to India, either to offshore or to invest in R&D centers, have generally followed U.S. firms after observing the demonstration effect of successful U.S.-based multinationals. An analysis of secondary data showed that most multinational firms come to India to use low-cost high-skilled labor and continue working on activities delegated by their headquarters. Over time, the India center gains confidence and starts undertaking high-skilled work from the parent firms (Ilavarasan, 2006, 2010). Also, India offers a strategic location as it is close to emerging markets like countries of the Middle East and East Asia (Engardio, 2008).
On the nature of activities performed in the R&D centers of ICT firms – adaptation to the local market, or design and development of products for foreign markets – Ilavarasan (2010) offers some insights. Using content analysis of secondary material available on 160 sample firms, Ilavarasan (2010) found that the R&D centers of ICT multinationals appear to be divided into two halves, with 50% serving as centers-for-globals (where designs made at firms’ headquarters are executed in host countries like India) and 46% as local-for-globals (where local expertise in host countries is utilized to design for multinationals). A small number of centers (4%) are established as local-for-locals (where multinationals develop products using local expertise at the host countries).
The nature of R&D centers suggests the higher level of critical work happening in India and growing importance of India in the global strategy of ICT multinational enterprises (MNEs). The transition from center-for-globals to local-for-globals indicates the growing importance of India as a location for technological activity.
In the case of telecoms, the growth is driven by domestic investment, with only USD3.85 billion coming from FDI between 2000–1 and 2008–9. The FDI in telecom was around 5% of total telecom investment in 2006–7. Unlike many countries in the region, FDI in telecom accounted for only 5.17% of total FDI flows to India in 2007–8, which rose to 9.54% in 2008–9.
Offshoring
Overall Indian investment in foreign countries either as joint ventures or wholly owned subsidiaries has not been small. Outward FDI (investment by Indian firms) has increased from USD13.7 billion in 2009–10 to USD16.84 billion in 2010–11. The financial, insurance, real estate business, and business service sector has been the leading contributor to FDI outflows with USD6.63 billion followed by manufacturing with USD5.04 billion (Khan, 2012).
With respect to ICTs, given the poor focus on the domestic sector as a whole and the hardware sector in particular, investments by Indian ICT firms might be in the area of services and might be much lower than in other industrial sectors. A trade association report (NASSCOM, 2009) says that the contribution of the Indian ICT sector to outward FDI, measured through values of mergers and acquisitions (M&A), is significant with 11% in 2008, which doubled that of 2007. While Indian companies expanded into geographies other than the U.S., the pace was somewhat muted (NASSCOM, 2009: 76). Though Indian firms are willing to undertake the acquisition route for growth (Economic Times, 2009) they face challenges in terms of differences in valuation and culture.
In the ICT sector M&A deals differ depending on the size of the firm. Large firms acquire firms because they need niche domain expertise for their current offering; achieving significant scale is not their priority. Second-tier firms acquire firms both to achieve a larger scale of operations and to gain niche expertise. The third set of smaller firms looks for similar smaller players to enhance their niche technology strength (De, 2006). Though Indian firms are expanding their global reach and technology domains in service through acquisitions, it is difficult to conclude that R&D capabilities have been acquired.
The Indian ICT sector: company-level perspective
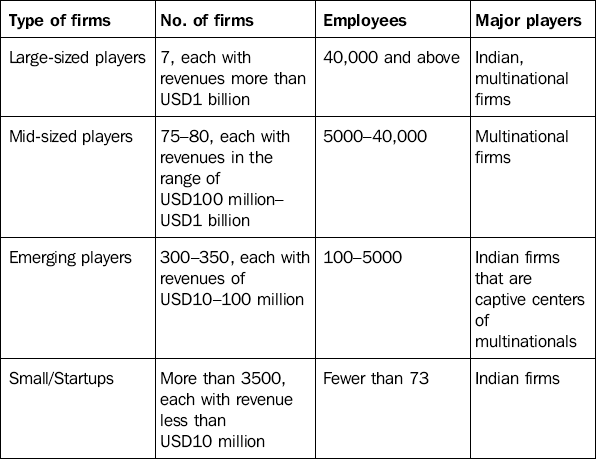
The composition of the firms in the industry is given by NASSCOM (2009), which divides firms into four categories based on the number of employees and revenue: large-sized players, mid-sized players, emerging players, and small/startups (Table 1.5). The major drawback in the NASSCOM data is the lack of detail on firms and ICT subsectors. Also, data on industry composition is drawn from “annual reports, press articles and company presentations” (p. 53).
The industry is dominated by the larger players with the top 200 firms contributing 95% of total revenues (Dataquest, 2012). Of the top 200 firms, the top 20 firms account for about 64% of the total revenue, the next 30 firms constitute about 17%, and the next 150 constitute about 20%. Of the top 20 firms, 11 are multinationals operating in India (Dataquest, 2012). The list of top 20 firms is given in Table 1.6.
Table 1.6
Top 20 firms in terms of revenue
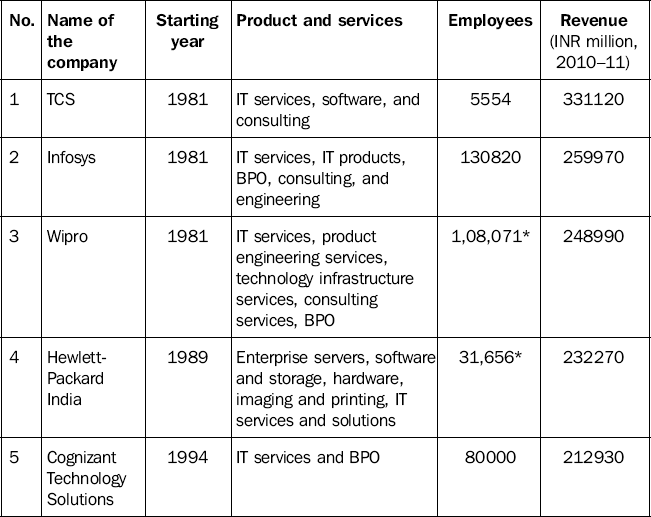
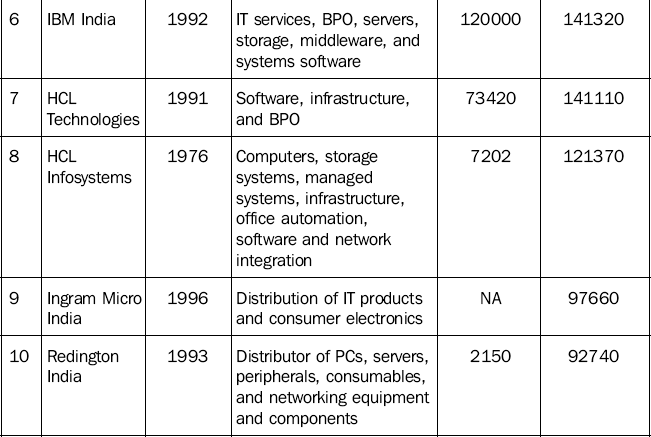
*Note: As of 2009–2010.
Source: Author’s compilation from Dataquest (2012).
Conclusion
India’s presence in the global ICT market is significant though it is plagued by a lack of conventional R&D efforts in addition to the overreliance on exports. The industry is able to sustain itself through innovations specific to the Indian context. Some of them include transition from on site to off shore; sending programmers for project execution at the client’s site to execute and manage projects in India; productized services, in which Indian firms standardize the services provided to clients and sell them as productized services at a level below off-the-shelf products; virtual extension, in which Indian firms serve as subcontractors but interact with primary clients directly; and human capital capacity building to bridge skill gaps. Innovation in business processes (like prepaid cards or operators loading their networks with high volumes of revenue-yielding minutes of usage because they had succeeded in reducing the transaction costs of dealing with low-volume customers) is crucial in explaining the success of the Indian telecom sector as well. Innovations such as tailoring tariff packages in line with the affordability profiles of Indians and also outsourcing infrastructure development to firms like IBM and Ericsson (which includes management of IT infrastructure) were the first of their kind and are becoming a global trend.
Firms in the Indian ICT sector will face challenges in the coming days as the government is phasing out the tax incentives provided under the Software Technology Parks of India scheme (1991). Subsequently, the cost of operations will increase as the firms need to pay tax and, with the rising cost of infrastructure and labor, cost advantages will be eroded. New alternative destinations will compete with India on low-end segment domains. China is slowly making inroads into the service sector and making tremendous efforts in closing the English language gap which is at present advantageous to India.
The challenges can be overcome by upgrading service offerings in high-end technology domains where the learning curve is steep and competition is less fierce. Large service firms are exploring other developing countries to tap into cheaper human capital and to be close to the prospects of setting up branches there. This move has yet to bring the desired results, but is expected to be successful in the near future. The domestic industry is gradually growing and is expected to grow faster as ICT expenditure by other industrial sectors is increasing. There will be increased interest among domestic firms to exploit the domestic sector in addition to exports. There is the possibility of developing more software products that cater to the domestic market which, in turn, will be sold to similar global markets.
The Indian IPR regime is getting stronger with revised laws and regulations. As the country will offer a secure environment for innovations, there will be an increased move towards high-value activities in the innovation chain by multinationals and their collaboration with local firms. This collaboration will result in knowledge diffusion and an overall conducive environment for innovation. Innovation in those ICT segments that cater to the mass market, like travel portals and mobile phones, are increasing and providing opportunities for e-commerce that was quite underdeveloped until recently. Cash on delivery, for instance, has overcome the apprehensions of Indian consumers when it comes to the use of credit cards and hence changed the business models of many e-commerce activities. Once FDI in multibrand retail is allowed this segment of ICT services will see manifold growth. However, there will be severe competition for high-skilled labor, which, in turn will slow down active R&D activities. The amount of high-skilled labor (i.e., PhDs) is inadequate for R&D demand. As existing graduates are absorbed into the industry, there will be fewer people to join research programs, thus affecting supply in the near future. There are other constraints too that the Indian IT ecosystem needs to address urgently to transform India into the next phase of ICT R&D. In addition to poor research output from the higher education system lack of dynamism in the government R&D system with limited scope and impact of government support programs for R&D has meant that public funding for R&D has been meager. Moreover, with weak university-industry alliances there has been no institutional environment to facilitate the sharing and circulation of ideas resulting in poor knowledge diffusion.
The telecom growth story has to be extended beyond voice to data services. This requires enabling mobile as the delivery platform for data services. The mobile phone has the potential to be a platform that can provide mass access to a wide range of socially and economically beneficial services. In the absence of computers and other devices for accessing the Internet, more and more Indians are using mobile phones to do so. A large percentage of mobile subscribers can access the Internet through their mobiles. Even now about 274 million mobile subscribers (actual subscribers – not just SIMs) in India are capable of accessing data services including the Internet through their mobile handsets. However, most of these are on 2G mobile networks with limited data capabilities. This augurs well for broadband if the operators are able to replicate the business model that worked so well for the low average revenue per user (ARPU) in the voice market in the market for data as well, where mobile will be the platform for Internet access with 3G technology.
The Indian ICT innovation landscape, on the one hand, requires India to become one of the head offices of the world – graduating from the back office, innovating new products and techniques, and providing higher value added services in this changing environment, which includes growth areas such as cloud computing, security, and privacy. On the other hand, India needs to innovate much more cost effectively to produce products and services that are affordable by people on low incomes without compromising the safety, efficiency, and utility of the products. Balancing this would require strengthening the innovation ecosystem that can serve both these objectives. One way of doing this could be through policies that encourage the setting up of research labs in India. Some of this has already started happening with firms such as Hewlett-Packard (HP), Microsoft, Motorola, and Siemens, which have established research centers in Bangalore to specifically address the BOP market. On the other hand, product companies abroad are in long-term partnerships spanning the entire life cycle of products with vendors such as HCL, Wipro, Patni, and also mid-tier companies such as Mindtree and Persistent. Some promising signs of the latter development is that overseas clients are handing over the entire product life cycle responsibility to vendors from conceptualizing the product, designing the technology architecture, delivering the integrated product, and co-developing the marketing strategy.
1.The service sector according to the official data comprises trade, financing, insurance, real estate and business services, community, social and personal services, transport, storage and communication, and hotels and restaurants.
2.Firm-level data in the NASSCOM annual directories are not available beyond 2003. NASSCOM provides only aggregate data and limited industry details. The statistical framework of the government is also inadequate to fully capture the ICT economy (for details see Chandrasekhar and Ghosh, 2008). Recently, the Ministry of Statistics and Programme Implementation (MoSPI), Government of India (GoI) has made one such attempt, in which it formally compiles and presents systematic and internationally comparable data on the ICT sector from extant official data. But access to the disaggregated data is yet to be made available.
3.This subscriber base is counted based on subscriptions (i.e., mobile numbers). If someone has two SIMs, he is being counted twice in all these numbers.
4.TRAI (2010) Recommendations on National Broadband Plan. Available from http://www.trai.gov.in/WriteReadData/trai/upload/Recommendations/124/Broadbandrecommendation08_12_10final.pdf Accessed on February 25, 2011.
5.Rohan Samarajiva, Founding Chair and CEO, presentation at the IPTS conference Asian Rise in ICT R&D.
6.Nokia (2008a) Affordability key in bringing digital inclusion. Expanding Horizons, 1, 12–13; Nokia (2008b) A roadmap to affordable mobility in emerging markets. Expanding Horizons, 4, 4–7.
7.See the IPTS annual report on R&D expenditures. The 2010 report on R&D in ICT in the European Union is available from http://is.jrc.es/pages/ISG/PREDICT.html
8.In Banerjee (2009), GERD = EUR3.2 billion for 2002–3.
9.Stated to be 0.8% (with no reference year) in OECD (2010b).