
South Korea
Abstract:
This chapter discusses the characteristics, R&D expenditures, patents, and globalization of the ICT sector in Korea. Korea’s strength in the ICT manufacturing sector, R&D inputs, and quantitative R&D output shows a stark contrast to its weakness in the software sector, qualitative R&D output, and globalization of the ICT sector. Various statistics for the ICT sector such as R&D expenditure, the patent impact index, technological strength, the technology balance of payments, inward and outward FDI, and the R&D outsourcing index are provided and cross-country or crossindustry comparison is given. Firm-level analysis of R&D activities in the ICT sector is given and statistics such as CR5 and CR10 for ICT R&D expenditures and R&D intensity are provided. Detailed explanations of the R&D activities of the two most renowned ICT manufactuing firms in Korea – Samsung Electronics and LG Electronics – are given. The need for Korea to break away from a large company-oriented, HW-centric, less globalized ICT innovation system to one that is SME focused, SW centric, and more globalized is emphasized.
Introduction
The Republic of Korea (South Korea) is a small country on the far eastern edge of Asia with a population of 48.87 million (2010), and ranks 109 in the world in terms of land area (100,032 km2).1 In the 1960s, GDP per capita was comparable with levels in the poorer countries of Africa and Asia. However, by 2011 GDP had reached an estimated USD1.116 trillion.2 However, South Korea had one of the world’s fastest growing economies from the early 1960s to the late 1990s, and remains one of the fastest growing developed countries in the 2000s, along with Hong Kong, Singapore, and Taiwan, the other three Asian tigers.
In 2004, South Korea joined the trillion dollar club of world economies, and currently is among the world’s 20 largest economies. South Korea has a market economy which ranks 14 in the world by nominal GDP and 13 by purchasing power parity (PPP), identifying it as one of the G20 major economies. It is a high-income developed country and is a member of OECD. It is the most industrialized member country of the OECD.3 The country ranks 1 for shipbuilding.
Size of ICT sector
ICT sector overview
The Korean ICT sector contributed in a major way to the country’s economic growth. From 2000 to 2010, the Korean economy grew at an annual rate of 4.7%, of which 1.2 pp was due to growth in the ICT sector. In other words, more than one quarter of Korea’s economic growth from 2000 to 2010 was attributable to growth in the ICT sector. During this period, the ICT sector grew at an annual rate of 13.4%, which was considerably higher than that of the non-ICT sector at 3.8%. The ICT sector accounts for almost one third of total exports and has a trade surplus. In 2010, ICT exports exceeded USD150 billion, accounting for 29.8% of total exports. It is expected that ICT exports will continue to grow as a result of increased market share in the global memory and LCD market and the good performance of domestic companies in the global smartphone market. From 2000 to 2010, the ICT sector recorded an accumulated trade surplus of USD484 billion, whereas the non-ICT sector recorded an accumulated trade deficit of USD286 billion. Also, the ICT sector has made a contribution to price stability. The ICT consumer price index and the ICT producer price index declined by 4.5 and 5.7%, respectively, from 2000 to 2010, whereas the indices for the whole industry rose by 3.1 and 2.4% for the same period.
In the Korean economy, total factor productivity (TFP) growth, which is calculated by subtracting the economic growth rate caused by increases in labor and capital from the actual economic growth rate, has been led by the ICT sector since the 1990s. From 1991 to 2009, the TFP of the Korean economy grew at an annual rate of 0.81%, whereas the TFP of the ICT industry for the same period grew at an annual rate of 11.9%, which contributed to the 0.97 pp annual increase in TFP of the whole industry. In other words, the non-ICT sector drove down the TFP of the Korean economy by 0.16 pp annually over the same period.
Table 3.1
TFP growth rate for ICT and non-ICT industry (%)
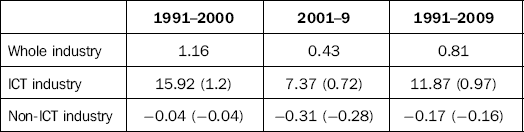
Notes: 1 Domar weights are used to combine industry-level, gross output-based total factor productivity to higher level aggregates.
2 Numbers in parentheses denote the contribution to TFP growth to the whole industry.
Source: Korea Productivity Center’s Total Factor Productivity Database.
The rate of TFP growth of the Korean ICT industry since 1991 is quite high even compared with other ICT powerhouses. According to the Korea Productivity Center (2010), the TFP growth of the Korean ICT industry for the period of 1991 and 2007 outperforms that of ICT powerhouses such as Finland, the U.S., Japan, the U.K., and Germany.
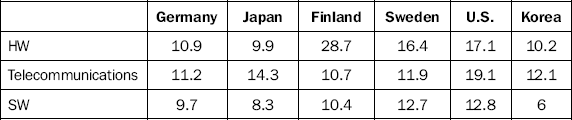
The Korean ICT industry has a distinctive characteristic of being centered on information and telecommunications equipment and ICT hardware. In 2008, the value added of the hardware industry accounted for 4.7% of GDP, which was the highest level among OECD countries. With the exception of Finland and Japan, most other countries have higher value added for the SW industry than that of the HW industry. However, the value added of the software and computer-related services industry in Korea, however, was less than one third that of the ICT hardware industry in 2008.
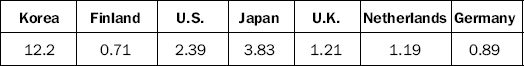
Table 3.3
ICT industry’s share of value added in GDP as of 2008 (%)
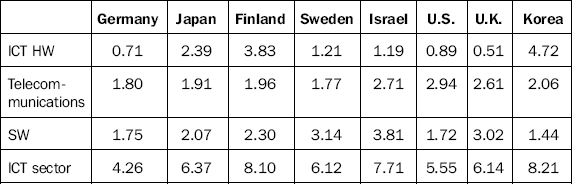
Note: 2007 data are used for Japan and the U.K. ISIC Rev. 3 is used for ICT industry classification. HW includes manufacture of office, accounting, and computing machinery (30); manufacture of radio, television, and communications equipment and apparatus (32). Telecommunications includes post and telecommunications (64). SW includes computer and related activities (72).
Table 3.4
Value added of the ICT industry as of 2008 (USD100 million)

Note: 2007 data are used for Japan and the U.K. ISIC Rev. 3 is used for ICT industry classification. HW includes manufacture of office, accounting, and computing machinery (30); manufacture of radio, television, and communication equipment and apparatus (32). Telecommunications includes post and telecommunications (64). SW includes computer and related activities (72).
Source: OECD STAN Database.
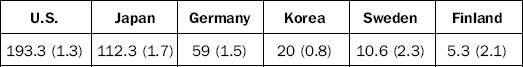
In terms of absolute size, the Korean ICT hardware industry is larger than that of the U.K., Germany and Finland, while the size of its software industry is much smaller than that of the U.K., Germany, and Sweden. The value added of the U.S. and Japanese software industry are, respectively, more than 20 and 8 times greater than that of Korea.
The Korea Communications Commission (KCC) – together with the Ministry of Knowledge Economy (MKE), the Korea Association for ICT Promotion (KAIT), and the Korea Electronics Association (KEA) – publishes annual and monthly data on ICT production. According to the statistics, Korea’s ICT production grew at an annual rate of 9.4% from 2000 to 2010. As for growth rates by industry, the broadcasting and telecommunications convergence services industry, which includes the IPTV service and digital contents production, had the highest, while the telecommunications services industry, which includes the wired telecommunication service with the most saturated market, had the lowest.
Table 3.5
ICT production trend in Korea (KRW100 million)
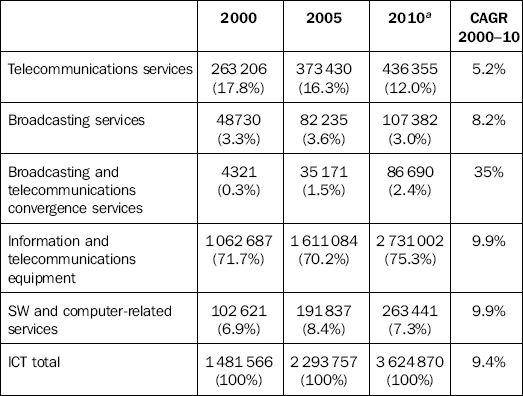
aValues for 2010 are preliminary.
Source: KCC, MKE, KAIT and KEA (2011), and KCC and KAIT (2012).
As of 2010, the information and telecommunications equipment industry, which includes semiconductors, LCDs, and mobile handsets, accounted for more than three quarters of ICT production, while the combined production of telecommunications, broadcasting, and broadcasting and telecommunications convergence services accounted for 15.4%, and the SW and computer-related services accounted for 7.3% of ICT production. This trend of HW having dominance over SW is expected to continue.
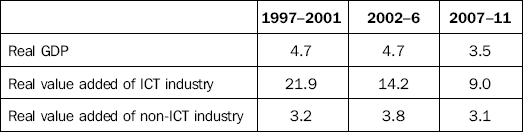
According to the Bank of Korea, the real value-added growth rate of the ICT industry has been on the decline: the rate fell from 21.9%(1997–2001) to 14.2% (2002–6) and again to 9%(2007–11). From 2002 to 2006, real GDP growth did not fall because the real value-added growth of the non-ICT industry (3.8%) was higher than the previous 5 years (3.2%). However, from 2007 to 2011, the real GDP growth rate fell 1.2pp from 4.7 to 3.5% as the real growth rate of both the ICT and the non-ICT industries decreased.
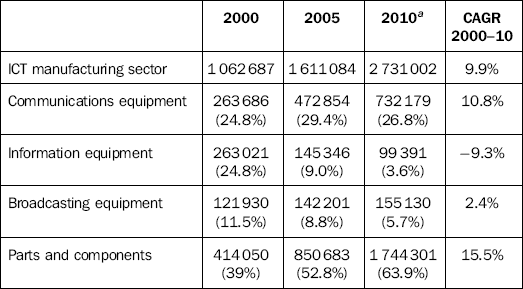
ICT manufacturing sector
The ICT manufacturing sector comprises communication equipment, information equipment, broadcasting equipment, and parts and components. From 2000 to 2010, production in parts and components, which includes semiconductors and LCD panels, enjoyed a rapid growth at an annual rate of 15.5%. This led to a sharp increase in the share of parts and components in ICT manufacturing, from 39% in 2000 to 63.9% in 2010, whereas the share of information equipment plummeted from 24.8 to 3.6% during the same period as its sales decreased at an annual rate of 9.3%.
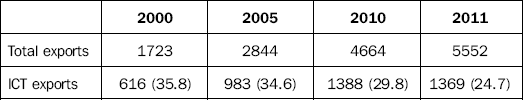
The ICT manufacturing sector has been the driving force behind Korea’s export. However, with the maturation of the global ICT market, its growth rate has continuously declined affecting ICT’s share in total exports: its share in total exports fell from 35.8% in 2000 to 24.7% in 2011.
While the export growth rates for parts and components, including semiconductors and display panels, have remained high, the rates for computer, communications, and broadcasting equipment have been drastically falling.
The drop in export growth rates were caused by production shifts to developing countries in order to secure price competitiveness, as demands for ICT in advanced countries were low due to market saturation while demands in emerging economies were high.
Table 3.7
Production trend in information and telecommunications equipment (KRW100 million)
aValues for 2010 are preliminary.
Source: KCC, MKE, KAIT and KEA (2011), and KCC and KAIT (2012).
Table 3.8
Recent trend in ICT exports (USD100 million)
Note: Numbers in parentheses denote the percentage of ICT exports out of total exports.
Source: Korea International Trade Association and National ICT Industry Promotion Agency.
Table 3.9
Korea and China’s share in the global ICT export market (%)
Note: The OECD ICT product classification is used in identifying ICT products.
Source: UN Comtrade.
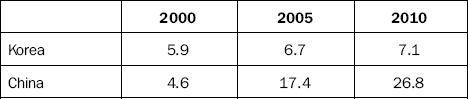
The slowdown in ICT export growth was due to global ICT market saturation and consequent slowdown in growth rather than weakened competitive edge of the Korean ICT manufacturing sector. Korea’s share in global ICT exports has been rising since 2000 and as of 2010, Korea had the fourth highest share of 7.1%, after China (37%), the U.S. (8.1%), and Singapore (7.3%).4
SW sector
As can be seen in Tables 3.2–3.4 the Korean ICT industry is heavily dependent on the ICT manufacturing sector. The software industry has a meager share in the Korean economy: the absolute number of software industry workers and the industry’s contribution to total employment are both extremely low compared with other countries. As of 2008, the country’s software industry employed 20,000 workers, accounting for 0.8% of total employment. In Table 3.10, Korea has the lowest contribution of the selected countries. In terms of absolute size, the number of workers in the Korean software industry was higher than that of Finland and Sweden but far smaller than that of the U.S., Japan, and Germany.
Table 3.10
Number of workers in the software and computer-related services industry for selected countries in 2008 (10 000 persons)
Note: Numbers in parentheses denote the SW industry’s contribution to total employment. 2007 data are used for Japan. Data from Statistics Korea’s Survey of Business Activities.
Source: OECD STAN Database.
The Korean SW industry is weak both quantitatively and qualitatively as both the absolute size and labor productivity of the SW industry are low, as shown in Table 3.11. Considering that Germany, Japan, Finland, Sweden, and the U.S. are high-income countries, it is no surprise that the Korean SW industry’s labor productivity per worker is lower than theirs. Still, the industry’s labor productivity is relatively low when compared with the country’s own HW and telecommunications industries.
Table 3.11
Value added per worker for ICT industry in 2008 (USD10 000)
Note: 2008 exchange rate is used. 2007 data are used for Japan. ISIC Rev. 3 is used for industry classification. Number of workers used for Korea is from Statistics Korea’s Survey of Business Activities.
Source: OECD STAN Database.
As is shown in Table 3.12, Korea had the second lowest SW R&D of USD1.13 trillion in terms of PPP in 2008 (Japan’s was the lowest), accounting for 3.4% of the country’s total private sector R&D. However, SW R&D intensity (R&D expenditure/value added) is relatively high due to an extremely low value added at 1.44%. In short, despite its efforts to transition to a high value–added industry, the SW industry lags far behind the ICT manufacturing industry both quantitatively and qualitatively.
Table 3.12
R&D expenditure and R&D intensity in software sector for selected countries in 2008 (USD100 million in PPP, %)

Note: 2007 data are used for Germany, the U.K., and Japan. R&D intensity is defined as R&D expenditure divided by value added. Numbers in parentheses denote SW’s share in total private sector R&D.
Source: OECD STAN Database.
ICT R&D expenditures, patents, and globalization of ICT sector
ICT R&D expenditures
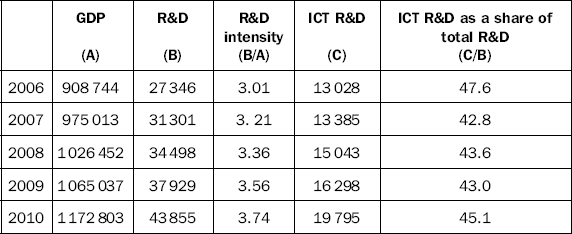
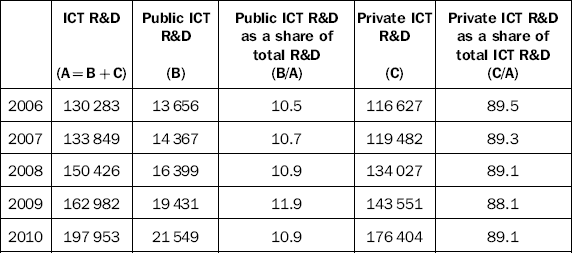
In 2010, Korea’s R&D to GDP ratio stood at 3.74%, amounting to KRW43.9 trillion, of which KRW19.8 trillion was spent on ICT, accounting for 45.1% of total R&D. Considering that the value added of the ICT industry accounts for less than 10% of GDP, compared with other industries, ICT is clearly an R&D-intensive industry.
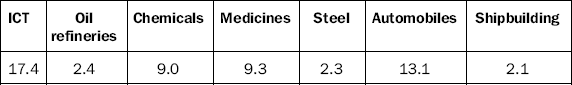
In fact, the ICT industry had an exceedingly high R&D to value added ratio compared with other industries. In 2009, ICT R&D intensity stood at 17.4%, followed by automobiles (13.1%), medicines (9.3%), and chemicals (9%).
The Korean ICT industry has been dominated by conglomerates such as Samsung and LG that have continuously increased their R&D investment in the process of strengthening their global competitiveness.
Though Korea is recognized as a case where the government’s industrial policies played a major role in successfully nurturing the ICT industry, the government does not represent a large proportion in ICT R&D investment. Almost 90% of ICT R&D expenditure comes from the private sector. However, public sector R&D represented 25.2% of all science and technology fields in 2010. Although most ICT R&D has been financed and performed by private businesses, the government has also taken on an important part by involving itself in important R&D projects. Innovative technologies such as TDX, CDMA, WiBro, and DMB have been developed through the support of the government.
The share of ICT in private business R&D has stayed above 50% since 2000. In particular, the ICT manufacturing sector has been leading private business R&D. However, the telecommunications service sector and the SW and IT industry had meager shares of 1.1 and 3.3%, respectively, in total business R&D in 2010.
Table 3.13
Recent trends in R&D and ICT R&D in Korea
Source: NSTC (2011) and Bank of Korea’s National Accounts.
Table 3.14
R&D expenditure as a share of value added for selected industries in Korea in 2009 (%)
Source: OECD STAN Database.
Table 3.15
Share of public R&D expenditure in Korea
Source: National Science and Technology Commission (2011).
Table 3.16
Business R&D expenditure trend in Korea (KRW billion)

Note: Numbers in parentheses indicate ICT R&D as a share of total private business R&D. The ICT industry (according to ISIC Rev. 3) includes office, accounting, and computing machinery (30); radio, television, and communication equipment (32); telecommunications (642); computer-related activities (72).
Source: OECD STAN Database.
ICT patents and technology balance of payments
Patent applications from Korea are concentrated on ICT fields. Table 3.17 details patent applications by field of technology. From 2005 to 2009, Korea ranked 3 in the number of ICT patent applications, only after Japan and the U.S. Also, it is bigger than the combined applications of Germany, France, the U.K., Canada, and Finland.
Table 3.17
Patent applications by field of technology and country of origin, 2005–9 (10 000)
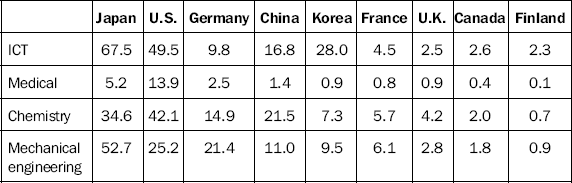
Source: WIPO (2011).
Korea ranked 4 in terms of ICT-related patents as a percentage of national total, following Singapore, Finland, and China. From 2007 to 2009, more than 44% of Korean patent applications under the PCT (Patent Cooperation Treaty) were ICT related. The percentage is considerably higher than the average of the EU27 (26.9%) and the OECD (34.3%) for the same period. The concentration of international patent applications from Korea may be related to the concentration of R&D investment in the ICT sector. Coincidentally, the share of private R&D of total R&D in Korea in the latter half of the last decade was around 44%, as was shown in the previous section.
Another way to measure Korea’s R&D achievements in the ICT sector is to look into Korea’s share of ICT-related patents in total ICT-related PCT filings. In 2009, approximately 6.7% of ICT-related patents filed under the PCT were from Korea. Korea’s share in total PCT filings for the same year stood at 5.5%.
Along with Japan and China, Korea’s share in ICT-related patents filed under the PCT was bigger than its share in total PCT filings. However, as for Germany, France, the U.K. and India, each country’s share in ICT-related patents filed under the PCT was smaller than the country’s share in total PCT filings.
Table 3.18
ICT-related patents as a percentage of national totala (PCT filings), 2001–9
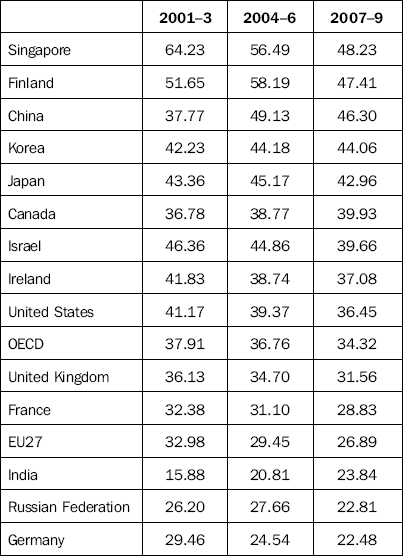
Note: Patent counts are based on the priority date, the inventor’s country of residence, and fractional counting.
*Patent applications filed under the PCT, at international phase, designating the European Patent Office.
Source: OECD’s Patent Database (March 2012), quoted from http://www.oecd.org/document/23/0,3746,en_2649_34223_33987543_1_1_1_1,00.html
Korea’s strong performance in ICT-related patents is attributable to the country being home to world-class ICT firms such as Samsung Electronics and LG Electronics.
According to Information for Industries, Inc. (IFI), five Korean entities made the list of top 50 global companies awarded the most U.S. utilities patents in 2011: Samsung Electronics Co. Ltd. (No. 2) with 4894 new patents, LG Electronics Inc. (No. 12), Hynix Semiconductor Inc. (No. 25), LG Display Co. Ltd. (No. 41), and Electronics and Telecommunications Research Institute (No. 48). None of Korea’s non-ICT firms made the list.
Table 3.19
Share of ICT-related patents in total PCT filings by country, 2009 (%)
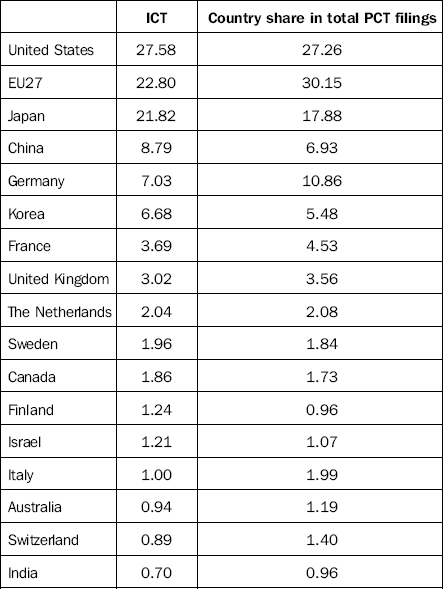
Source: OECD’s Patent Database (March 2012), quoted from http://www.oecd.org/document/23/0,3746,en_2649_34223_33987543_1_1_1_1,00.html
Seventeen U.S. firms, including first-ranked IBM with 6180 newly registered patents, made the list. Nineteen Japanese firms, including Canon (No. 3) with 2821 patents, and one Taiwanese firm, Hon Hai Precision Industry Co. Ltd. (No. 9), made the top 50. Aside from IBM and Microsoft (No. 6), eight of the top ten slots were occupied by Asian firms.5
To measure the achievements of technological innovation, not only quantitative indicators, such as number of patent registrations, but also qualitative indicators should be factored in.
The Patent Impact Index (PII) is a major qualitative indicator.
In the field of semiconductor technology, Korea’s technology strength overtook that of Taiwan in the second half of the last decade. Both the number of patents granted and the Patent Impact Index in Korea increased in the second half of the last decade compared with the first half. In terms of PII, Korea overtook Japan in the second half of the last decade.
In the field of display technology, which encompasses technologies related to LCD, PDP, AMOLED, flexible display, and 3-D display, Korea was granted the greatest number of patents in the U.S. in the last decade. In terms of the PII, Korea was far below the U.S. and Japan. In the second half of the last decade, the decline of the U.S.’s PII led Korea to overtake the U.S. in terms of technology strength.
Mobile communication technology in Korea in the first half of the last decade was behind Taiwan in terms of technology strength assessed by patent statistics. In the second half, technology strength for mobile communication technology in Korea increased more than 20 times compared with the first half. In consequence, Korea ranked 4 in the second half in terms of technology strength, following the U.S., Canada, and Japan. Korea’s rise in mobile communications technology seems to be closely related to good performance by smartphone-manufacturing firms such as Samsung Electronics and LG Electronics.
Table 3.20
International comparison of TS and PII for selected ICT technologies
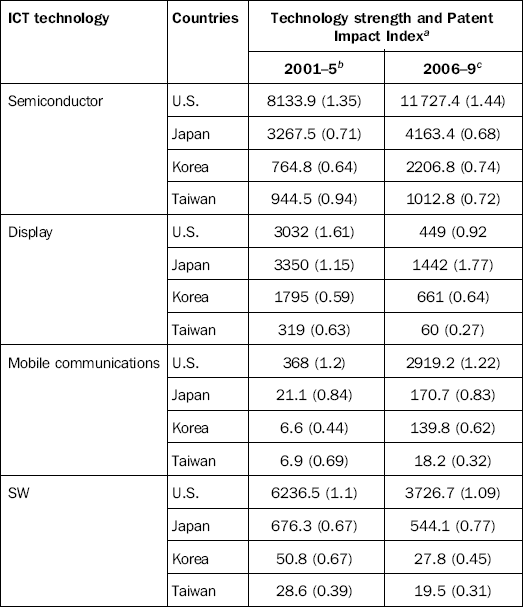
aThe Patent Impact Index is given in parentheses. The number of patents can be obtained by dividing TS with PII.
b2003–6 for display, 2000–4 for SW.
c2007– 10 for display, 2005–9 for SW.
Source: Ministry of Knowledge Economy and Korea Evaluation Institute of Industrial Technology (2012).
Table 3.21
Trend in technology balance of payments, 2006–9 (USD million, %)
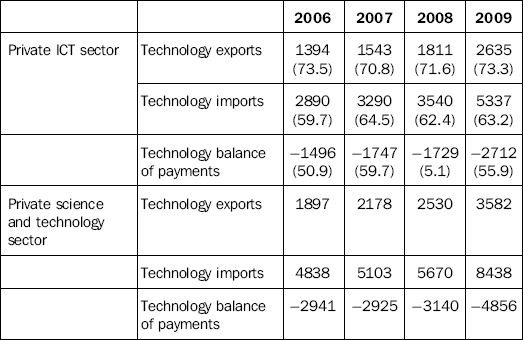
Note: Numbers in parentheses denote the percentage of the private ICT sector of the private science and technology sector.
Source: KOITA (2011b).
In the software field, there was a distinct gap between Korea and the two leading SW countries, the U.S. and Japan, in terms of technology strength assessed by patent statistics: Korea’s TS was less than 1/100 that of the U.S. and roughly 1/20 that of Japan.
To sum up, assessment based on patent statistics shows that Korea’s semiconductor technology is rapidly advancing. Its display technology is at the same level as the U.S. and its mobile communications technology is almost catching up with Japan. However, as for SW technology, there is still a long way to go.
For certain ICT products, Korea leads the market in terms of patents granted in the U.S. However, the Korean ICT sector chronically suffers from a deficit in the technology balance of payments. In 2009, the size of the deficit in the private ICT sector amounted to USD2.7 billion, which accounted for 56% of the total technology balance of payment deficit in the private science and technology sector.
Foreign direct investment (FDI) and foreign R&D outsourcing
According to UNCTAD (2011), Korea ranked 32 in terms of inward FDI in 2010, up three places from 35 in 2009 although its size shrank from USD7.5 billion to USD6.9 billion. Meanwhile, outward FDI from Korea for the same year recorded USD19.2 billion, putting Korea at 18 in terms of absolute amount of outward FDI. As for both inward and outward FDI, the ICT manufacturing sector plays an important role. Table 3.22 contains total/manufacturing/ICT manufacturing inward and outward FDI figures based on the reported amount of FDI. As can be seen in the table, the reported amount of outward FDI far exceeds that of inward FDI. In 2011, ICT manufacturing accounted for 12.8 and 6.5% of inward and outward FDI, respectively.
Table 3.22
Inward and outward FDI by industry (USD million, %)
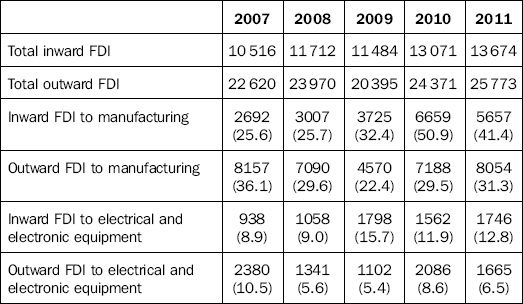
Note: 1The size of FDI is based on reported amounts.
2Numbers in parentheses denote the proportion of inward or outward FDI to the whole industry.
Source: MKE, FDI Statistics, Korea Eximbank, and Overseas Investment Statistics.
Two of Korea’s ICT companies, Samsung Electronics Co. Ltd and LG Electronics, ranked 5 and 9, respectively, in “The world’s top 100 nonfinancial TNCs from developing and transition economies” announced by UNCTAD (2011a). One of the reasons Korean manufacturing firms are increasing outward FDI is because they are expanding overseas production to secure price competitiveness. According to statistics by Korea Eximbank, the Korean manufacturing industry’s overseas production ratio increased 10 pp in 5 years, from 6.7% in 2005 to 16.7% in 2010. The ratio is estimated to have passed 70% for mobile phones and 80% for TVs and PCs as of 2010.6
Foreign R&D outsourcing is a practice in which the domestic manufacturing industry imports inputs from foreign R&D service industries. The degree of foreign R&D outsourcing can be measured by using an input-output table.
Box 3.2 Measuring foreign R&D outsourcing
Here, the R&D service industry refers to codes 73 (research and development) and 74 (professional, scientific, and technical services, not elsewhere classified) in Korean standard industrial classification. R&D outsourcing indices were derived by Campa and Goldberg (1997) and Strauss-Kahn (2004) using the equation below7
qji: total value of inputs from industry j used in producing the output of industry i
mj: value of imported goods from industry j/value of domestic use of goods (final, intermediate, and capital goods) from industry j
Pi: value of total production in industry i
Likewise, Table 3.24 is derived from the foreign R&D outsourcing index for selected industries. As shown in the table, the outsourcing index has been on the rise for major ICT industries, such as the manufacture of radio, television, and communications equipment and apparatus (31), post and telecommunications (64), and computer and related activities (72). In 1995, foreign R&D service outsourcing indices for all industries, except for construction, were below 1%, whereas in 2009, indices for chemicals and chemical products (1.61%), basic metals (1.01%), machinery and equipment (1.5%), radio, television, and communication equipment and apparatus (5.76%), motor vehicles, trailers, and semi-trailers (1.54%), construction (2.9%), post and telecommunications (1.03%) were above 1%.
Table 3.24
Trend in foreign R&D outsourcing index for selected industries (%)
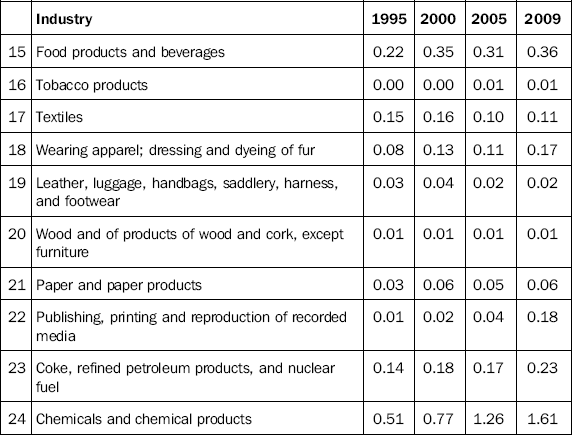
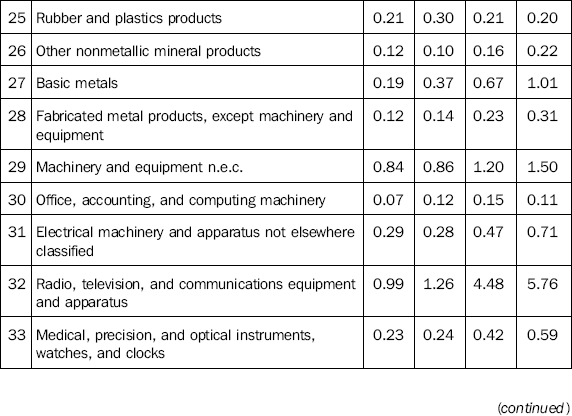
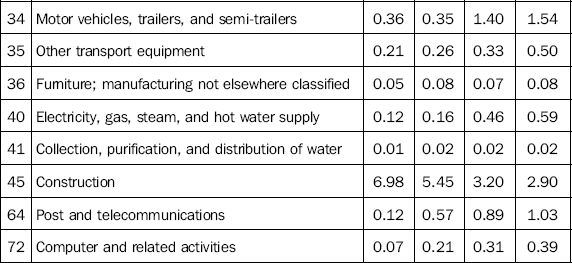
Source: Bank of Korea’s Input-Output Table.
Table 3.23
Korean firms in the world’s top 100 nonfinancial TNCs from developing and transition economies (USD million, person)
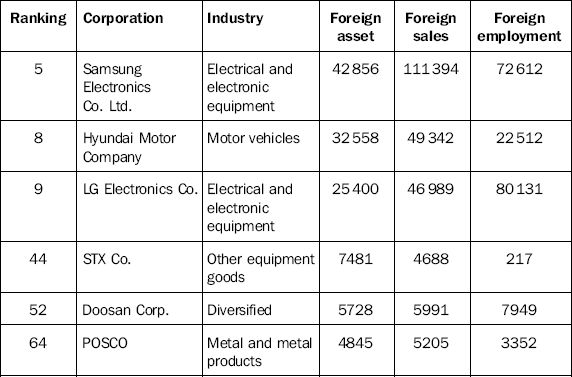
Note: Samsung Electronics Co. Ltd. and Hyundai Motor Company also made the list of the world’s top 100 nonfinancial TNCs, ranked 64 and 88, respectively.
Source: UNCTAD (2011a).
The figures show that foreign R&D outsourcing is widespread in the manufacture of radio, television, and communications equipment and apparatus (32) and that it is growing fast in post and telecommunications (64) and computer and related activities (72).
Korean ICT sector: company-level perspective
Top 20 R&D spenders
According to OECD (2010a), Samsung Electronics spent USD5,870 million on R&D in 2009 and ranked 3 in terms of absolute expenditure among ICT firms around the world. In terms of absolute amount of R&D spending, large companies far exceed SMEs. According to a survey by the Korea Industrial Technology Association (KOITA), large companies account for 84.9% of private ICT R&D as of 2010.8
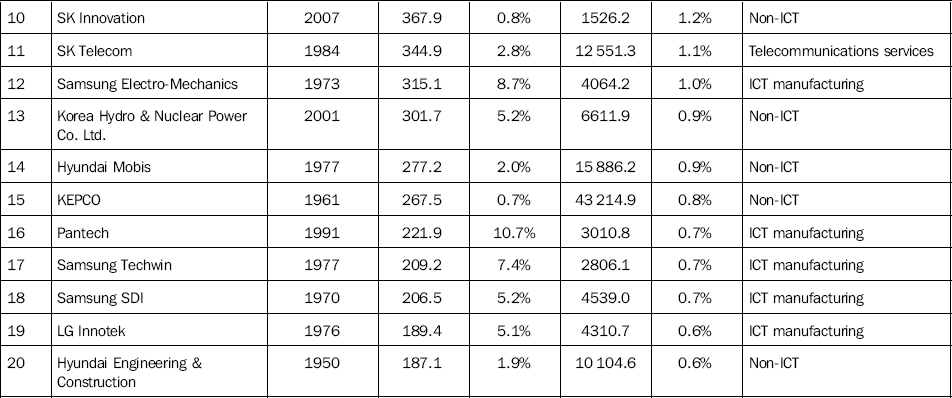
Table 3.25 lists the top 20 R&D spenders among companies list on the Korean Stock Exchange (KSE) and Korean NASDAQ (KOSDAQ) and companies subject to external audit. Among the top 20 are 9 ICT manufacturing firms: Samsung Electronics (No. 1), LG Electronics (No. 2), SK Hynix (No. 4), LG Display (No. 6), Samsung Electro-Mechanics (No. 12), Pantech (No. 16), Samsung Techwin (No. 17), Samsung SDI (No. 18) and LG Innotek (No. 19). Two telecommunications services firms, KT (No. 8) and SK Telecom (No. 11) are also in the top 20. No SW or computer-related services firms made the list.
Table 3.25
Top 20 R&D spenders’ size and share of R&D (KRW billion)
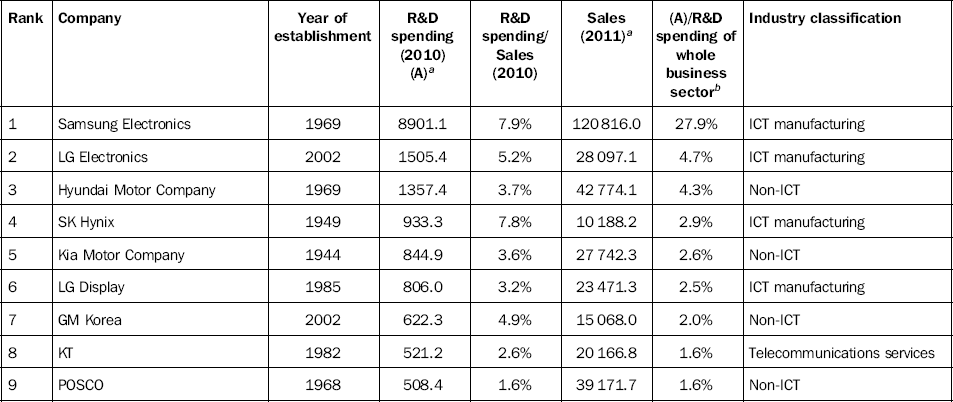
aUnit for R&D spending and sales (KRW billion).
bR&D spending of whole business sector in 2010 was KRW31,958 billion.
Source: KIS-Value.
The combined total of the top 20 firms’ R&D spending amounts to KRW19.9 trillion, three quarters of which is R&D spending in the ICT sector with ICT manufacturing firms accounting for 70.3% (KRW13.3 trillion) and telecommunications services firms accounting for 4.6% (KRW0.9 trillion).
According to KIS-Value data, the combined total of R&D spending of the ICT firms in the top 20 accounts for a staggering 44.3% of the R&D of the whole business sector. The average R&D spending to sales ratio of ICT manufacturing firms and telecommunications services firms in the top 20 were 6.8 and 2.7%, respectively
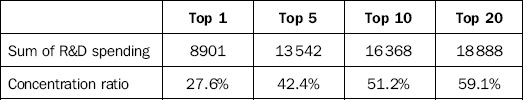
Table 3.26 shows the concentration ratios of the top 20 firms’ R&D spending to R&D of the whole business sector. Samsung Electronics’ R&D spending (KRW8.9 trillion) accounted for 27.6% of R&D of the whole business sector (KRW32 trillion). The concentration ratio of the top 5 (CR5) and top 10 (CR10) firms were 42.4 and 51.2%, respectively, which means that the absolute amount of Samsung Electronics’ R&D is bigger than the combined R&D spending of the rest of the firms in the top 10.
Table 3.26
Concentration ratio of the top R&D-spending firms (KRW billion)
Note: R&D spending of the whole business sector in 2010 was KRW31958 billion.
Source: Calculated from KIS-Value.
According to the survey conducted by the Korea Industrial Technology Association (KOITA), which includes not only KSE and KOSDAQ9-listed companies and companies subject to external audit but also other firms, CR5 and CR10 in 2010 were 40.9 and 46% respectively, lower than the values in Table 3.25, which is calculated from KIS-Value.
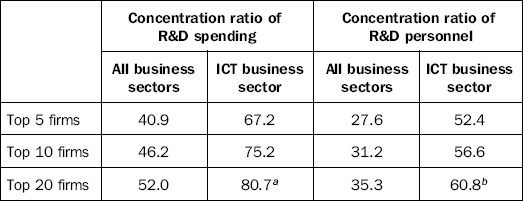
In Table 3.27, KOITA compared R&D expenditure concentration ratios in the ICT sector and in the whole business sector. As shown in the table, the ICT concentration ratios were higher with CR5 at 67.2% and CR10 at 75.2%. The figures also show that the concentration of R&D personnel in the ICT sector is higher than in the whole business sector.
Table 3.27
Concentration ratios of R&D spending and R&D personnel in 2010 (%)
aTop 20 R&D-spending firms in the ICT sector in 2010: Samsung Electronics, LG Electronics, LG Display, KT, SK Telecom, SK Hynix, LG U+, Samsung Display, Samsung SDI, LG Innotek, Samsung Electro-Mechanics, Samsung SDS, Samsung Techwin, Pantech, LG CNS, Toshiba-Samsung Storage Technology Korea, SK C&C, SKC, DS LCD, Amkor Technology Korea.
bTop 20 R&D personnel-hiring firms in the ICT Sector in 2010: Samsung Electronics, LG Electronics, LG Display, SK Hynix, Samsung Electro-Mechanics, Pantech, Samsung SDI, NCsoft, Samsung Techwin, LG Innotek, Samsung Display, LG-Ericsson, KT, Dongbu HiTek, MagnaChip, Humax, Ahnlab, Motorola Korea, Samsung LED, Ubivelox.
Source: KOITA (2011).
In conclusion, ICT R&D is led by a small number of large companies in the ICT manufacturing sector and telecommunications services sector and, consequently, the concentration ratios of R&D spending and R&D personnel are much higher in the ICT sector than those in the non-ICT sector.
The following section will cover the R&D activities of Samsung Electronics and LG Electronics, the leading Korean firms in ICT R&D.
R&D of Samsung Electronics and LG Electronics
Samsung Electronics
Samsung Electronics is the biggest firm in Korea in terms of sales and operating profits. In 2011, its revenue recorded KRW164.7 trillion and its operating profit was tallied at KRW16.15 trillion. Its revenue and operating figure for 2007 stood at KRW98.5 trillion and KRW8.97 trillion. This means that the company’s revenue and operating profit grew at an annual rate of 13.7 and 15.8%, respectively, between 2007 and 2011 despite the global financial crisis that started in 2008. Samsung’s sales mainly came from semiconductors, visual display, LCDs, mobile handsets, and digital media and home appliances (DM and HA). Table 3.28 shows the composition of sales of Samsung Electronics in 2011.
Table 3.28
Product composition of Samsung Electronics’ sales in 2011
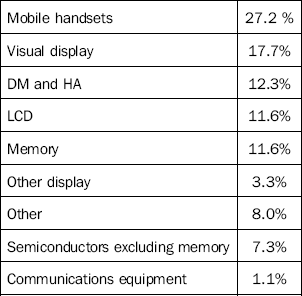
Note: Total sales in 2011 were KRW164.7 trillion.
Source: Samsung Electronics (2012b).
Samsung Electronics is the biggest R&D spender in Korea. It has continuously increased its R&D expenditure. In 2010 alone, it spent KRW8.9 trillion in R&D.
Table 3.29 shows annual total R&D spending and the R&D to sales ratio of Samsung Electronics. In 2002, the firm spent KRW2.9 trillion in R&D, accounting for 7.4% of sales. In 2005, Samsung Electronics R&D spending exceeded KRW5 trillion for the first time as the firm spent KRW5.4 trillion in R&D. Since then, R&D spending significantly increased: KRW6.9 trillion in 2008, KRW7.3 trillion in 2009, and KRW8.9 trillion in 2010.
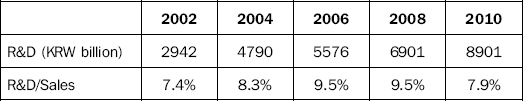
Meanwhile, R&D intensity has been on the decline after peaking at 9.5% in 2006. This is mainly because the firm’s R&D expenditure growth rate slowed down. The rate averaged 17.3% from 2002 to 2006 but fell to 12.4% from 2006 to 2010.
Table 3.31
Samsung Electronics’ accumulated number of patents registered in various countries as of the end of 2011
Source: Samsung Electronics (2012a).
Table 3.33
Product composition of LG Electronics’ sales in 2011
Note: Total sales in 2011 were KRW61.2 trillion.
Source: LG Electronics (2012b).
According to Samsung Electronics’ Business Report, the firm’s R&D spending in 2011 tallied at KRW10.3 trillion, accounting for 6.3% of the company’s sales.
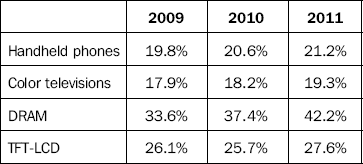
Despite the slowdown in R&D expenditure growth, Samsung Electronics is successfully expanding the global market share of its major products. Table 3.30 shows the global market share of the firm’s major products in recent years. The figures show that market shares for Samsung Electronics’ major products, such as handheld phones, color TVs, DRAM, and LCDs, have continuously increased.
Table 3.30
Global market share of Samsung Electronics’ major products
Source: Samsung Electronics (2012a).
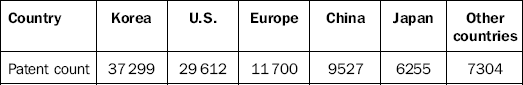
Samsung Electronics has been the second biggest U.S. patent recipient, only IBM has gotten more, for six consecutive years since 2006. The firm won its first U.S. patent in 1984 and as of the end of 2011 it held a total of 101,697 U.S. patents. While receiving 4894 U.S. patents in 2011 alone, the firm is expected to double its efforts for patent registration to proactively respond to intensified patent disputes in the U.S.
Table 3.32 summarizes the trend in the number of patents registered in the U.S. and Korea by Samsung Electronics. As can be seen, Samsung Electronics has registered more patents in the U.S. than in Korea since 2009. The company’s patent registrations are mainly related to flash memory, system LSI, DTV, HHPs, and LCD. Samsung continues to register patents not only to protect its business but also to proactively respond to possible outpouring of similar technologies and patents and to keep its competitors in check. Furthermore, Samsung Electronics is working to obtain patents related to new materials, new multimedia codecs, next-generation wireless communications, according to the firm’s 2011 Annual Business Report. In 2011, Samsung registered 332 design patents to protect its original designs that apply to handheld phones, etc.
Table 3.32
Number of patents registered in Korea and the U.S. by Samsung Electronics
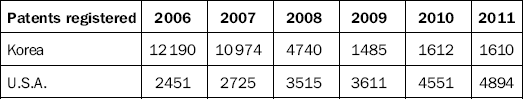
Source: Samsung Electronics (2012a).
LG Electronics
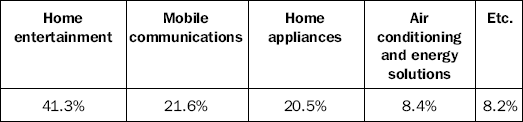
LG Electronics is the second biggest ICT firm in Korea in terms of sales. In 2011, its sales recorded KRW54.3 trillion. Its major business consists of home entertainment, mobile communications, handsets, home appliances, and air conditioning and energy solutions. In 2011, home entertainment took up 41.3% of the firm’s sales, followed by mobile communications (21.6%), and home appliances (20.5%). Home entertainment includes LCD TVs, PDP TVs, LCD monitors, audio, video, and security equipment, whereas mobile communications includes mobile handsets, tablet PCs, and networks. Home appliances are products such as refrigerators, washing machines, microwaves, vacuum cleaners, healthcare products, and water purifiers, whereas air conditioning and energy solutions includes commercial and home air conditioners, chillers, LED lighting, building management solutions, and smart grid solutions.
Table 3.37
SW and IT services export (USD100 million)
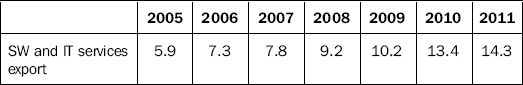
Source: National ICT Industry Promotion Agency.
LG Electronics is the second biggest R&D spender in Korea. Although its R&D spending shrank in 2010 compared with the previous year, it mostly showed an increasing trend in the 2000s. Table 3.34 contains annual total R&D spending and the R&D to sales ratio of LG Electronics. In 2002, the firm spent KRW0.6 trillion in R&D, accounting for 4.2% of sales. The firm’s R&D spending exceeded KRW1 trillion for the first time in 2004 when LG spent KRW1.2 trillion. Its R&D spending peaked in 2009 at KRW1.9 trillion but fell sharply to KRW1.5 trillion in 2010. Accordingly, the firm’s R&D intensity remained at below 4% from 2002 to 2003, rose to 6.3% in 2009, and declined to 5.3% in 2010. Compared with Samsung Electronics’ R&D intensity (given in the previous section), it can be seen that LG Electronics’ R&D intensity is 2–3% lower than that of Samsung Electronics.
Table 3.34
Trend of the size of R&D expenditure and R&D intensity of LG Electronics
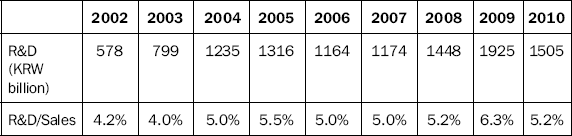
Source: Calculated from KIS-Value.
Table 3.35 details LG Electronics’ sales and operating profit by product segment during the past three years. As shown in the table, its operating profit dwindled in 2010 and 2011 compared with 2009. Its sales also stagnated. The lackluster performance of LG Electronics is closely related to its losing shares in the mobile communications market. With its competitiveness in smartphones running on long-term evolution technology, LG Electronics is striving to bounce back. According to a recent report by a U.S.-based research firm, TechlPm, LG is the leading firm possessing LTE essential patents as of the second quarter of 2012. According to TechlPm, Nokia ranked 2 and Samsung Electronics 3, with Motorola, Nortel, InterDigital, and Qualcomm following.10
Table 3.35
Sales and operating profit of LG Electronics’ major products (KRW billion)
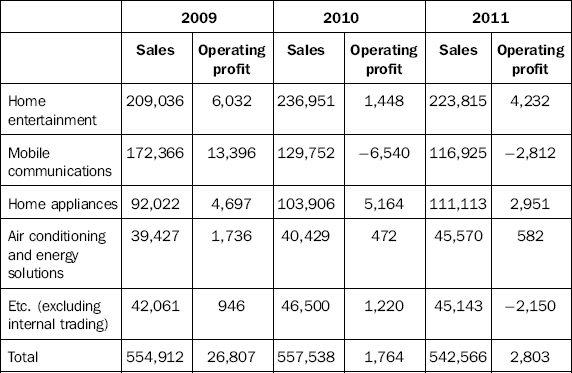
Source: LG Electronics (2012a).
Having R&D centers worldwide, LG Electronics is actively engaged in R&D. The firm had 24 overseas R&D centers as of December, 2011: in China (7), the U.S. (5), Russia (3), Japan (2), India (2), Brazil (1), Israel (1), Germany (1), France (1), and the U.K. (1). LG Electronics is conducting R&D to proactively respond to global business trends such as 3-D, smart TV, and LTE and to develop new products that boost customer convenience so as to keep its competitive edge sharp in the home appliance segment and maintain its status as current market trendsetter.11
Top 100 R&D-intensive firms in Korea
In Table 3.36 the top 100 R&D-intensive firms of those listed on the KSE and KOSDAQ in 2010 are classified into ICT and non-ICT firms. Among the top 100 are 51 ICT firms: 28 ICT manufacturing firms and 23 SW and computer-related services firms. The combined total of the top 100 firms’ R&D spending amounted to KRW1.604 trillion, with ICT manufacturing firms and SW and computer-related service firms accounting for 30.8 and 26.8% of the combined total. The R&D to sales ratios for ICT manufacturing firms and SW and computer-related service firms were 21.8 and 25.5%, respectively. Except for the SI firms of conglomerates (Samsung SDS, LG CNS, SK C&C), no SW and computer-related service firms were among the top 20 R&D spenders, whereas quite a few were among the top 100 R&D intensity firms. However, the combined total of the top 100 firms’ R&D spending only accounts for 3.3% of the R&D spending of the whole business sector; and within this ratio 1.4% is taken up by non-ICT manufacturing, 1.0% by ICT manufacturing, and 0.9% by SW. In terms of size, their impact on the whole ICT innovation system in Korea is quite limited.

Conclusion
Korea, with large companies that are highly competitive in such areas as semiconductors, LCD, and mobile phones which mainly require large-scale cutting edge investment, continues to maintain its position as a leader in the global ICT market, topping the lists on ICT R&D-related input and performance. In terms of share in global ICT exports, Korea ranks 4, only after China, the U.S., and Singapore, as of 2010. Also, Korea ranks among those countries with a high ICT R&D to GDP ratio and the greatest number of ICT-related patent registrations worldwide. However, its ICT industry is highly large company-oriented and also HW centric. It should be noted that this landscape can be a stumbling block to future growth by means of innovation in the Korean ICT industry. The top 10 ICT firms, all of which are hardware firms, account for 75% of R&D in the ICT business sector. As a result, large ICT firms’ share in R&D in the ICT business sector (83.1%) is much higher than large companies’ share in R&D in the whole business sector (73.9%).12 Weak competitiveness in SW is also another challenge for the industry. Although SW exports are on an upward trend, recording USD1.43 billion in 2011, Korea still ranks among the lowest in terms of SW and IT services exports. According to OECD (2010a), Korea ranked 24 of 28 OECD countries.
As the importance of the ICT ecosystem, where content–platform– network–device (C–P–N–D) are systemically connected, is increasing at the corporate, industria, and economic level, the structure of the ICT industry is changing into one where systemic competitiveness outshines competitiveness in a certain field. With this trend, the importance of SW has doubled as SW is a prerequisite for strengthening the systemic competitiveness of C–P–N–D and as SW is what determines the competitiveness of other industries, not to mention the ICT industry. However, the technological innovation of the Korean SW industry lags far behind that of other major countries in both input and output aspects. Thanks to the spread of the Internet and qualitative improvements in HW and networks, individuals and companies are now able to change the components of computing – data storage/process/transmission – into various services. This means that the weight of SW in all parts of the C–P–N–D value chain has greatly increased. SW itself can be contents (e.g., games) or a means to accumulate, process, store and provide contents. With individual platforms for search, media access, communication, SNS, payment, and advertisement forming an interactive and complementary relation, SW can deliver and manage contents, link services within an individual platform, and link platforms. Now, various network equipment such as routers and switches are run by virtualization software and many software firms are providing services for server-efficient traffic transmission, security, and app acceleration through the Internet. SW is the link between C-P-N-D and this is why competitiveness in HW alone is no longer enough to lead the market. Korea’s future technological innovation is likely to be centered on HW and large companies. However, without expanding investment in SW and strengthening the role of innovative SMEs that provide contents and platforms, boost network stability, and supply major hardware components in the ICT ecosystem, future growth of the Korean ICT industry will be greatly limited.
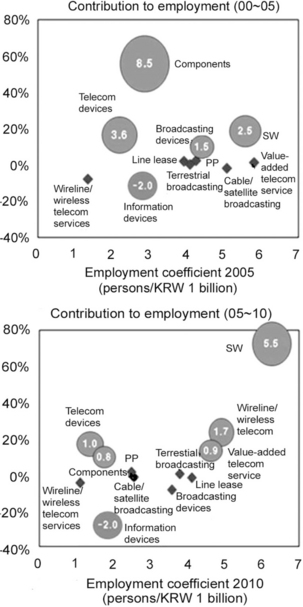
Figure 3.1 ICT sector employment Source: Ko, Sangwon et al. (2011).
Another reason innovation in SW and SMEs is important is that SW and SMEs have significant potentials for job creation. The ICT sector created more than 160 000 jobs in the first half of the 2000s, but created just some 72 000 jobs in the second half. Despite the disappointing figures, the silver lining is that, while employment in the first half of the 2000s was mostly created in segments with low employment coefficients such as components and telecom devices, employment in the second half came from segments with high employment coefficients such as software and wireline/wireless content. As ICT components and equipment segments, especially low value-added process segments, are likely to be shifted to other countries such as China where labor cost is low, software-led employment growth is expected to continue.
Figure 3.2 classifies major companies into each layer of the value chain of the Korean ICT sector based on the layered model discussed by Fransman (2010) to track employment trends in each layer between 2005 and 2010. As can be seen in the figure, Layer 3 covering content and value-added services has the most active entry of new entrants as well as the highest employment growth on the strength of growth of experienced firms. In Layer 2, which contains telecom operators, employment is stagnant, while in Layer 1, which contains handset and equipment manufacturers such as Samsung Electronics and LG Electronics, employment growth is weak when compared with the increase in sales. For example, Samsung Electronics created more than 15 000 jobs between 2005 and 2010 but since its sales doubled during the period, the employment coefficient is low. Future job creation in the ICT sector is expected to spread to segments with high employment coefficients such as content, value-added services, and software. The focus now becomes just how far these segments can boost job creation. That will determine whether the ICT sector will be able to grow while still creating jobs.

Figure 3.2 Layer model and employment for the past five years Source: Ko, Sangwon et al. (2011).
The two biggest challenges the Korean ICT industry faces are breaking away from the current large company–oriented, HW-centric ICT innovation system and globalizing innovation. Large companies such as Samsung Electronics and LG Electronics are taking advantage of international production factors and pioneering new markets by taking part in international joint research, establishing overseas R&D centers, conducting foreign R&D outsourcing, and recruiting overseas workers. However, most Korean companies lack the ability to globalize innovation. Only when the business activities – production, distribution, design, and R&D – of a bigger number of Korean ICT firms play an active role in the diverse global collaboration ecosystem will Korean ICT industry be able to continue its high growth and groundbreaking innovation.
1.“Facts about Korea,” http://www.korea.net/AboutKorea/Korea-at-a-Glance/Facts-about-Korea
2.CIA (2012) GDP (official exchange rate), The World Fact Book, https://www.cia.gov/library/publications/the-world-factbook/geos/ks.html
3.Wikipedia, South Korea, http://en.wikipedia.org/wiki/South_Korea
4.Hong Kong’s figures were reflected as 37%, but not in Table 2.3. Calculated from UN Comtrade Database.
5.IFI CLAIMS® Patent Services (2012).
6.Bank of Korea (2012), The impact of the increasing foreign production of domestic firms and policy implication, Bank of Korea Economic Review, 2012–4.
8.The Korea Industrial Technology Association (KOITA) does not use KIS-Value data but conducts its own survey to assess the R&D landscape. In this section, KIS-Value data were used as criteria to analyze consistency with IR reports.
9.The KOSDAQ market, modeled on the NASDAQ market, was created in 1996 as a trade platform primarily for cutting edge technology stocks.
10.“LG top in LTE patents: report,” The Korea Herald, July 9, 2012.