
Chapter 2. Quick-Start Tutorials: Basic Settings and Commands
• Begin a new AutoCAD drawing and make settings for units, limits, grid, and snap.
• Make layers and assign color, linetype, and lineweight to each layer.
• Use function keys to control grid and snap.
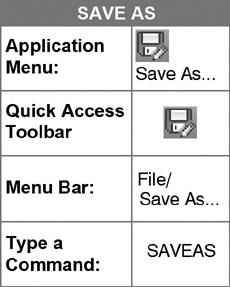
• Use the commands Save and Save As to save work.
• Use grips to modify objects.
• Use ORTHO mode to control drawing horizontal and vertical lines.
• Use annotation scale to control how text and other annotative objects appear on drawings and plots.
• Print/plot drawings from a Model tab.
• Correctly use the following commands and settings:
ARC
CIRCLE
DONUT
DYN
ELLIPSE
ERASE
GRIDDISPLAY
Highlight
LINE
LTSCALE
MOVE
PAN
REDO
REDRAW
REGEN
SCALE
Single Line Text
UNDO
ZOOM
• Correctly use selection set option
• Draw using absolute, relative, polar coordinates, and direct distance entry.
Introduction
The following is a hands-on, step-by-step procedure to complete your first drawing using AutoCAD:
• Tutorial 2-1, Part 1, describes the settings that must be made before starting a drawing.
• Tutorial 2-1, Part 2, describes how to draw using basic commands.
• Tutorial 2-2 describes how to print your drawing.
When you have completed Tutorial 2-1 your drawing will look similar to Figure 2-1.
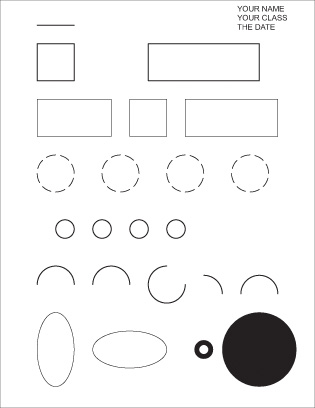
Figure 2-1 Tutorial 2-1 complete
Following the Tutorials in This Book
You are probably using a mouse with a small scroll wheel between the buttons. The left button is the pick button used to select commands and click points on the drawing. The Response column item used in the tutorials describes the location of points on the drawing that are clicked by the left button on your mouse. Figures are provided throughout the chapters to show the location of the points. The points are indicated in bold type in the Response column by a P→. The P is followed by a number; for example, P1→, P2→. Look at the figure referenced in the step to locate the numbered point on the figure, and click a point in the same place on your drawing.
Tutorial 2-1 Part 1, Beginning an AutoCAD Drawing: Saving Your Work; Setting Units, Limits, Grid, and Snap; Creating Layers
Beginning an AutoCAD Drawing
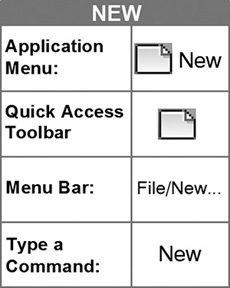
When you click New... from the Quick Access toolbar or New from the application menu button, or Start Drawing (Get Started) from the New Tab window, AutoCAD allows you to select a template file from the Template folder or use the default template file. A template file has settings already established. These settings can include units, limits, grid, snap, and a border and title block. Templates save time because the settings are already made.
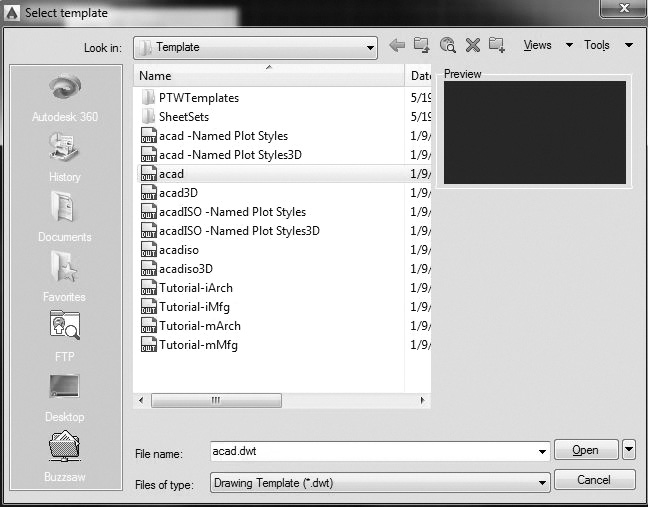
If you click New... and select the acad.dwt template, as shown in Figure 2-2, you are in the same drawing environment as when you simply open the AutoCAD program and begin drawing. AutoCAD uses the acad.dwt template for the drawing settings if no other template is selected.
You do not need to click New... from the File menu. You can stay in the drawing environment that appeared when you started AutoCAD.
Step 1. If your named workspace is not active, you can select it by using the Workspace Switching button in the status bar or in the Quick Access toolbar. You can modify your workspace and save it again as often as you like.
Saving the Drawing
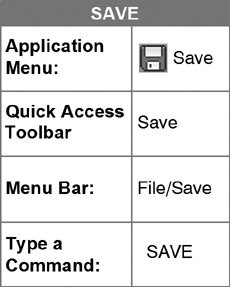
You must understand two commands, Save and Save As, and their uses to name and save your work in the desired drive and folder.
Save
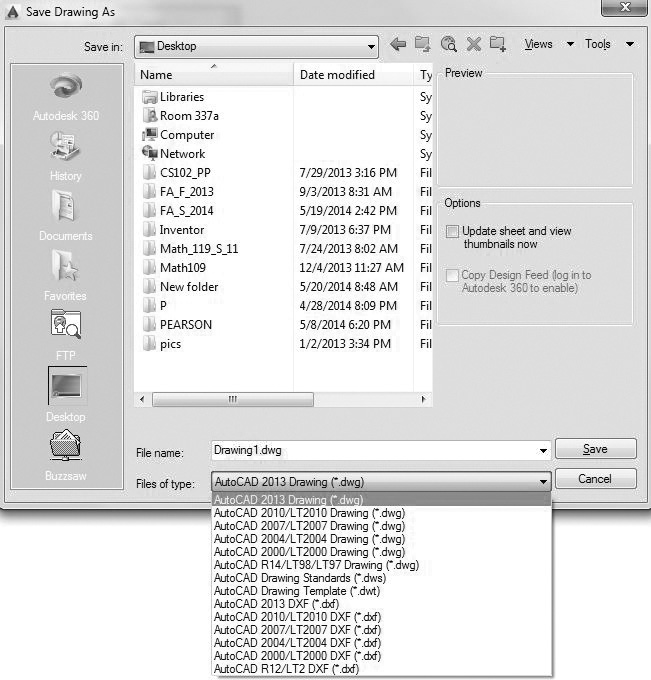
When the Save command is clicked for a drawing that has not been named, the Save Drawing As dialog box is activated. You may name the drawing by typing a name in the File name: input box. You also select a drive and folder where you want the drawing saved.
When the Save command is clicked and the drawing has been named and already saved, no dialog box appears, and the drawing is saved automatically to the drive and folder in which you are working. At this time, the existing drawing file (.dwg) becomes the backup file (.bak), and a new drawing file is created.
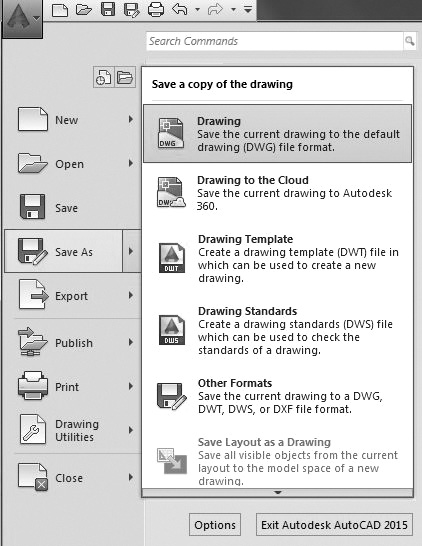
Save As
Save As activates the Save a copy of the drawing selection box (Figure 2-3) whether or not the drawing has been named and allows you to save your drawing to Save Drawing As (Figure 2-4) to any drive or folder you choose with a new name if you choose so.
Some additional features of the Save As command are as follows:
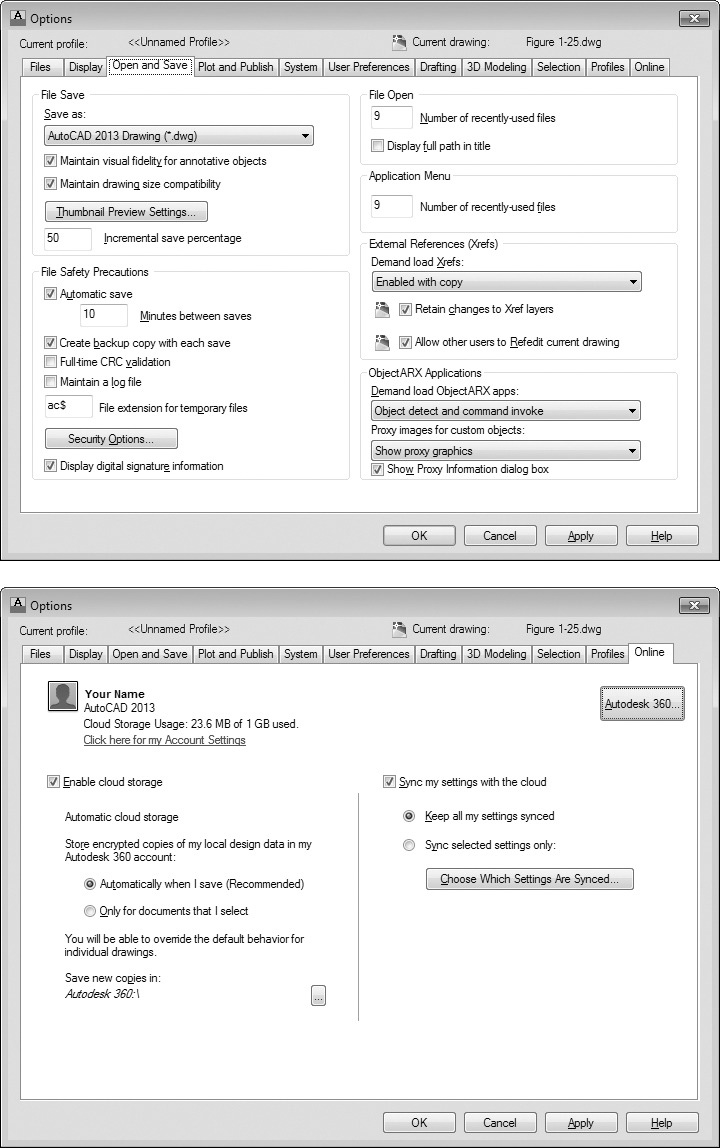
![]() If the default drive is used (the drive on which you are working), and the drawing has been opened from that drive, .dwg and .bak files are created when Create backup copy with each save is checked on the Open and Save tab of the Options dialog box as shown in Figure 2-5. To access the Options dialog box, type OP <Enter>.
If the default drive is used (the drive on which you are working), and the drawing has been opened from that drive, .dwg and .bak files are created when Create backup copy with each save is checked on the Open and Save tab of the Options dialog box as shown in Figure 2-5. To access the Options dialog box, type OP <Enter>.
![]() If a drive other than the default is specified, only a .dwg file is created.
If a drive other than the default is specified, only a .dwg file is created.
![]() To change the name of the drawing, you may save it under a new name by typing a new name in the File name: input box. The drawing is still saved under the original name as well as the new name. You can save the drawing under as many names as you need.
To change the name of the drawing, you may save it under a new name by typing a new name in the File name: input box. The drawing is still saved under the original name as well as the new name. You can save the drawing under as many names as you need.
![]() If the drawing was previously saved, or if a drawing file already exists with the drawing file name you typed, AutoCAD gives you the message drawing name.dwg already exists. Do you want to replace it? When you are updating a drawing file, the old .dwg file is replaced with the new drawing, so the answer to click is Yes. If an error has been made and you do not want to replace the file, click No.
If the drawing was previously saved, or if a drawing file already exists with the drawing file name you typed, AutoCAD gives you the message drawing name.dwg already exists. Do you want to replace it? When you are updating a drawing file, the old .dwg file is replaced with the new drawing, so the answer to click is Yes. If an error has been made and you do not want to replace the file, click No.
![]() A drawing may be saved to as many disks or to as many folders on the hard disk as you wish. You should save your drawing in two different places as insurance against catastrophe.
A drawing may be saved to as many disks or to as many folders on the hard disk as you wish. You should save your drawing in two different places as insurance against catastrophe.
![]() Drawings can be saved to an Autodesk 360 Cloud Account. This is where you can store, share, and view your drawings online from any computer, mobile phone, or tablet. AutoCAD WS is a cloud-based CAD editor from Autodesk that allows you to view, edit, and share your drawings.
Drawings can be saved to an Autodesk 360 Cloud Account. This is where you can store, share, and view your drawings online from any computer, mobile phone, or tablet. AutoCAD WS is a cloud-based CAD editor from Autodesk that allows you to view, edit, and share your drawings.
On the Online tab of the Options dialog box, Figure 2-5, when the Enable cloud storage box is checked and the Automatically when I save (Recommended) radio button is selected, your drawings are automatically saved by default to the cloud. You can change this setting for each drawing individually, using the Save Drawing As dialog box, Figure 2-4, when you click the Keep a copy of this document in my cloud account box to delete the check mark. The Set Online Options... button on the Save Drawing As dialog box takes you to the Online tab of the Options dialog box.
![]() Any drawing may be saved as other file types (Figure 2-4):
Any drawing may be saved as other file types (Figure 2-4):
DWT
This is a drawing template file. Settings are already established in a template file. Just as you opened the acad.dwt template file to start a drawing, you can make settings for a drawing that are unique to your work situation and save those settings as a template file. This saves time, because settings such as units, limits, grid, snap, and layers (which you will learn in this chapter) will already be set.
DWS
This is a drawing standards file. It defines standards for layers, dimension styles, linetypes, and text styles. You can associate the standards file with another drawing, audit the drawing to see if the standards differ, and automatically change any differing standards to match the DWS file.
Note
AutoCAD automatically names your drawings, using the names Drawing1, Drawing2, and so on, if you do not type a name in the File name: input box. The name you save the drawing as appears in the AutoCAD title bar.
DXF
This is a drawing interchange format file. It is used to share drawing data among other CAD programs. You can open a DXF file, save it as a DWG file, and work with the drawing.
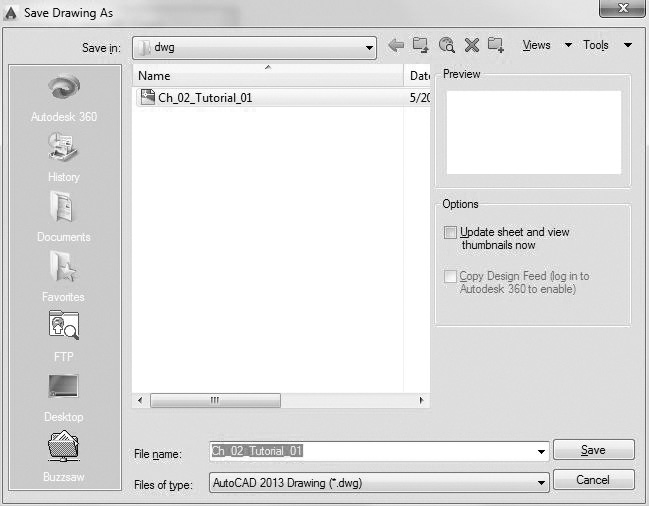
Step 2. Name and save Tutorial 2-1 on the drive and/or folder you want (Figure 2-6), as described next:
Prompt |
Response |
Type a command: |
Save |
The Save Drawing As dialog box appears with the file name highlighted: |
Type CH2-TUTORIAL1 |
The Save Drawing As dialog box appears, as shown in Figure 2-6: |
Select the drive and/or folder in which you want to save CH2-TUTORIAL1 Click Save |
Drawing Name and File Name Extension
The drawing name can be up to 255 characters long and can have spaces. The drawing name cannot have special characters that the AutoCAD or Microsoft® Windows programs use for other purposes. The special characters that cannot be used include the less-than and greater-than symbols (<>), forward slashes and backslashes (/ ), backquotes (`), equal signs (=), vertical bars (|), asterisks (*), commas (,), question marks (?), semicolons (;), colons (:), and quotation marks (“). As you continue to learn AutoCAD, other objects will be also named, such as layers. These naming conventions apply to all named objects.
AutoCAD automatically adds the file extension .dwg to the drawing name and .bak to a backup file. The icon to the left of the file name in the Save Drawing As dialog box describes the file type.
Tip
If you lose a drawing file, the drawing’s .bak file can be renamed as a .dwg file and used as the drawing file. Using Windows Explorer, right-click on the file name and select Rename from the menu. Simply keep the name, but change the file extension. If the .dwg file is corrupted, you may give the .bak file a new name and change the extension to .dwg. Don’t forget to add the .dwg extension in either case, because the file will not open without a .dwg extension.
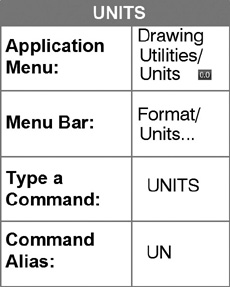
Units
Units refers to drawing units. For example, an inch is a drawing unit. In this book, architectural units, which utilize feet and fractional inches, are used. The Precision: input box in the Drawing Units dialog box allows you to set the smallest fraction to display when showing coordinates and defaults on the screen. There is no reason to change any of the other settings in the Drawing Units dialog box at this time.
units: A setting referring to drawing units. For example, an inch is a drawing unit. Architectural units utilize feet and fractional units. Decimal, fractional, engineering, and scientific units are also available in the Drawing Units dialog box.
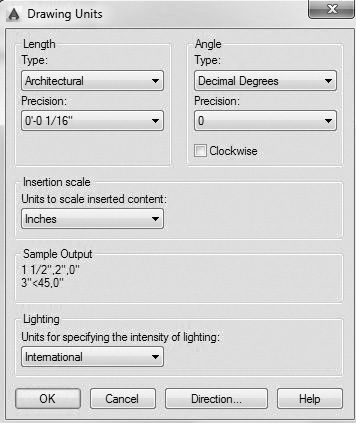
Step 3. Set drawing units (Figure 2-7), as described next:
Prompt |
Response |
Type a command: |
Units... (or type UN <Enter>) |
The Drawing Units dialog box appears (Figure 2-7): |
Click Architectural (for Type: under Length) Click 0′-0 1/16″ (for Precision: under Length) Click OK |
Note
The Precision: input box has no bearing on how accurately AutoCAD draws. It allows you to set the smallest fraction to display values shown on the screen such as coordinates and defaults. No matter what the Precision: setting, AutoCAD draws with extreme accuracy.
Controlling Your Drawing
When you begin drawing with AutoCAD, you may perhaps click a tab or drawing tool that you do not need. If you select the Layout1 or Layout2 tab at the bottom of your drawing window and are not sure where you are in the drawing, simply select the Model tab to return to your drawing. The Layout tabs are used for printing or plotting and will be described later.
Note
To cancel a command, press <Esc> (from the keyboard).
Step 4. Make sure SNAP and GRID are on in the status bar and that INFER, ORTHO, POLAR, OSNAP, 3DOSNAP, OTRACK, DUCS, DYN, LWT, TPY, QP, SC, and AM are off.
Drawing Scale
A drawing scale factor does not need to be set. When using AutoCAD to make drawings, always draw full scale, using real-world feet and inches. Full-scale drawings can be printed or plotted at any scale.
drawing scale: The scale at which drawings are made.
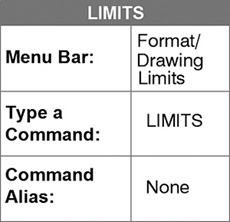
Drawing Limits and the Cartesian Coordinate System
Step 5. Set drawing limits, as described next:
Prompt |
Response |
Type a command: |
Type LIMITS <Enter> |
Specify lower left corner or [ON OFF] <0′-0″, 0′-0″>: |
<Enter> |
Specify upper right corner <1″-0′, 0′-9″>: |
Type 8-1/2,11 <Enter> |
Tip
Pressing the space bar is just like pressing the <Enter> key.
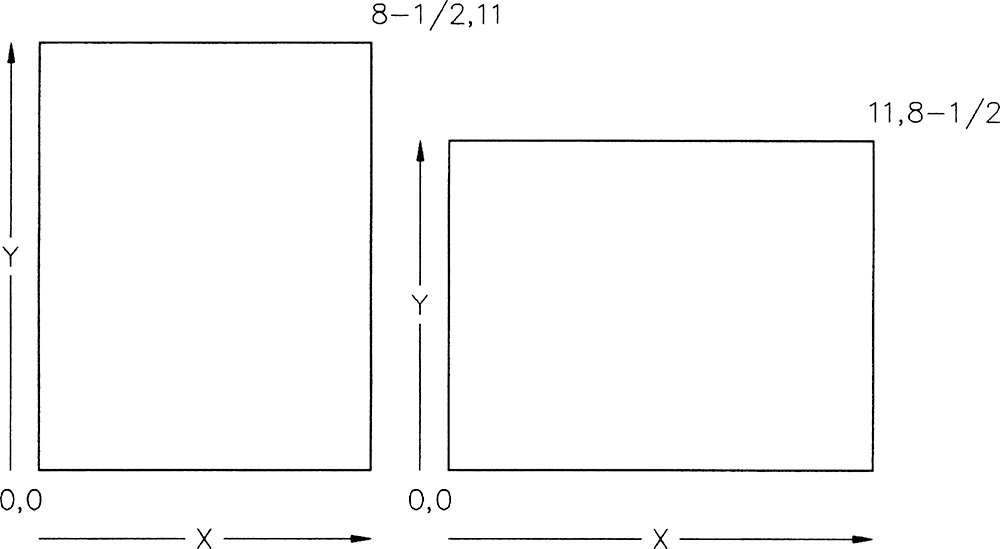
Think of drawing limits as your drawing area, sheet size, or sheet boundaries. This sheet of paper is also called the workplane. The workplane is based on a Cartesian coordinate system. A Cartesian coordinate system has three axes, X, Y, and Z. Here, 8-1/2,11 was set as the drawing limits. In the Cartesian coordinate system, that value is entered as 8-1/2,11 using a comma with no spaces to separate the X- and Y-axis coordinates. The X-axis coordinate of a Cartesian coordinate system is stated first (8-1/2) and measures drawing limits from left to right (horizontally). The Y-axis coordinate is second (11) and measures drawing limits from bottom to top (vertically). You will be drawing on a vertical 8-1/2″ × 11″ workplane similar to a standard sheet of typing paper. The Z-axis is used in 3D.
drawing limits: The user-defined rectangular area of the drawing covered by lines or dots (when specified) when the grid is on.
Cartesian coordinate system: A coordinate system that has three axes, X, Y, and Z. The X-axis value is stated first and measures left to right horizontally. The Y-axis value is stated second and measures from bottom to top vertically. The Z-axis value is stated third and is used in three-dimensional modeling.
The lower left corner, the origin point of the drawing boundaries, is 0,0 and is where the X- and Y-axes intersect. The upper right corner is 8-1/2,11 (Figure 2-8). These are the limits for Tutorial 2-1. To turn the 8-1/2″ × 11″ area horizontally, enter the limits as 11,8-1/2. With units set to Architectural, AutoCAD defaults to inches, so the inch symbol is not required.
Note
The acad.dwt template provides 1′-0″,0′-9″ as the drawing limits for the upper right corner of the drawing. Remember, to change the upper right limits, you must type the X-axis coordinate first, a comma, and then the Y-axis coordinate second.
The coordinate display numbers in the extreme lower left corner of the AutoCAD screen tell you where the crosshairs on the screen are located in relation to the 0,0 origin. The display updates as you move the cursor.
If you need to change the drawing limits, you may do so at any time by entering new limits to the Specify upper right corner: prompt. Changing the drawing limits will automatically show the grid pattern for the new limits.
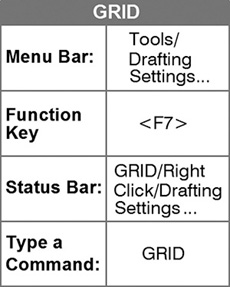
Grid
The grid is a visible pattern of lines or dots on the display screen. The grid is not part of the drawing, but it helps in visualizing the size and relationship of the drawing elements. It can also confirm where your limits are. It is never plotted. Pressing function key <F7> or <Ctrl>+G turns the grid on or off, as does clicking the GRID button at the bottom of the screen.
grid: An area consisting of evenly spaced dots or lines to aid drawing. The grid is adjustable. The grid lines or dots do not plot.
GRIDDISPLAY
GRIDDISPLAY is a system variable that controls the grid behavior using the following settings:
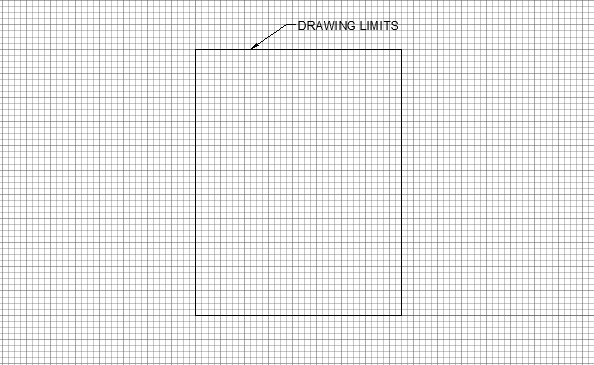
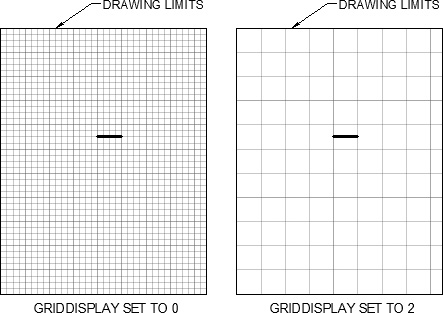
0 When GRIDDISPLAY is set to 0, the grid is restricted to the limits that are set. Currently, the limits are set to 8-1/2,11 as shown in Figure 2-9.
1 When GRIDDISPLAY is set to 1, the grid is not restricted to the limits set, as shown in Figure 2-10.
2 This setting turns on the adaptive grid display. That means when you are zoomed out, the density of the grid is limited. To see the difference between a 1″ line zoomed out with GRIDDISPLAY set to 0 and GRIDDISPLAY set to 2 with GRID set to ¼″, see Figure 2-11.
Step 6. Set GRIDDISPLAY to zero so the grid will be restricted to the area specified by the limits, as described next:
Prompt |
Response |
Type a command: |
Type GRIDDISPLAY <Enter> |
Enter new value for GRIDDISPLAY <3>: |
Type 0 <Enter> |
Step 7. Set the grid spacing, as described next:
Prompt |
Response |
Type a command: |
Type GRID <Enter> |
Specify grid spacing(X) or [ON OFF Snap Major aDaptive Limits Follow Aspect] <0′-0 1/2″>: |
Type 1/4 <Enter> |
Type a command: |
<Enter> (to repeat the GRID command) |
Specify grid spacing(X) or [ON OFF Snap Major aDaptive Limits Follow Aspect] <0′-0 1/4″>: |
Type M <Enter> |
Enter the number of grid divisions per major grid line <5>: |
Type 4 <Enter> |
Note
You can click the options in the command prompt line. Instead of typing M for the option Major, use your mouse to click the option in the command prompt line.
You have just set a grid spacing of 1/4″, where each line is spaced 1/4″ vertically and horizontally, with a major grid line every four spaces. By the way, if you see dots for the grid points instead of grid lines, you need to change your Visual Styles setting from Wireframe 2D to Hidden using Visual Style from the View pull-down menu.
Snap
Step 8. Set the snap spacing, as described next:
Prompt |
Response |
Type a command: |
Type SN <Enter> |
Specify snap spacing or [ON OFF Aspect Legacy Style Type] <0′-0 1/2″>: |
Type 1/8 <Enter> |
You have set 1/8″ as the snap spacing. Snap is an invisible grid on the display screen. When a command is active and you are specifying points, the crosshairs will snap, or lock, to an invisible snap grid when snap is on. When snap is on and points are not being specified, the crosshairs do not snap to a grid. With a setting of 1/8″, each snap point is spaced 1/8″ horizontally and vertically.
Pressing function key <F9> or <Ctrl>+B turns the snap on or off. The snap can also be turned on or off by selecting either option in response to the prompt Specify snap spacing or [ON OFF Aspect Style Type] or by clicking the SNAP button at the bottom of the screen. Snap may be turned on and off while you are drawing.
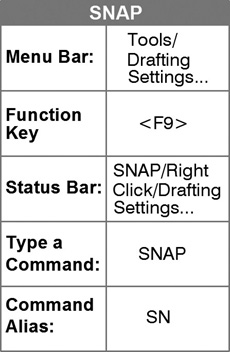
It is helpful to set the snap spacing the same as the grid spacing or as a fraction of the grid spacing so the crosshairs snap to every grid point or to every grid point and in between. The snap can be set to snap several times in between the grid points.
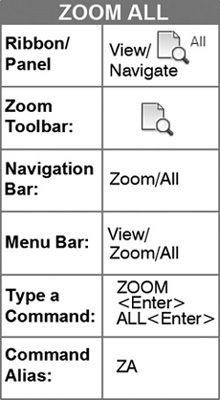
Zoom
Step 9. View the entire drawing area, as described next.
Prompt |
Response |
Type a command: |
Zoom-All (or type Z <Enter>) |
Specify corner of window, enter a scale factor (nX or nXP), or [All Center Dynamic Extents Previous Scale Window Object] <real time>: |
Type A <Enter> |
The Zoom-All command displays the entire drawing limits or extents, whichever is larger. You already know what limits are by setting the limits of the drawing. Extents is anything you have drawn and may be within or outside your limits. In this instance, Zoom-All will provide a view of the drawing limits. With GRIDDISPLAY set to 0 the grid display shows the limits.
zoom: The process of moving around the drawing. Zooming in shows you a close-up view of a drawing area. Zooming out shows you a larger viewing area.
Drafting Settings Dialog Box
You can also set snap and grid by using the Drafting Settings dialog box (Figure 2-12).
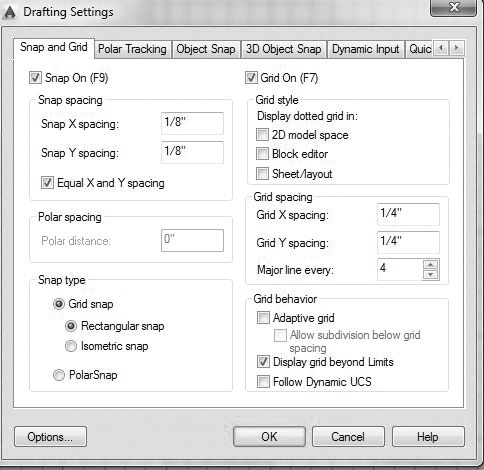
To access the Drafting Settings dialog box, right-click on SNAP or GRID in the status bar and click Settings... (or type DS for Drafting Settings and <Enter>). The dialog box is a handy tool to use in setting the snap and grid spacing, but if you are a fair typist, typing these commands from the keyboard is faster.
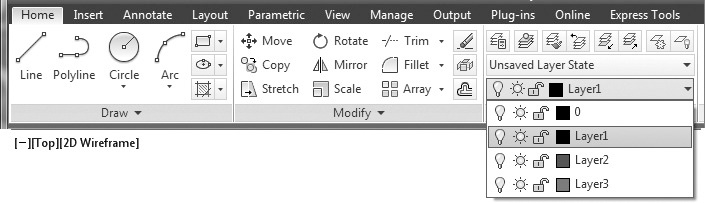
Layers
Different parts of a project can be placed on separate layers (Figure 2-13). The walls may be on one layer, the fixtures on another, the electrical on a third layer, the furniture on a fourth layer, and so on. There is no limit to the number of layers you may use in a drawing. Each is perfectly aligned with all the others. Each layer may be viewed on the display screen separately, one layer may be viewed in combination with one or more of the other layers, or all layers may be viewed together. Each layer may also be plotted separately or in combination with other layers, or all layers may be plotted at the same time. The layer name can be from 1 to 255 characters in length.
layer: A group of drawing objects that are like transparent overlays on a drawing. Layers can be viewed individually or in combination with other layers. Layers can be turned on or off, frozen or thawed, plotted or not plotted, and filtered.
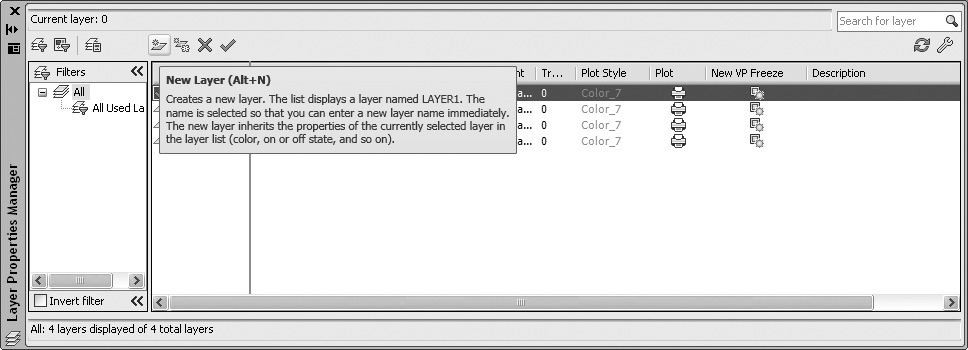
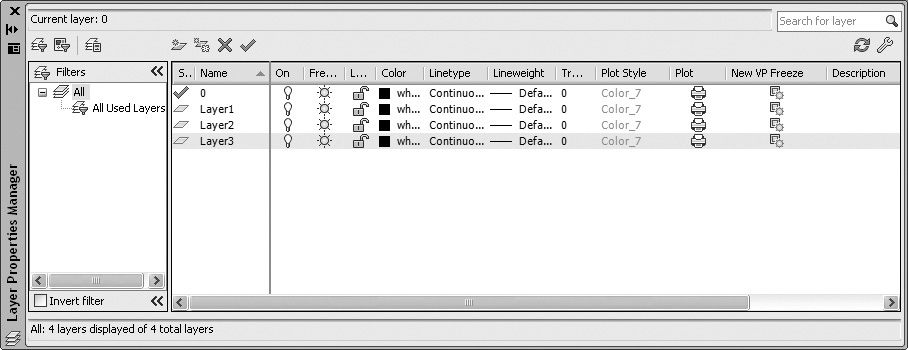
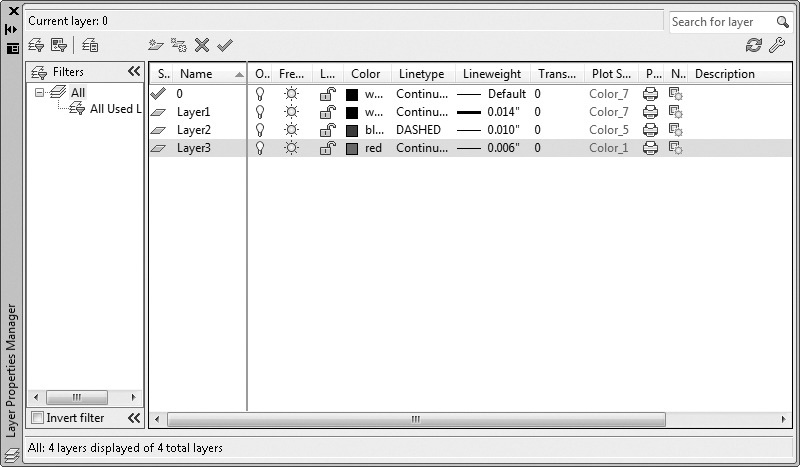
Step 10. Create layers using the Layer Properties Manager palette (Figures 2-14 and 2-15), as described next:
Prompt |
Response |
Type a command: |
Layer Properties (or type LA <Enter>) |
The Layer Properties Manager palette appears: |
Click the New Layer icon three times (see Figure 2-14) |
Layer1, Layer2, Layer3 appear in the Layer Name list (Figure 2-15): |
Click the box under Color, beside Layer1 |
Note
The standard colors are 1 (red), 2 (yellow), 3 (green), 4 (cyan), 5 (blue), 6 (magenta), and 7 (white or black).
Layer Lists
Layer lists are now displayed using natural ordered sort. For example, the layer names 1, 4, 25, 16, 21, 2, 20, 10 are sorted as 1, 2, 4, 10, 16, 20, 21, 25 instead of 1, 10, 16, 2, 20, 21, 25, 4. Natural ordered sort applies to all layer lists including the Hatch Editor Ribbon tab and Quick Select just to name a few. You can restore the ASCII sort used in previous releases by changing the new SORTORDER system variable to 0.

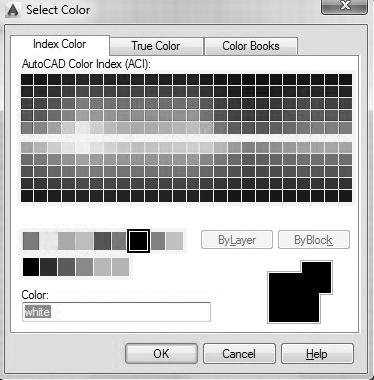
Step 11. Assign colors to layers (Figure 2-16), as described next:
Prompt |
Response |
The Select Color dialog box appears: |
Click the color white (Color Index: 7) (Figure 2-16); click OK |
The Layer Properties Manager palette appears: |
Click the box under Color, beside Layer2 |
The Select Color dialog box appears: |
Click the color blue (Index color: 5) Click OK |
The Layer Properties Manager palette appears: |
Click the box under Color, beside Layer3 |
The Select Color dialog box appears: |
Click the color red (Index color: 1) Click OK |
Step 12. Assign linetypes to layers (Figures 2-17, 2-18, and 2-19), as described next:
Prompt |
Response |
The Layer Properties Manager palette appears: |
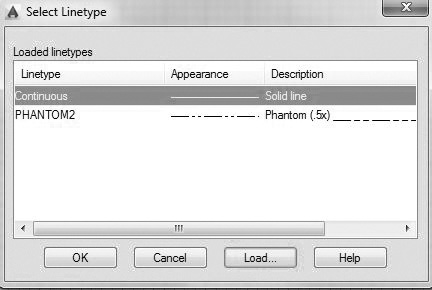
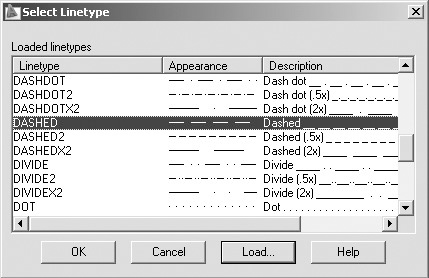
Click the word Continuous under Linetype, beside Layer2 |
The Select Linetype dialog box appears (Figure 2-17): |
Click Load... (to load linetypes so they can be selected) |
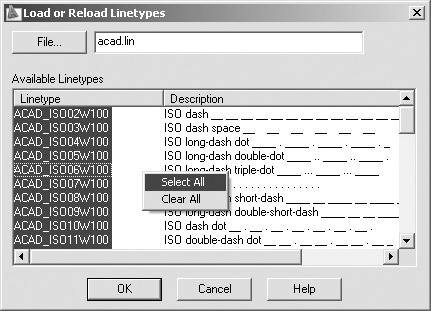
The Load or Reload Linetypes dialog box appears: |
Move the mouse to the center of the dialog box and click the right mouse button Click Select All (Figure 2-18) Click OK |
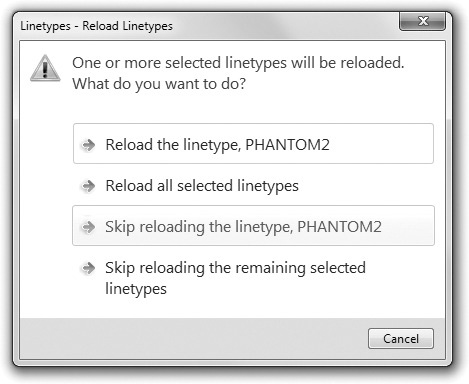
Click Skip reloading the linetype, PHANTOM2 (Figure 2-19) |
Linetypes
Linetypes must be loaded before they can be selected. You can load individual linetypes or you can load several by holding down the <Shift> key as you select. The AutoCAD library of standard linetypes provides you with three different sizes of each standard linetype other than continuous. For example, the DASHED line has the standard size called DASHED, a linetype half the standard size called DASHED2(.5x), and a linetype twice the standard size called DASHEDX2(2x).
linetype: How a line, arc, polyline, circle, or other item is displayed. For example, a continuous line has a different linetype than a hidden line.
Prompt |
Response |
The Select Linetype dialog box appears (Figure 2-20): |
Click DASHED Click OK Click the close button (X) in the upper left corner of the Layer Properties Manager palette |
Lineweights
Lineweights are expressed in millimeters or inches. The default lineweight initially set for all layers is .25 mm, or .010 inch. Lineweights need to be varied, for example, to show thick lines for walls and thin lines for dimensions, to emphasize something on the drawing, to show existing and new construction, or to show existing and new furniture. Lineweight is an important component for drawing legibility. Lineweights are displayed in pixels on the screen; they plot with the exact width of the assigned lineweight.
lineweight: A width value that can be assigned to objects such as lines, arcs, polylines, circles, and many other objects that contain features that have width.
Lineweight Settings Dialog Box
To access the Lineweight Settings dialog box (Figure 2-21), right-click LWT in the status bar and click Settings.... In this dialog box, you can change the Units for Listing from millimeters to inches or reset the default lineweight. You can also adjust the Model tab display scale of lineweights by moving the slider to change the scale.
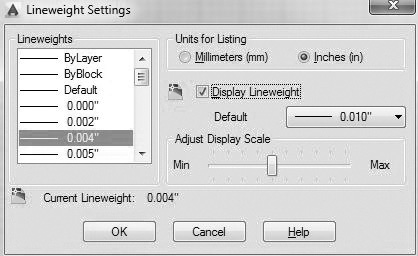
Step 13. Set the Units for Listing in the Lineweight Settings dialog box to Inches. The lineweights will read in inches in the Layer Properties Manager palette instead of millimeters. If you prefer millimeters, set it to millimeters. Pick OK to exit the dialog box.
Step 14. Assign lineweights to layers (Figure 2-22), as described next:
Prompt |
Response |
Type a command: |
Layer Properties (or type LA <Enter>) |
The Layer Properties Manager palette appears: |
Click the word Default under Lineweight, beside Layer1 |
The Lineweight dialog box appears: |
Click 0.014″ (.35mm) Click OK |
The Layer Properties Manager palette appears: |
Click the word Default under Lineweight, beside Layer2 |
The Lineweight dialog box appears: |
Click 0.010″ (.25mm) Click OK |
The Layer Properties Manager palette appears: |
Click the word Default under Lineweight, beside Layer3 |
The Lineweight dialog box appears: |
Click 0.006″ (.15mm) Click OK |
LWT
The display of the lineweights in your drawing is controlled by clicking LWT on the status bar. Lineweights are not displayed unless LWT is on.
Step 15. Turn LWT on (in the status bar).
Step 16. Make a layer current (Figure 2-23), as described next:
Prompt |
Response |
The Layer Properties Manager palette appears with layer names, colors, and linetypes assigned: |
Click Layer1 (to select it) (Figure 2-23). Be sure to click on a layer name, not on one of the other properties such as lock or color. Click Set Current (the green check icon) Click the close button (X) in the upper left corner of the palette |
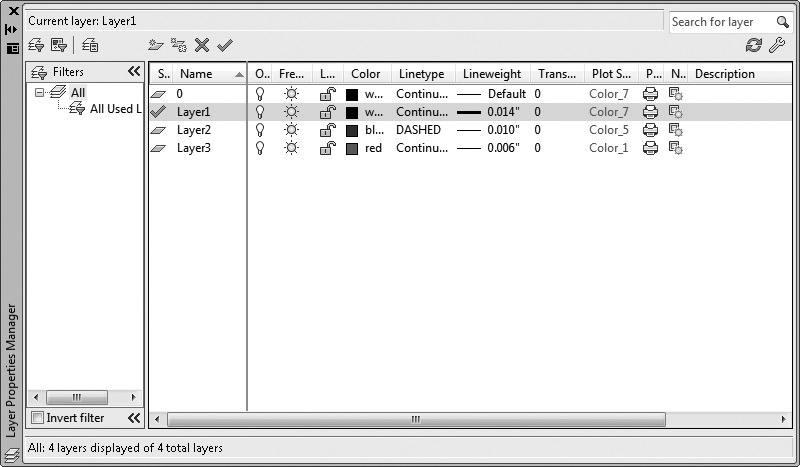
You can also double-click the layer name to set it current. Anything drawn from this point until another layer is set current will be on Layer1.
To change a layer name after using New Layer to create layers, click the layer name to highlight it, then slowly left-click the name again in the Name: input area, and type over the existing name. You can also click the layer name and then use Rename from the right-click menu to rename a layer. You can initially name the layers by clicking New and then typing the layer names separated by a comma. When you type the comma, you move to the next layer.
Additional layer control option icons on the Layer Properties Manager palette and Layers panel of the Home tab of the ribbon (Figure 2-24) that can be changed, reading from left to right, are as follows:
Note
When a layer is off or frozen and it aligns with other layers, it is important not to move objects that align with a frozen or off layer. Objects on the off or frozen layer do not move and will not be aligned with the moved items when you turn the off layer on or thaw the frozen layer. However, when all objects are selected (when you type ALL <Enter> to select objects), objects on a layer that is off and thawed will move.
Turn a Layer On or Off for Entire Drawing: This option pertains to the visibility of layers. When a layer is turned off, it is still part of the drawing, but any entity drawn on that layer is not visible on the screen and cannot be plotted. For instance, the building exterior walls layer, interior walls layer, and electrical layer are turned on and all other layers turned off to view, edit, or plot an electrical plan. One or more layers can be turned off and on as required.
Freeze or Thaw a Layer for Entire Drawing: This option also pertains to the visibility of layers. The difference between on/off and freeze/thaw is a matter of how quickly the drawing regenerates on the display screen. If a layer is frozen, it is not visible and cannot be plotted, and AutoCAD spends no time regenerating it. A layer that is turned off is not visible and cannot be plotted, but AutoCAD does regenerate it.
Lock or Unlock a Layer Globally for Entire Drawing: When a layer is locked, it is visible, and you can draw on it. You cannot use any of the Edit commands to edit any of the drawing entities on the layer. You cannot accidentally change any entity that is already drawn.
To change the state of any layer, pick the icon to select the alternative state. For example, Figure 2-24 shows that Layer1 was turned off by picking the lightbulb to turn it off. Additional layer properties that are shown in the Layer Properties Manager palette are as follows:
Transparency: This option pertains to changing the transparency versus the opaqueness of objects on a layer. You can enter a transparency value between 0 and 90, inclusive.
transparency: A setting that makes an object more or less transparent.
Plot Style: Plot styles are created using a plot style table to define various properties such as color, grayscale, and lineweight. A layer’s plot style overrides the layer’s color, linetype, and lineweight. Plot styles are used when you want to plot the same drawing with different settings or different drawings with the same settings.
Plot: Allows you to make visible layers nonplottable. For example, you may not want to plot a layer that shows construction lines. When a layer is nonplottable, it is displayed but not plotted.
New VP Freeze: Allows you to freeze layers in a newly created viewport.
Description: Allows you to type a general description of the layer in the area.
If you create some layers that you do not need, delete them by highlighting them and picking the Delete icon.
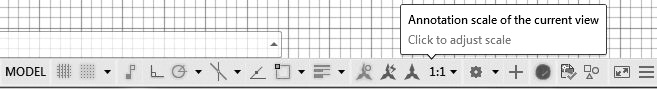
Annotation Scale
Annotation scale is a setting that controls how text and other annotative objects appear on a drawing. This setting affects annotative objects, such as text and dimensions, that are added to drawings that will be scaled when plotted (e.g., scale: 1/4″ = 1′-0″). Each object, such as text or dimensions, has an annotative property that it must be set to for this setting to apply.
annotation scale: A setting that controls the size of text and other annotative objects on the drawing.
Step 17. Make sure your annotation scale located in the lower right corner of the AutoCAD screen is set to the default 1:1 (Figure 2-25).
Saving the Drawing
Step 18. Save the drawing, as described next:
Prompt |
Response |
Type a command: |
Save |
The drawing is saved in the drive and folder selected at the beginning of this exercise. |
Note
Make sure you save your drawing often, so you do not lose any of your work.
Using the Mouse and Right-Click Customization
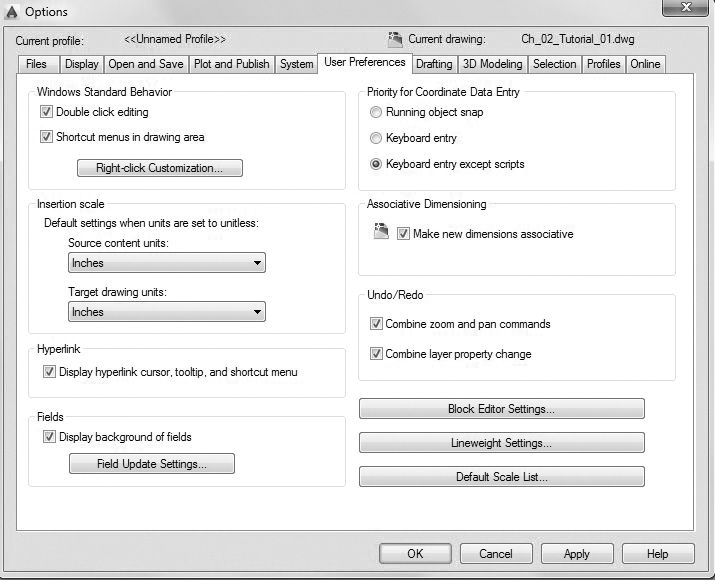
The Right-Click Customization dialog box settings control what happens when you click the right mouse button (shown as <Enter> in this book). To access the Right-Click Customization dialog box, type OP <Enter>. Select the User Preferences tab of the Options dialog box (Figure 2-26). Click the Right-click Customization... button in the Windows Standard Behavior area, and the Right-Click Customization dialog box (Figure 2-27) appears.
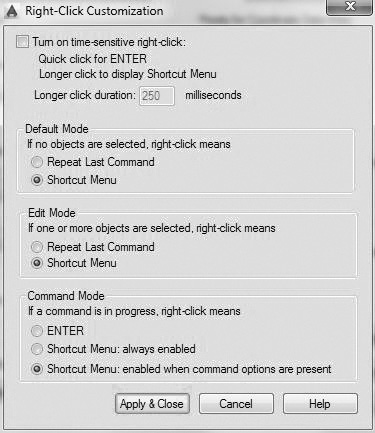
In the Response columns of the exercises, <Enter> indicates that the right mouse button should be clicked. Notes in parentheses are used to clarify how <Enter> is used; for example, <Enter> (to return to the Line command prompt). Leave the Right-Click Customization dialog box set to the default as shown in Figure 2-27. As you become more familiar with AutoCAD, you may decide to change this setting.
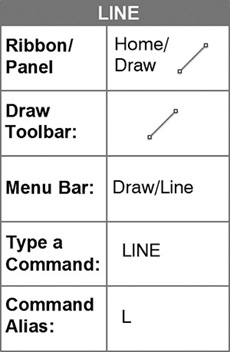
Tutorial 2-1 Part 2, Drawing Lines, Circles, Arcs, Ellipses, and Donuts
Ortho
Press the <F8> function key to turn Ortho mode on and off, or click ORTHO at the bottom of your screen. Ortho mode, when on, helps you draw lines perfectly, horizontally and vertically. It does not allow you to draw at an angle, so turn Ortho off and on as needed.
Ortho: A setting that limits pointing device input to horizontal or vertical (relative to the current snap angle and the user coordinate system).
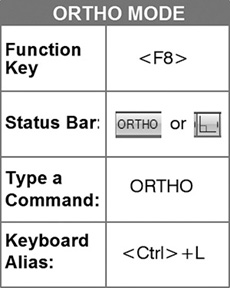
Step 19. Make sure that SNAP, GRID, ORTHO, and LWT are on and the remaining buttons in the status bar are off. Make sure Layer1 is current.
Step 20. Complete a Zoom-All command to make sure you are looking at the entire 8-1/2 × 11 limits of your drawing.
Tip
When Ortho mode is on, drawing or editing a drawing part is restricted to horizontal and vertical movements only. Hold down the <Shift> key as a temporary override key to turn ORTHO off and on. See Appendix B for additional temporary override keys.
Drawing Lines Using the Grid Marks and Snap Increments
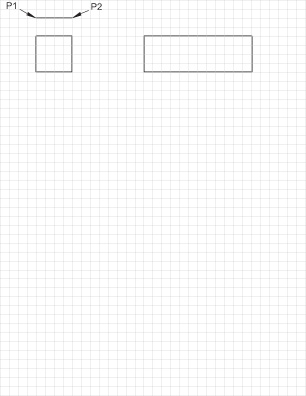
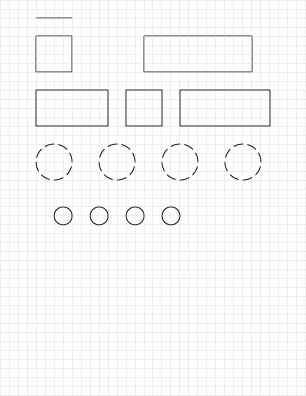
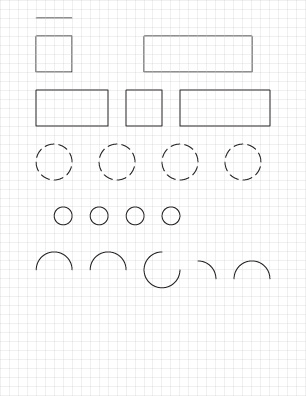
Use Figure 2-28 as a guide when locating the line, squares, and rectangles drawn using the LINE command.
Lines can be drawn by snapping to the grid visible on the screen. The snap is set at 1/8″, and the grid is set at 1/4″. The grid provides a visual cue for the snap points that snap on every grid mark and in between every grid mark.
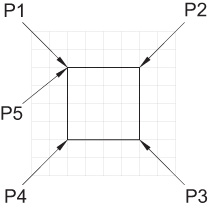
Step 21. Draw a horizontal line 1″ long, using the snap increments and grid marks (Figure 2-28), as described next:
Prompt |
Response |
Type a command: |
Line (or type L <Enter>) |
Specify first point: |
P1→ (Do not type “P1.” Look at Figure 2-28 and click the point P1→, approximately two grid spaces down (1/2″) and four grid spaces to the right (1″) of the upper left corner of the page.) |
Specify next point or [Undo]: |
P2→ (move your mouse four grid marks to the right and click the point P2→) |
Specify next point or [Undo]: |
<Enter> When the right mouse button is used for <Enter>, a shortcut menu appears, and <Enter> must be clicked on the shortcut menu to complete the command. When the keyboard <Enter> key or the space bar is used, the command is completed, and the shortcut menu does not appear. |
Prompt |
Response |
Type a command: |
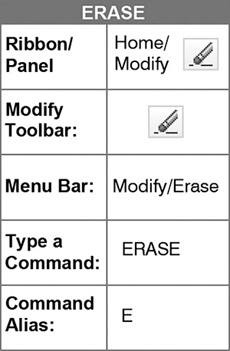
Erase (or type E <Enter>) |
Select objects: |
Position the small box that replaces the crosshairs anyplace on the line and click the line |
Select objects: 1 found Select objects: |
<Enter> (the line disappears) |
Type a command: |
Type U <Enter> (the line reappears) |
Note
Use the Undo arrow in the Quick Access toolbar to reverse the most recent action. Click the arrow to the right of the Undo arrow to see a list of actions you can undo. The Redo arrow reverses the effect of the Undo arrow and also has a list of actions you can redo.
Do not be afraid to draw with AutoCAD. If you make a mistake, you can easily erase it using the ERASE command. The UNDO command will restore everything erased by the ERASE command. When you are using the ERASE command, a small box replaces the screen crosshairs. The small box is called the pickbox.
Step 23. Draw a 1″ square using the snap increments and grid marks and undo the last two lines (Figure 2-29), as described next:
Prompt |
Response |
Type a command: |
Line |
Specify first point: |
P1→ (click a point 1/2″ directly below the left end of the line just drawn) |
Specify next point or [Undo]: |
P2→ (Figure 2-29) |
Specify next point or [Undo]: |
P3→ |
Specify next point or [Close Undo]: |
P4→ |
Specify next point or [Close Undo]: |
P5→ |
Type U <Enter> (move your mouse to see that the line is undone) |
|
Specify next point or [Close Undo]: |
Type U <Enter> |
Specify next point or [Close Undo]: |
<Enter> (to stop and return to the command prompt) |
While in the LINE command, if you decide you do not like the last line segment drawn, use the UNDO command to erase it and continue on with the Specify next point or [Close Undo]: prompt. Clicking more than one undo will backtrack through the line segments in the reverse order in which they were drawn.
Step 24. Complete the square (Figure 2-29), as described next:
Prompt |
Response |
Type a command: |
<Enter> (to return the Line command prompt) |
Specify first point: |
<Enter> (to see the line attached, turn the grid off and back on). |
Specify next point or [Undo]: |
P4→ |
Specify next point or [Undo]: |
P5→ |
Specify next point or [Close Undo]: |
<Enter> (to stop) |
The LINE command has a very handy feature: If you respond to the Specify first point: prompt by pressing the <Enter> key or the space bar, the line will start at the end of the most recently drawn line.
Tip
Pressing the <Esc> key cancels the command selection process and returns AutoCAD to the command prompt. Use <Esc> if you get stuck in a command.
Drawing Lines Using Absolute Coordinates
Remember, 0,0 is the lower left corner of the page, the origin point of the Cartesian coordinate system. When you use absolute coordinates to draw, the X-axis coordinate is entered first and identifies a location on the horizontal axis. The Y-axis coordinate is entered second and identifies a location on the vertical axis. The page size is 8-1/2,11. A little adding and subtracting to determine the absolute coordinates will locate the rectangle on the page as follows.
absolute coordinates: Coordinate values measured from an origin point or 0,0 point in the drawing.
Step 25. Draw a rectangle using absolute coordinates (Figure 2-30), as described next. Remember: GRID, SNAP, ORTHO, and LWT should be on.
Prompt |
Response |
Type a command: |
Line (move the crosshairs to the center of the screen) |
Specify first point: |
Type 4,10 <Enter> (the line begins) |
Specify next point or [Undo]: |
Type 7,10 <Enter> |
Specify next point or [Undo]: |
Type 7,9 <Enter> |
Specify next point or [Close Undo]: |
Type 4,9 <Enter> |
Specify next point or [Close Undo]: |
Type C <Enter> |
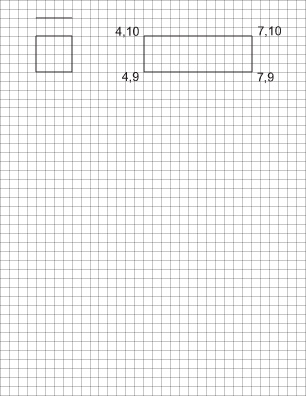
Step 26. Click on the coordinate display to turn the screen coordinate display on (if needed) and move your pointer to each corner of the square. Watch how the screen coordinate display shows the X,Y coordinate position of each corner. Compare those coordinates with the coordinates you just typed and entered. They are the same.
Note
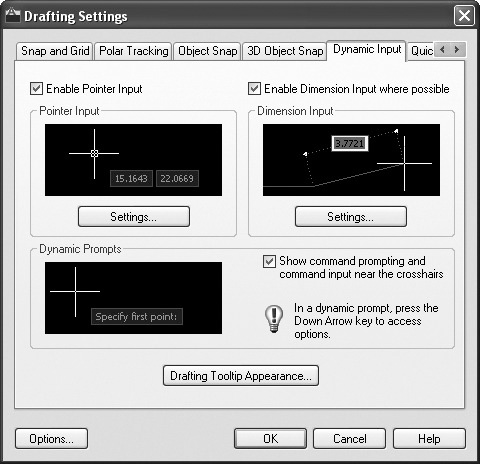
If you turn DYN on by clicking it on the status bar, you will see the dynamic input display attached to the cursor. The appearance of dynamic input display is controlled by the settings made in the Drafting Settings dialog box. Right-click on DYN in the status bar to access these settings.
Drawing Lines Using Relative Coordinates
Relative coordinates are used after a point is entered. (Relative to what? Relative to the point just entered.) After a point has been clicked on the drawing, relative coordinates are entered by typing @, followed by the X,Y coordinates. For example, after a point is entered to start a line, typing and entering @1,0 will draw the line 1″ in the X direction, 0″ in the Y direction.
relative coordinates: Coordinates specified in relation to a previous point picked. Relative coordinates are entered by typing @ followed by the X and Y coordinates. For example, after a point is entered to start a line, typing and entering @1,0 will draw the line 1″ in the X direction and 0″ in the Y direction.
Step 27. Set Layer3 current. Layer3 has a .006″ (.15mm) lineweight.
Step 28. Draw a rectangle using relative coordinates (Figure 2-31), as described next:
Prompt |
Response |
Type a command: |
Line |
Specify first point: |
Click a point on the grid 1/2″ below the lower left corner of the first square drawn |
Specify next point or [Undo]: |
Type @2,0 <Enter> |
Specify next point or [Undo]: |
Type @0,–1 <Enter> |
Specify next point or [Close Undo]: |
Type @–2,0 <Enter> |
Specify next point or [Close Undo]: |
Type C <Enter> |
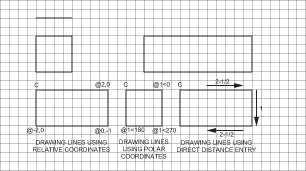
Figure 2-31 Draw a rectangle using relative coordinates, a square using polar coordinates, and a rectangle using direct distance entry
A minus sign (–) is used for negative line location with relative coordinates. Negative is to the left for the X-axis and down for the Y-axis.
Tip
Remember, you can change the colors of the elements in the drawing window. Type OP <Enter> to display the Options dialog box. Click the Display tab and the Colors... button to access the Drawing Window Colors dialog box.
Drawing Lines Using Polar Coordinates
Absolute and relative coordinates are extremely useful in some situations; however, for many design applications (for example, drawing walls) polar coordinates or direct distance entry is used. Be sure you understand how to use all types of coordinates.
polar coordinates: Coordinate values that are entered relative to the last point picked. They are typed starting with an @ followed by a distance and angle of direction; the angle is preceded by a < sign.
Polar coordinates are also relative to the last point entered. They are typed starting with an @, followed by a distance and angle of direction. Figure 2-32 shows that the default direction for positive angles is counterclockwise. The angle of direction is always preceded by a < sign when polar coordinates are entered.
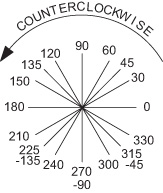
You can change the direction for positive angles to clockwise by clicking to add a check mark in the Clockwise box on the Drawing Units dialog box. We will use the default counterclockwise direction in this book.
Step 29. Draw a 1″ square using polar coordinates (Figure 2-31), as described next:
Prompt |
Response |
Type a command: |
<Enter> (to return to the Line command prompt) |
Specify first point: |
Click a point on the grid 1/2″ to the right of the upper right corner of the last rectangle drawn |
Specify next point or [Undo]: |
Type @1<0 <Enter> |
Specify next point or [Undo]: |
Type @1<270 <Enter> |
Specify next point or [Close Undo]: |
Type @1<180 <Enter> |
Specify next point or [Close Undo]: |
Type C <Enter> |
Drawing Lines Using Direct Distance Entry
Direct distance entry is a quick, accurate, and easy way to draw lines. It can also be used with any other command that asks you to specify a point. Click on the screen first, then move your mouse in the direction you want to draw, type the distance, and press <Enter>.
direct distance entry: The process of specifying a second point by first moving the cursor to indicate direction and then entering a distance.
Step 30. Draw a rectangle using direct distance entry (Figure 2-31), as described next:
Prompt |
Response |
Type a command: |
Line (with ORTHO on) |
Specify first point: |
Click a point on the grid 1/2″ to the right of the upper right corner of the square just drawn |
Specify next point or [Undo]: |
Move your mouse to the right; type 2-1/2 <Enter> |
Specify next point or [Undo]: |
Move your mouse down; type 1 <Enter> |
Specify next point or [Close Undo]: |
Move your mouse to the left; type 2-1/2 <Enter> |
Type C <Enter> |
DYN
As you gain more experience, you may want to use dynamic input to draw. Click DYN at the bottom of your screen to turn dynamic input on and off. When on, DYN mode displays three tooltips of command information near your cursor. These are pointer input, dimension input, and dynamic prompts (see Figure 2-33).
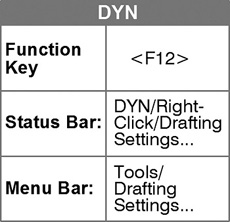
When DYN is on, you can enter coordinate values into the input fields instead of using the command line. They are entered as follows:
To enter absolute coordinates type the pound sign (#) prefix, then the absolute coordinates, and press <Enter> (example: #4,4 <Enter>).
Entering relative coordinates is the default. To enter relative coordinates type the relative coordinates without the @ sign, and press <Enter> (example: 5,3 <Enter>).
To enter polar coordinates: type the distance from the first point, press <Tab> (to lock the value), then type the angle value, and press <Enter>.
Right-click DYN on the status bar, then click Settings... to access the Dynamic Input tab of the Drafting Settings dialog box (Figure 2-33). On this tab, you can control the display of the three tooltips near your cursor when DYN is on. Hold <F12> down to turn DYN off temporarily.
Circle
Step 31. Look at Figure 2-34 to determine the approximate location of the four dashed-line circles you will draw.
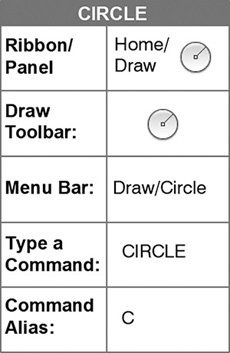
Step 32. Set Layer2 current. Layer2 has a dashed linetype.
Step 33. Turn ORTHO off; SNAP, GRID, and LWT are on.
Center, Radius
Step 34. Draw a circle with a 1/2″ radius (Figure 2-35), as described next:
Prompt |
Response |
Type a command: |
Center, Radius (or type C <Enter>) |
Specify center point for circle or [3P 2P Ttr(tan tan radius)]: |
P1→ (Figure 2-35) |
Specify radius of circle or [Diameter]: |
Type 1/2 <Enter> (the circle appears) |
Center, Diameter
Step 35. Draw a circle with a 1″ diameter (Figure 2-35), as described next:
Prompt |
Response |
Type a command: |
<Enter> (to return to the CIRCLE command prompt) |
Specify center point for circle or [3P 2P Ttr(tan tan radius)]: |
P1→ (Figure 2-35) |
Specify radius of circle or [Diameter] <0′-0 1/2″>: |
Type D <Enter> (to specify diameter) |
Specify diameter of circle <0′-1″>: |
<Enter> (the circle appears) |
2 Points
Step 36. Draw a 1″-diameter circle by locating the two endpoints of its diameter (Figure 2-35), as described next:
Prompt |
Response |
Type a command: |
2 Point |
Specify center point for circle or [3P 2P Ttr(tan tan radius)]: _2p |
|
Specify first endpoint of circle’s diameter: |
P2→ (on a grid mark, Figure 2-35) |
Specify second endpoint of circle’s diameter: |
P3→ (move four grid spaces to the right) |
3 Points
Step 37. Draw a 1″-diameter circle by clicking three points on its circumference (Figure 2-35), as described next:
Prompt |
Response |
Type a command: |
3 Point |
Specify center point for circle or [3P 2P Ttr(tan tan radius)]: _3p |
|
Specify first point on circle: |
P2→ (Figure 2-35) |
Specify second point on circle: |
P3→ (move four grid spaces to the right) |
Specify third point on circle: |
P4→ (the center of the top of the circle) |
You have just learned four different methods of drawing the same-size circle. You can watch the size of the circle change on the screen by moving the pointer, and you can select the desired size by clicking the point that indicates the size.
TTR
The next option of the CIRCLE command is Tan, Tan, Radius. This stands for tangent, tangent, and radius. A tangent touches a circle at a single point.
LTSCALE
AutoCAD provides a variety of linetypes that you may use. For example, the DASHED linetype provided by AutoCAD consists of 1/2″ line segments with 1/4″ spaces in between. The given line segment length (1/2″) and spacing (1/4″) for the DASHED linetype are drawn when the global linetype scale factor is set to 1 (the default).
To make the line segment length or spacing smaller, enter a linetype scale factor smaller than 1 but larger than 0 at the LTSCALE prompt. To make the line segment length and spacing larger, enter a linetype scale factor larger than 1. Look closely to see the circle’s DASHED linetype scale change when the following is entered.
Step 38. Use LTSCALE to change the size of the DASHED linetype, as described next:
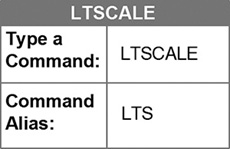
Prompt |
Response |
Type a command: |
Type LTSCALE <Enter> |
Enter new linetype scale factor <1.0000>: |
Type 1/2 <Enter> |
Regenerating model. |
ZOOM
The most commonly used ZOOM commands (Extents, Window, Previous, Realtime, and All) help you control how you view the drawing area on the display screen. While drawing the lines and circles for this chapter you have been able to view the entire 8-1/2″ × 11″ drawing limits on the screen. The Zoom-All command was used earlier to assure that view. The ZOOM commands are located on the navigation bar and the ribbon (Figure 2-36).
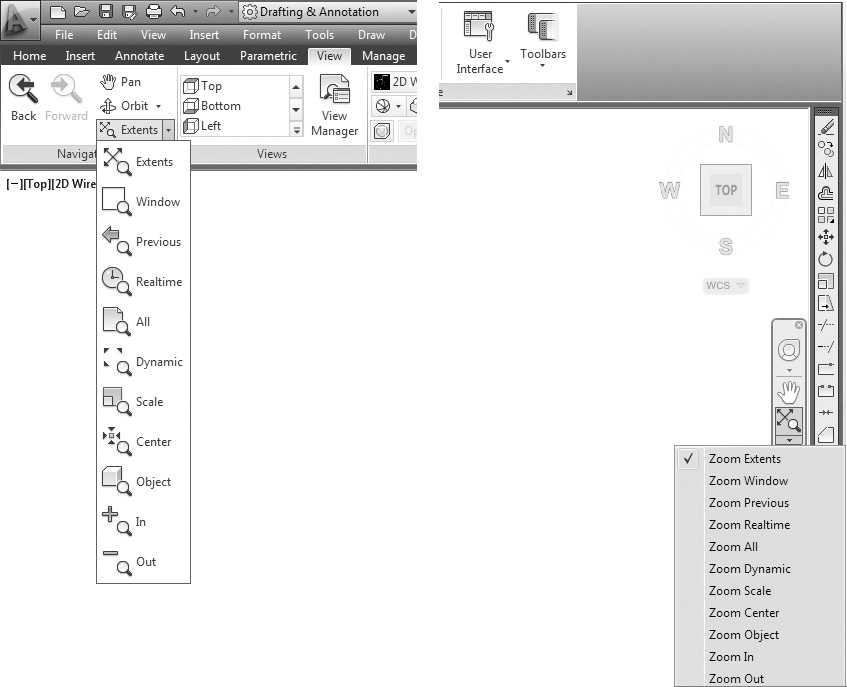
Zoom-Window
The Zoom-Window command allows you to pick two opposite corners of a rectangular window on the screen. The cursor changes to form a rubber band that shows the size of the window on the screen. The size of the window is controlled by the movement of the mouse. The part of the drawing inside the windowed area is magnified to fill the screen when the second corner of the window is clicked.
Step 39. Use Zoom-Window to look more closely at the four circles (Figure 2-37), as described next:
Prompt |
Response |
Type a command: |
Type Z <Enter> |
Specify corner of window, enter a scale factor (nX or nXP), or [All Center Dynamic Extents Previous Scale Window Object] <real time>: |
P1→ (lower left corner of the window, Figure 2-37) |
Specify opposite corner: |
P2→ (upper right corner of the window) |
Zoom-All
Now that you have a windowed area of the drawing, how do you return to the entire drawing view? The drawing extents include whatever graphics are actually drawn on the page. If only half of the page is full of graphics, the extents will take up half of the page. Sometimes, graphics are drawn outside the limits; this, too, is considered the drawing extents. The limits of the drawing are set with the Limits command. The Zoom-All command displays the entire drawing limits or extents, whichever is larger. In this instance, Zoom-All will provide a view of the drawing limits.
Step 40. Use Zoom-All to view the entire drawing, as described next:
Prompt |
Response |
Type a command: |
Zoom-All (or type Z <Enter>) |
Specify corner of window, enter a scale factor (nX or nXP), or [All Center Dynamic Extents Previous Scale Window Object] <real time>: |
Type A <Enter> |
Zoom-Previous
Zoom-Previous is a very convenient feature. AutoCAD remembers up to 10 previous views. This is especially helpful and saves time if you are working on a complicated drawing.
Step 41. Use Zoom-Previous to see the last view of the tangent circles again, as described next:
Prompt |
Response |
Type a command: |
<Enter> (to repeat the ZOOM command) |
Specify corner of window, enter a scale factor (nX or nXP), or [All Center Dynamic Extents Previous Scale Window Object] <real time>: |
Type P <Enter> |
Zoom-Extents
The extents of a drawing include whatever graphics are actually drawn on the page. The Zoom-Extents command provides a view of all drawing entities on the page as large as possible to fill the screen.
Step 42. Use Zoom-Extents to view the extents of drawing CH2-TUTORIAL1.
Zoom-Object
Zoom-Object allows you to select an object or objects and press <Enter> to describe the area that will be displayed.
Zoom-Realtime
Press <Enter> at the Zoom prompt to activate Zoom-Realtime. After activating the command, to zoom in or out, hold down the left mouse button and move the mouse up or down to change the magnification of the drawing. Press the right mouse button to access a shortened Zoom and Pan menu. Click Exit or press <Esc> to exit the command.
Wheel Mouse
You can also zoom in and out by turning the wheel of a two-button mouse.
PAN REALTIME
The Pan Realtime command is located on the navigation bar and on the ribbon. Pan allows you to maintain the current display magnification and see parts of the drawing that may be off the screen and not visible in the display. Like panning with a camera, Pan does not change the magnification of the view.
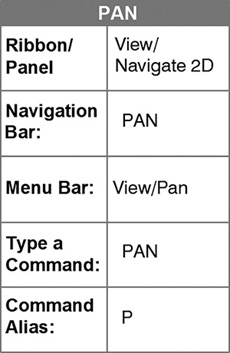
You may also type P <Enter> to activate this command. To move the view of your drawing at the same magnification, hold down the left button on your mouse and move the mouse in any direction to change the view of your drawing.
Wheel Mouse
If you have a wheel mouse, you can pan by pressing down on the wheel and moving the mouse.
Transparent Commands
A transparent command is one that can be used while another command is in progress. It is convenient to be able to change the display while a command such as Line is in progress. All the ZOOM commands and the PAN command from the navigation bar and the ribbon may be used transparently; you can simply click them.
transparent command: A command that can be used while another command is in progress.
Commands that do not select objects, create new objects, or end the drawing session also usually can be used transparently. The grid and snap settings can be used transparently. After you have entered a command such as Line, you can type ’CAL <Enter> to start the calculator command transparently, type ’P <Enter> to start the PAN command, or type ’grid to change the grid setting. An apostrophe (’) must precede the command name. The >> preceding the command prompt in the command line window indicates the command is being used transparently.
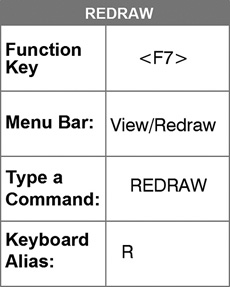
REDRAW
When you pick Redraw from the View menu or type R <Enter>, AutoCAD redraws and cleans up your drawing. Drawing entities affected by editing of other objects are redrawn. Pressing function key <F7> twice turns the grid off and on and also redraws the screen.
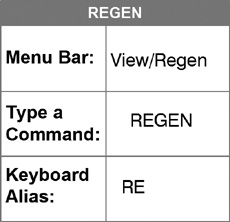
REGEN
When you click Regen from the View menu, AutoCAD regenerates the entire drawing.
Tip
Sometimes when you are viewing an entire page and zoom in on a circle, it will be made of small line segments. When the magnification of the circle was enlarged, to save time AutoCAD did not regenerate the drawing. When the entire page is displayed, fewer line segments are used to make up the circle. When you type and enter Regen, AutoCAD regenerates the circle with the optimal number of line segments, making the circle smoother for the larger magnification.
HIGHLIGHT
When you select any object such as a circle or line to erase or move or otherwise modify, the circle or line is highlighted. This highlighting is controlled by the HIGHLIGHT system variable. When you type HIGHLIGHT <Enter>, the HIGHLIGHT command has two responses: enter 1 to turn highlighting on, or 0 to turn highlighting off. You will need to have this variable on so the items selected are confirmed by the highlighting.
Move and Editing Commands Selection Set
You may want to move some of the items on your page to improve the layout of the page. The MOVE command allows you to do that.
Step 43. Set Layer1 current.
Step 44. Use Zoom-All to view the entire drawing. Use Zoom-Realtime as needed to draw the circles in the next step.
Step 45. Draw a row of four 1/2″-diameter circles, 1″ on center (1″ from the center of one circle to the center of the next circle), as shown in Figure 2-38.
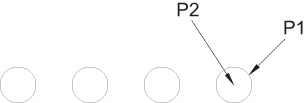
Step 46. Pick Move from the ribbon (or type M <Enter>).
Step 47. Select a circle by clicking a point on the circle, and move it (Figure 2-39), as described next:
Prompt |
Response |
Select objects: |
P1→ (any point on the circumference of the circle, as shown in Figure 2-39) |
Select objects: 1 found Select objects: |
<Enter> (you have completed selecting objects) |
Specify base point or [Displacement] <Displacement>: |
P2→ (the center of the circle—be sure SNAP is on) |
Specify second point or <use first point as displacement>: |
Click a point three grid spaces (3/4″) to the right -or- with ORTHO on, move your mouse to the right; type 3/4 <Enter> |
Note
Keep snap on while moving a drawing entity. Snap from one grid point (base point or displacement) to another (second point).
Step 48. Select a circle by clicking a point on the circle, and move it using relative coordinates (Figure 2-40), as described next:
Prompt |
Response |
Type a command: |
<Enter> (to repeat the Move command prompt) |
Select objects: |
P1→ (Figure 2-40) |
Select objects: 1 found Select objects: |
<Enter> |
P2→ (the center of the circle) |
|
Specify second point or <use first point as displacement>: |
Type @–3/4,0 <Enter> |
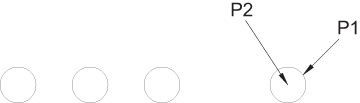
Figure 2-40 Select a circle by clicking a point on the circle, and move it using relative coordinates
Note
When you use the MOVE command, the base point can be anyplace on the drawing if you give a specific direction and distance for the second point.
You can give the second point of displacement by clicking a point on the screen or by using absolute, relative, or polar coordinates, or direct distance entry.
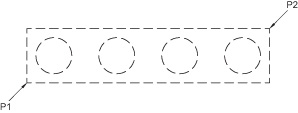
Step 49. Select items to be edited by using a window, and then remove an item from the selection set (Figure 2-41), as described next:
Prompt |
Response |
Type a command: |
<Enter> (to repeat the Move command prompt) |
Select objects: |
P1→ (Figure 2-41) |
Specify opposite corner: 4 found |
P2→ |
Select objects: |
Type R <Enter> (or hold down the <Shift> key) |
Remove objects: |
P3→ |
<Enter> |
|
Specify base point or [Displacement] <Displacement>: |
P4→ (the center of the circle or anyplace on the drawing) |
Specify second point or <use first point as displacement>: |
With ORTHO on, move your mouse down; type 1/2 <Enter> |
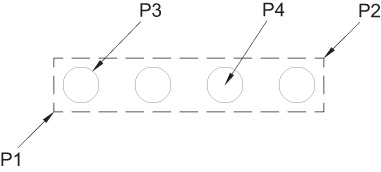
Figure 2-41 Select items to be edited by using a window, and then remove an item from the selection set
Options for Selecting Objects to Modify
After you pick Move, the prompt in the prompt line asks you to Select objects:. Also, a pickbox replaces the screen crosshairs. The pickbox helps you select the item or group of items to be moved by positioning the pickbox on the item. The item or group of items selected is called the selection set. Many of the AutoCAD Modify commands provide the same prompt, the pickbox, and also the same options used to select the object or objects to be edited. To view all the options used to select an object or objects, type and enter a ? at the Select objects: prompt. The options are Window/Last/Crossing/Box/All/Fence/WPolygon/Cpolygon/Group/Add/Remove/Multiple/Previous/Undo/AUto/SIngle/Subobject/Object. We will cover some of the more commonly used options used to select objects.
Window (W) and Crossing Window (C)
The window selection (picking left to right) and crossing window selection (picking right to left) options allow you to pick two opposite corners of a rectangular window on the screen. The crosshairs of the pointer change to form a rubber band that shows the size of the window on the screen. The size of the window is controlled by the movement of the pointer.
With the window selection option, only the parts of the drawing that are entirely contained within the window are selected to be edited. If the window covers only a part of a drawing entity, that entity is not selected. You may also type W <Enter> at the Select objects: prompt to activate the Window response.
When you use the crossing window selection, any part of the drawing that is contained within or crossed by the crossing window is included in the selection set. With a crossing window, a drawing entity such as a line or circle does not have to be entirely contained within the window to be selected—it only has to be touched by the crossing window. The colors of both the crossing window and the window are controlled by the Visual Effect Settings on the Selection tab of the Options dialog box.
Picking an empty area on the drawing and moving your mouse to the right creates a window. Picking and moving to the left creates a crossing window.
Tip
Typing W <Enter> or C <Enter> to activate a window or a crossing window is helpful when the drawing area is dense and clicking an empty area is difficult or impossible.
Step 50. Return the circles to the approximate location as shown in Figure 2-38.
Fence (F)
Allows you to click points that draw a line that selects any objects it crosses.
Remove (R) and Add (A)
The Remove option allows you to remove a drawing part from the selection set. If you are in the Remove mode and decide to add another drawing part to the selection set, type A <Enter> to return to the Add mode.
Last (L) and Previous (P)
The Last option selects the most recent drawing entity created. The Previous option selects the most recent selection set. Both are handy if you want to use several editing commands on the same drawing entity or the same selection set. You may also type and enter L or P from the keyboard while you are in a command and selecting objects.
Undo (U)
While in an editing command, if you decide you do not want something in a selection set, you may use the UNDO command to remove it and continue on with the Select objects: prompt. Typing U <Enter> backtracks through the selection sets in the reverse of the order in which they were selected.
Grips
Grips are small squares that appear on an object if it is selected with no command active. Grips are very useful and can speed up your use of many of the Modify commands.
grips: Small squares, rectangles, and triangles that appear on objects you select when no command is active. After selecting the grip, you can move, stretch, rotate, scale, copy, add a vertex, convert a line to an arc, convert an arc to a line, and mirror the objects without entering commands.
Tip
If grips appear when you do not want them, press the <Esc> key.
Step 51. Use grips to change the size of a circle; then move, scale, and rotate several circles at the same time, as described next:
Prompt |
Response |
Type a command: |
With no command active, click on one of the ½″ diameter circles you have drawn |
Small blue squares (grips) appear at each quadrant and at the center of the circle: |
Click one of the grips at one of the quadrants of the circle |
The grip changes color (becomes hot). Specify stretch point or [Base point Copy Undo eXit]: |
Move your mouse to see that the size of the circle changes, then type 3/4 <Enter> |
Click Undo (or type U <Enter>) to return the circle to its previous size |
|
Type a command: |
Using a window, select all four 1/2″ diameter circles |
Grips appear at each quadrant and at the centers of all circles: |
Click the grip at the far left quadrant |
The grip changes color (becomes hot). |
|
**STRETCH** Specify stretch point or [Base point Copy Undo eXit]: |
Press the space bar to advance to the Move grip mode in the command area |
**MOVE** Specify move point or [Base point Copy Undo eXit]: |
Move your mouse to the right to see that the circles move with your cursor. You can now type the distance to move the circles or you can click the destination point. For now, type 5 <Enter> to move the circles 5″ to the right. |
With all circles still displaying grips: |
Click the grip at the far left quadrant |
The grip changes color (becomes hot). |
|
**STRETCH** Specify stretch point or [Base point Copy Undo eXit]: |
Press the space bar twice to advance to the Rotate grip mode |
**ROTATE** Specify rotation angle or [Base point Copy Undo Reference eXit]: |
Move your mouse so you can see that the circles are rotated. You can now type an angle or you can click a point to select the angle. For now, type 45 <Enter> to rotate the circles 45°. |
Type a command: |
Click Undo twice (or type U <Enter> twice) to return the circles to their original position. |
Note
Hold down the <Shift> key to select multiple grips.
UNDO and REDO
Understanding how to use the UNDO command can be very helpful when drawing with AutoCAD.

When the Undo icon on the Quick Access toolbar is clicked, the most recent command is undone. To undo more than one command, click the Undo icon more than once or use the list provided under the down arrow to undo a group of commands. The Redo icon becomes active and you can immediately use the Redo icon or list to redo as many commands as you need. If you resume drawing immediately after using the Undo icon, the Redo icon does not become active.
When U is typed from the keyboard at the command prompt, and the <Enter> key is pressed, the most recent command operation is undone. Most of the time the operation that is undone is obvious, such as when a line that you have just drawn is undone. The most recent mode settings that are not obvious, such as Snap, will be undone also. Typing REDO and pressing <Enter> will redo only one undo, and must immediately follow the U or UNDO command.
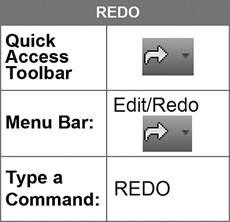
When U is typed and entered from the keyboard, no prompt line appears. If you type UNDO <Enter>, the prompt Enter the number of operations to undo or [Auto Control BEgin End Mark Back] <1>: appears. The default is <1>. You may enter a number for the number of operations to be undone. For instance, if 5 is entered at the prompt, five operations will be undone. If you decide you went too far, you can type REDO <Enter> or select Redo from the Standard toolbar, and all five operations will be restored.
Typing U from the keyboard and pressing the <Enter> key is the same as entering the number 1 at the Undo prompt. In that instance, Redo will redo only one undo, no matter how many times you typed and entered U.
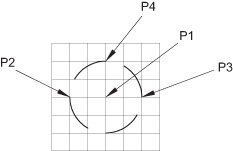
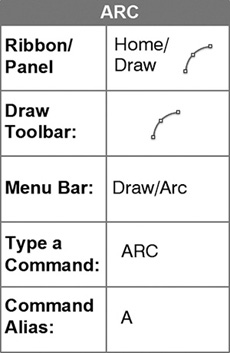
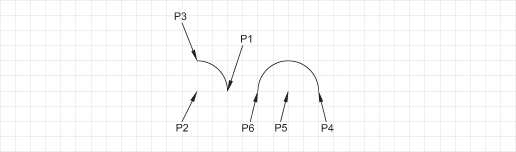
ARC
There are many methods from which to choose when you are drawing arcs. Whatever the situation, you can select a method to suit your needs. Experiment with the different methods described next and decide which ones you prefer to use. Use Figure 2-42 as a guide when locating the approximate location of the arcs on your drawing.
3-Point
Using the 3-point method, you can draw an arc clockwise or counterclockwise by specifying the start point, second point, and endpoint of the arc.
Step 52. Draw three arcs using the 3-point method (Figure 2-43), as described next:
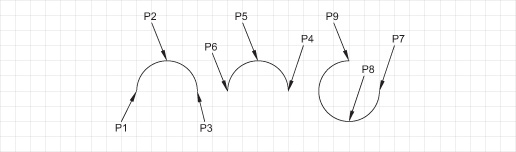
Prompt |
Response |
Type a command: |
3 Point (or type A <Enter>) |
Specify start point of arc or [Center]: |
P1→ |
Specify second point of arc or [Center End]: |
P2→ (Figure 2-43) |
Specify end point of arc: |
P3→ |
Command: |
<Enter> (repeat ARC) |
Specify start point of arc or [Center]: |
P4→ |
Specify second point of arc or [Center End]: |
P5→ |
Specify end point of arc: |
P6→ |
<Enter> (repeat ARC) |
|
Specify start point of arc or [Center]: |
P7→ |
Specify second point of arc or [Center End]: |
P8→ |
Specify end point of arc: |
P9→ |
Start, Center, End
The Start, Center, End method allows you to draw an arc only counterclockwise, by specifying the start, center, and end.
Step 53. Draw two arcs using the Start, Center, End method (Figure 2-44), as described next:
Prompt |
Response |
Type a command: |
Arc-Start, Center, End |
Specify start point of arc or [Center]: |
P1→ |
Specify second point of arc or [Center End]:_c Specify center point of arc: |
P2→ (Figure 2-44) |
Specify end point of arc or [Angle chord Length]: |
P3→ |
Command: |
Arc-Start, Center, End |
Specify start point of arc or [Center]: |
P4→ (Figure 2-44) |
Specify second point of arc or [Center End]:_c Specify center point of arc: |
P5→ |
Specify end point of arc or [Angle chord Length]: |
P6→ |
Start, Center, Angle
In the Start, Center, Angle method, A is the included angle (the angle the arc will span). A positive angle will draw the arc counterclockwise; a negative angle will draw the arc clockwise.
Start, Center, Length
In the Start, Center, Length method, L is the chord length. A chord is a straight line that connects an arc’s start point and endpoint. A positive chord length can be entered to draw a minor arc (less than 180°), and a negative chord length can be entered to draw a major arc (more than 180°). Both are drawn counterclockwise.
Start, End, Angle
With the Start, End, Angle method, after the start point and endpoint of the arc have been picked, a positive angle draws the arc counterclockwise; a negative angle keeps the same start and endpoints but draws the reverse arc or draws clockwise.
Start, End, Direction
In this method, Direction is the specified direction that the arc takes from the start point. The direction is specified in degrees. You can also specify the direction by pointing to a single point. Major, minor, counterclockwise, and clockwise arcs can be drawn with the Start, End, Direction method.
Start, End, Radius
In the Start, End, Radius method, Radius is the arc radius. When you use this method, enter a positive radius to draw a minor arc (less than 180°), and enter a negative radius to draw a major arc (more than 180°). Both are drawn counterclockwise.
Continue
If Continue is picked, a new arc starts tangent at the endpoint of the last arc or line drawn. You need to pick only the endpoint of the new arc to complete it. If an arc is already drawn, pressing the <Enter> key has the same effect.
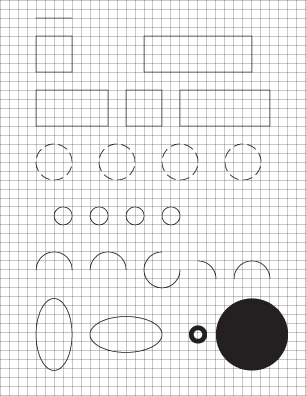
ELLIPSE
Look at Figure 2-45 to determine the approximate location of the ellipses drawn with the ELLIPSE command.
Axis, End
The minor axis of an ellipse is its smaller axis, and the major axis is the larger axis.
Step 54. Set Layer3 current.
Step 55. Draw an ellipse by entering points for the minor axis of the ellipse (Figure 2-46), as described next:
Prompt |
Response |
Type a command: |
Ellipse-Axis, End (or type EL <Enter>) |
Specify axis endpoint of ellipse or [Arc Center]: |
P1→ (Figure 2-46) |
Specify other endpoint of axis: |
P2→—With ORTHO on, move your mouse to the right; type 1 <Enter> |
Specify distance to other axis or [Rotation]: |
P3→—With ORTHO on, move your mouse up; type 1 <Enter> |
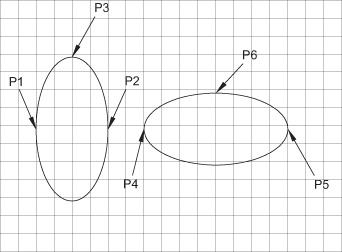
Step 56. Draw an ellipse by entering points for the major axis of the ellipse (Figure 2-46), as described next:
Prompt |
Response |
Type a command: |
Ellipse-Axis, End |
Specify axis endpoint of ellipse or [Arc Center]: |
P4→ (Figure 2-46) |
Specify other endpoint of axis: |
P5→—With ORTHO on, move your mouse to the right; type 2 <Enter> |
Specify distance to other axis or [Rotation]: |
P6→—With ORTHO on, move your mouse up; type 1/2 <Enter> |
Center
You may also draw an ellipse by specifying the center point, the endpoint of one axis, and the length of the other axis. Type C and press <Enter> at the prompt Specify axis endpoint of ellipse or [Arc Center]: to start with the center of the ellipse. Entering the center point first is similar to the first two methods described, and either the minor or major axis may be constructed first. As with all methods of drawing an ellipse, you can specify the points by clicking a point on the drawing, by typing and entering coordinates, or by direct distance entry.
DONUT
Look at Figure 2-45 to determine the approximate location of the solid ring and solid circle drawn using the DONUT command.
Step 57. Set Layer1 current.
Step 58. Use the DONUT command to draw a solid ring (Figure 2-47), as described next:
Prompt |
Response |
Type a command: |
DONUT (or type DO <Enter>) |
Specify inside diameter of donut <default>: |
Type 1/2 <Enter> |
Specify outside diameter of donut <default>: |
Type 1 <Enter> |
Specify center of donut or <exit>: |
Click a point on the drawing |
Specify center of donut or <exit>: |
<Enter> |
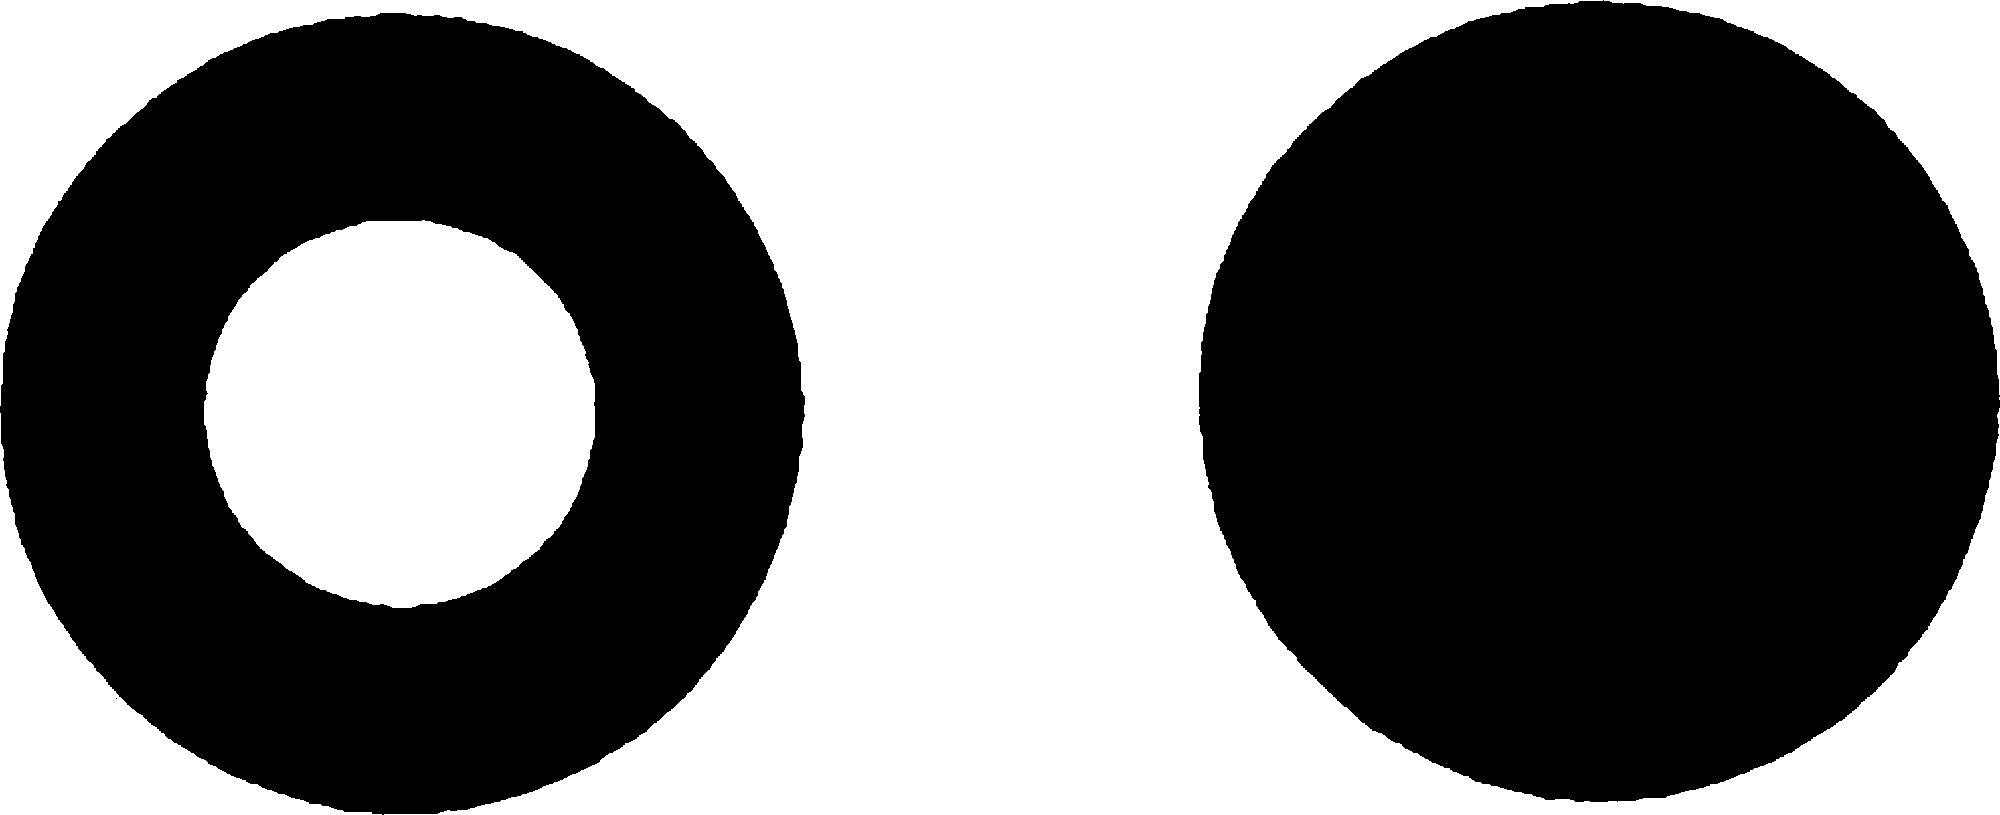
Step 59. Use the DONUT command to draw a solid circle (Figure 2-47), as described next:
Response |
|
Type a command: |
<Enter> (repeat DONUT) |
Specify inside diameter of donut <0′-0 1/2″>: |
Type 0 <Enter> (so there is no center hole) |
Specify outside diameter of donut <0′-1″>: |
<Enter> |
Specify center of donut or <exit>: |
Click a point on the drawing |
Specify center of donut or <exit>: |
<Enter> |
The DONUT command can be used to draw solid dots of any size as well as solid rings with different inside and outside diameters.
SCALE
The SCALE command lets you reduce or enlarge either drawing entities or an entire drawing. The Copy option of the SCALE command allows you to copy and enlarge or reduce the object at the same time.
<Scale factor>
Step 60. Use the SCALE command to reduce the solid ring (Figure 2-48), as described next:
Prompt |
Response |
Type a command: |
SCALE (or type SC <Enter>) |
Select objects: |
Window the ring (or click the outside edge of the ring) |
Select objects: |
<Enter> |
Specify base point: |
Click the center of the ring |
Specify scale factor or [Copy Reference]: |
Type .5 <Enter> |
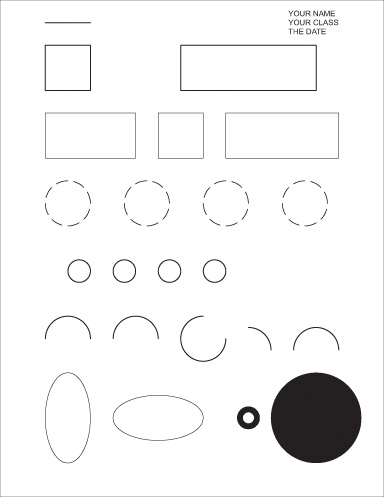
Figure 2-48 Tutorial 2-1, Part 2, complete
The relative scale factor of .5 was used to reduce the solid ring. A relative scale factor of 2 would have enlarged the solid ring.
Reference
Step 61. Use the SCALE command to enlarge the solid donut (Figure 2-48), as described next:
Prompt |
Response |
Type a command: |
<Enter> (repeat SCALE) |
Select objects: |
Window the solid donut |
Select objects: |
<Enter> |
Specify base point: |
Click the center of the solid donut |
Specify scale factor or [Copy Reference] <default>: |
Type R <Enter> |
Specify reference length <0′-1″>: |
<Enter> (to accept 1 as the default) |
Specify new length or [Points] <0′-1″>: |
Type 2 <Enter> |
The Reference option allows you to type and enter a number for the reference (current) length of a drawing entity. You can also enter the reference (current) length by picking two points on the drawing to show AutoCAD the reference (current) length. You can type and enter the new length by using a number, or you can enter it by picking two points on the drawing to show the new length.
Adding Text
Step 62. Set Layer3 current.
Step 63. Add your name, class, and date to the upper right corner of your drawing as described next:
Prompt |
Response |
Type a command: |
Single Line Text (or type DT <Enter>) |
Specify start point of text or [Justify Style]: |
Click a point in the upper right corner to start typing your name as shown in Figure 2-48 |
Type 1/8 <Enter> |
|
Specify rotation angle of text <0>: |
<Enter> (to accept the 0 default rotation) |
The In-Place Text Editor appears: |
Type YOUR NAME <Enter> YOUR CLASS <Enter> THE DATE <Enter> |
The In-Place Text Editor: |
<Enter> (to close the In-Place Text Editor) |

Command Lines of Prompt History
AutoCAD provides a record of the command history for the current session. Gray highlighted lines of this command history are shown in the floating command line. You can change the number of Lines of Prompt History displayed by using the command line right-click menu in Figure 2-49.
Clicking <F2> will show you a full command history of the current session that you can scroll through.
Step 64. When you have completed Tutorial 2-1, Part 2 (Figure 2-48), save your drawing in at least two places.
Tutorial 2-2 Plot Responses for CH2-TUTORIAL1, Using the Model Tab
When you start a new drawing, AutoCAD provides a single Model tab and two Layout tabs at the bottom of the drawing window. Thus far you have been working on the Model tab in model space. Model space is the 2D (and also 3D) environment where you create your drawings. You can also plot (or print) from the Model tab. Tutorial 2-2 describes how to print from the Model tab.
The following is a hands-on, step-by-step tutorial to make a hard copy of CH2-TUTORIAL1.
Step 1. Open drawing CH2-TUTORIAL1 and complete a Zoom-All command so it is displayed on the screen.
Step 2. Make sure the Model tab is current.
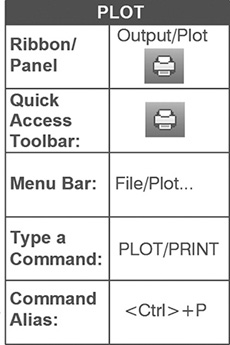
Step 3. Click the Plot command from the Quick Access toolbar or type PLOT <Enter> to access the Plot dialog box. Pressing <Ctrl> + P will also access the Plot dialog box.
Step 4. Click the More Options arrow in the lower right corner of the Plot dialog box to display the entire Plot dialog box (Figure 2-50).
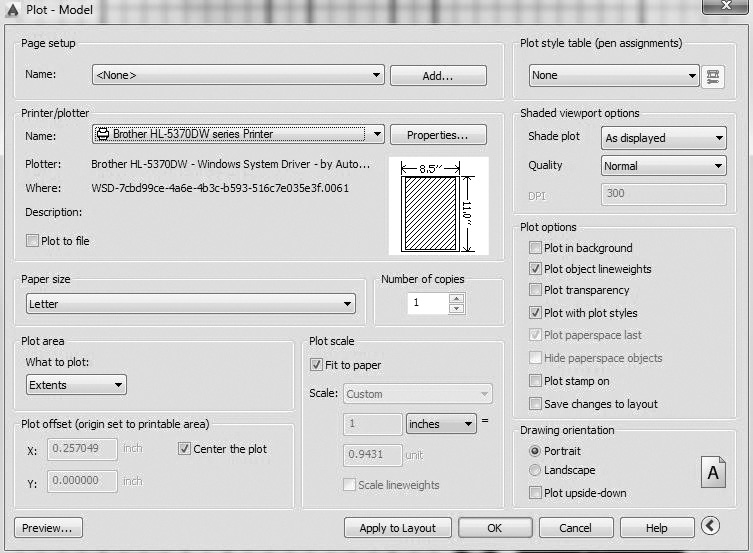
Plot - Name
The strip at the top of the dialog box displays the current layout tab name or shows whether the Model tab is current. It shows Model now because the Model tab is current.
Page Setup
Name: The settings that control the final plot output are referred to as page setups. This list box displays any named or saved page setups that you can select to apply to the current page setup.
Add...: When this button is clicked, the Add Page Setup dialog box is displayed. You can specify a name for the new page setup.
Step 5. Set the Page setup to None.
Printer/Plotter
The Name: line displays the current plot device (plotter or printer). When the down arrow is clicked, a list of the available plotting devices is displayed in the Name: list. You can select the plot device that you want to use.
Properties...: When this button is clicked, the Plotter Configuration Editor (Figure 2-51) is displayed. The Plotter Configuration Editor allows you to view or to modify current plot device information. If None is in the Name: line, Properties... is grayed out.
Custom Properties...: When this button of the Plotter Configuration Editor is clicked, a Properties dialog box for the configured plotter (or printer) appears. Each plotter (or printer) has a unique Properties dialog box; you can customize settings for the vector colors, print quality, and raster corrections for your plotter (or printer) using the Properties dialog box.
Step 6. Select the printer that you will use. If the Name: line does not show the correct plot device, click the down arrow and select the printer that you will use.
If you need to add a plot device, the Plotter Manager (under File in the menu bar) is used to add or modify plotter and printer configuration files.
Plot to File
If you do not check the Plot to file button, AutoCAD plots directly from your computer. If there is a cable leading from your computer to the printer or plotter, or if you are plotting from a network, do not check the Plot to file button.
If you do check the Plot to file button, a file is created with the extension .plt. You can save this plot file and transfer it to any computer connected to a plotter or printer.
Browse for Plot File...
When Plot to file is selected, and OK is clicked, the Browse for Plot File dialog box is displayed. This dialog box allows you to save the plot file.
Step 7. Select the correct setting for the Plot to file check box for your situation.
Plot Style Table (Pen Assignments)
Plot styles allow you to plot the same drawing in different ways. The plot style table (Figure 2-52) can be used to create, edit, or store plot style files.
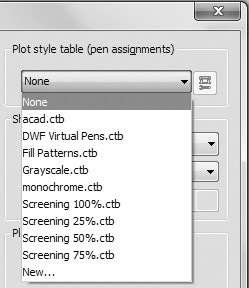
plot style table: A collection of plot styles. Plot styles are made using plot style tables. They apply to objects only when the plot style table is attached to a layout or viewport.
Step 8. Set the Plot style table to None.
Paper Size
The Paper size: line displays the current paper size. When the down arrow is clicked, it lists the paper sizes the printer (Figure 2-53) or plotter (Figure 2-54) can accommodate; the current size is highlighted. An A, B, D, or E displayed beside the size indicates a standard American National Standards Institute (ANSI) paper size. ARCH displayed beside the size indicates a standard architectural paper size.
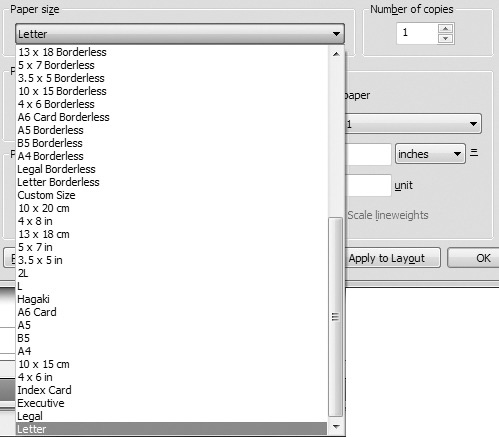
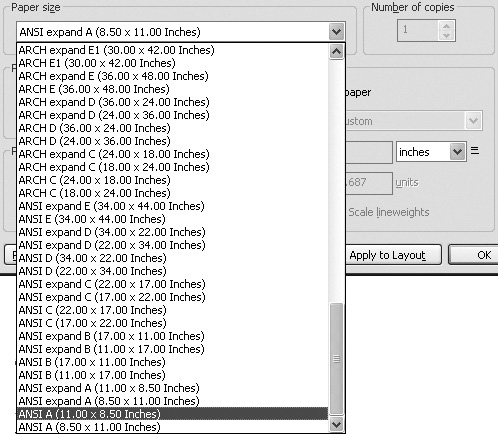
Step 9. Select the Letter (8.5 × 11 in.) paper size, and 1 for the Number of copies.
Plot Area
When you click the down arrow, the following options are displayed (View will not be displayed because you have not named and saved a view in your drawing):
Display: This option plots the part of the drawing that is displayed on the screen at the time the plot is made.
Extents: This option plots the drawing extents. The drawing extents are whatever graphics are actually drawn, including any graphics that lie outside the limits of the drawing area.
Limits: This option plots the part of the drawing that lies within the drawing limits. The limits for drawing CH2-TUTORIAL1 are 8-1/2,11.
Window: This selection allows you to pick two corners of a window and plot only the part of the drawing that is within the window. When the Window < button is clicked, it clears the Plot dialog box so you can view your drawing and use your mouse to click the two corners of a window. AutoCAD then returns to the Plot dialog box.
Step 10. Click Extents to select the drawing extents as part of the drawing that is to be printed.
Plot Scale
Scale: In model space, you draw full scale, so most drawings need to be plotted to scale. The Scale: line displays the scale at which the drawing will be plotted. If the scale list is gray, click the check mark in the Fit to paper check box so a scale may be selected. When the down arrow is clicked, a list of available scales is displayed. You can select the scale that you want to use. To be able to measure a plotted drawing accurately using a scale, you must enter a specific plotting scale.
Fit to paper: You may respond by selecting Fit to paper instead of entering a specific scale. When you select this option, AutoCAD scales the selected plot area as large as possible to fit the specified paper size.
Annotative Property and Annotation Scale
Objects such as text, dimensions, hatches, and leaders can be annotative. To make text annotative, you can turn the annotative property on in the Text Style dialog box. Also, before you add the text to your drawing, you must set the annotation scale, located in the lower right corner of the status bar.
When a drawing such as a large house or building is drawn full scale, the text that is added to the drawing also must be large. For instance, if you want the text of a drawing to be 1/8″ high when plotted at a scale of 1/4″ = 1′-0″, the text that you add while drawing full scale will need to be 6″ high, as shown in the 1/4″ = 1′-0″ scale in Figure 2-55.
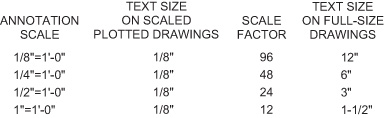
Annotation scale controls how the text and other annotative objects appear on the drawing. When you make the text annotative and set the annotation scale of the drawing, AutoCAD automatically does the arithmetic for you and controls how the text looks on your screen. When adding the text, you have to enter only the size of the text you want in the plotted drawing, and AutoCAD automatically calculates the size of the text on the drawing using the annotation scale setting.
If you have annotative objects on your drawing and have set the annotation scale, it is usually best to plot your drawing at the same scale as the annotation scale that you have set. If there are no annotative objects on your drawing, the annotation scale does not affect anything. If the plot scale and the annotation scale differ, when the plot is initiated, AutoCAD prompts you with The annotation scale is not equal to the plot scale. Do you wish to Continue? You can answer with OK or Cancel.
Step 11. Select a scale of 1:1, which is 1 plotted inch = 1 drawing unit.
Plot Offset (Origin Set to Printable Area)
Center the plot: To center the drawing on the paper, place a check in the Center the plot check box, and the plot will be automatically centered on the paper.
X and Y offset: The plot offset specifies the location of the plot, on the paper, from the lower left corner of the paper. The X: input line moves the plotted drawing in the X direction on the paper, and the Y: input moves the drawing in the Y direction. You can enter either positive or negative values.
Step 12. Place a check in the Center the plot check box.
Notice that the X and Y inputs are automatically calculated to center the selected plotting area (extents) in the paper size (8-1/2″ × 11″).
Shaded Viewport Options
These options relate to 3D drawings and control how shaded and rendered viewports are plotted. This is described in Chapters 14 and 15.
Plot Options
Plot in background: A check mark in this box allows you to continue working while your drawing is being plotted.
Plot object lineweights: A check mark in this box tells AutoCAD to plot the drawing using the lineweights you have assigned to any object in the drawing.
Plot transparency: You can enter a transparency value in the Layer dialog box. It is a setting that makes an object more or less transparent. If you have transparent objects in your drawing, this option determines whether the transparency is plotted.
Plot with plot styles: This option allows you to use a plot style. Because you are not using a plot style, this box will not be checked.
Plot paperspace last: When this option is checked, model space will be plotted first. Usually, paper space drawings are plotted before model space drawings.
Hide paperspace objects: The Hide paperspace objects check box refers to 3D objects only. When you use the Hide command, AutoCAD hides any surface on the screen that is behind another surface in 3D space. If you want to do the same on your paper space plot, you must click the Hide paperspace objects check box so that a check appears in the box. This shows only in the full plot preview window.
Another way to hide in paper space is to select the viewport in which you want to have hidden lines, click Properties under Modify in the menu bar, and turn Shade plot to Hidden.
Plot stamp on: A check mark here allows you to place signatures and other stamps on the drawing.
Save changes to layout: Checking this box allows you to save any changes you have made in the Plot dialog box.
Step 13. If there is a check in the Plot with plot styles box, remove the check. Put a check in the Plot object lineweights box. (Plot paperspace last and Hide paperspace objects are grayed out because no Layout tabs were used.)
Drawing Orientation
The paper icon represents the orientation of the selected paper size. The letter A icon represents the orientation of the drawing on the paper.
Portrait: This button allows you to specify a vertical orientation of the drawing on the page.
Landscape: This button allows you to specify a horizontal orientation of the drawing on the page. If a plot shows only half of what should have been plotted, the orientation may need to be changed.
Plot upside-down: This check box allows you to plot the drawing, in a portrait or landscape orientation, upside-down.
Step 14. Select the Portrait orientation.
Preview...
The Preview... button shows you exactly how the final plot will appear on the sheet.
Step 15. Click the Preview... button.
Preview your plot for CH2-TUTORIAL1, Part 2, Figure 2-56. If there is something wrong with the plot, press the space bar and make the necessary adjustments. If the preview looks OK, press the space bar to end the preview. You may also click the right mouse button to access the menu shown in Figure 2-57.
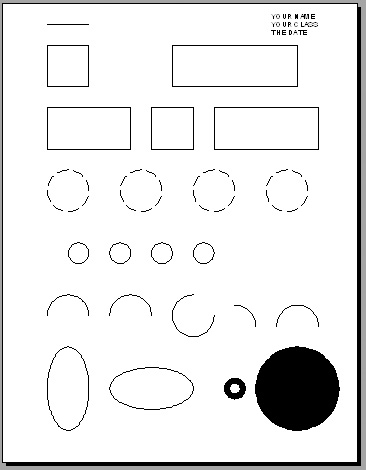
Step 16. Click OK from the Plot dialog box (or click Plot from the right-click menu).
The plot proceeds from this point. If you have not created a plot file, remove the completed plot from the printer or plotter. If you have created a .plt file, take your disk to the plot station or send your plot via a network.
Chapter Summary
This chapter provided you the information necessary to set up and begin a new AutoCAD drawing. In addition you learned to make layers and assign color, linetype, and lineweight to each layer. You also learned how to use the Save and Save as commands, use basic drawing and editing commands, and print or plot your drawing. Now you have the skills and information necessary to set up and make basic drawings, save your drawings, and print or plot your drawings.
Chapter Test Questions
Multiple Choice
Circle the correct answer.
1. The function key <F7> described in this chapter does which of the following?
a. Flips the screen from the text display
b. Turns snap on or off
c. Turns ORTHO on or off
d. Turns grid on or off
2. Which of the following function keys is used to turn snap on or off?
a. <F2>
b. <F7>
c. <F8>
d. <F9>
3. How many layers may be used in a drawing?
a. 1
b. 16
c. 32
d. An unlimited number
4. AutoCAD provides how many sizes of each standard linetype (except continuous)?
a. 1
b. 2
c. 3
d. As many as you want
5. When the MOVE command is used with a window selection (click left, drag right — not a crossing window):
a. Everything the window touches is selected
b. Everything entirely within the window is selected
c. The last item clicked is selected
d. Nothing is selected
6. When the MOVE command is used with a crossing window selection (click right, drag left):
a. Everything the window contains or touches is selected
b. Everything entirely within the window is selected
c. The last item clicked is selected
d. Nothing is selected
7. Which of the following are small squares that appear on an object when it is selected with no command active?
a. Grips
b. Snaps
c. Squares
d. Rectangles
8. When you plot from the Model tab, which of the following will produce a plot of the part of the drawing that is displayed on the screen?
a. Display
b. Extents
c. Window
d. Limits
9. When you plot from the Model tab, which of the following will produce a plot of the entire drawing, even if part of it is outside the limits?
a. Display
b. Extents
c. Window
d. Limits
10. A drawing that is to be plotted using the Model tab so that it fits on a particular size sheet without regard to the scale requires which scale response?
a. 1:1
b. Full
c. 1:2
d. Fit to paper
Matching
Write the number of the correct answer on the line.
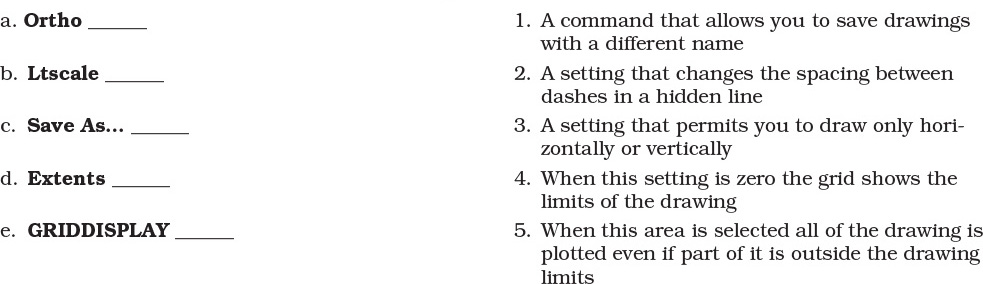
True or False
Circle the correct answer.
1. True or False: The default lower left corner of the drawing limits is 8-1/2,11.
2. True or False: To make the line segment length and spacing larger for a dashed linetype, enter a number larger than 1 at the Ltscale prompt Enter new linetype scale factor <1.000>.
3. True or False: Direct distance entry can be used only when drawing a line.
4. True or False: The 3-point method of drawing arcs allows you to draw arcs clockwise or counterclockwise.
5. True or False: Pressing the <Esc> key cancels a command.
2. Five Visual Styles accessible from the View (pull-down) menu.
3. Five ways to access the Plot command.
4. Five color index numbers and their corresponding colors.
5. Five ways of drawing an arc.
6. Five options of the ZOOM command.
7. Five ways of accessing the ELLIPSE command.
8. Five commands and their respective aliases.
9. Five ways of accessing the Layer Properties Manager palette.
10. Five ways of accessing the single-line text command in AutoCAD.
General Questions
1. In what situations would you use the Ortho setting?
2. Why would you want to use the Ltscale setting?
3. How can the annotation scale be used to make it easier to draw and plot drawings?
4. Which settings on the status bar do you want to use in your workspace?
5. What are all the selection set options, and how can you use them effectively?
Chapter Projects
Project 2-1: Drawing Shapes I [BASIC]
Draw, full size, the shapes shown in Figure 2-58. Use the dimensions shown. Locate the shapes approximately as shown. Use your workspace to make the following settings:
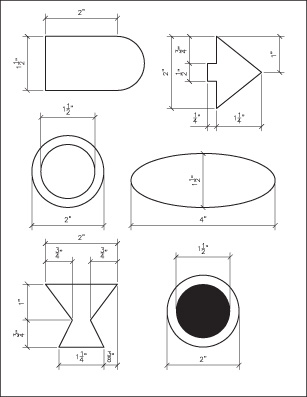
Figure 2-58 Project 2-1: Drawing Shapes I
1. Use Save As... to save the drawing with the name CH2-P1.
2. Set drawing units: Architectural
3. Set drawing limits: 8-1/2,11
4. Set GRIDDISPLAY: 0
5. Set grid: 1/4″
7. Create the following layers:
Project 2-2: Drawing a Pattern [BASIC]
Draw the pattern shown in Figure 2-59. Use an architectural scale to measure the pattern and draw it full scale. Use your workspace to make the following settings:
1. Use Save As... to save the drawing with the name CH2-P2.
2. Set drawing units: Architectural
3. Set drawing limits: 8-1/2,11
4. Set GRIDDISPLAY: 0
5. Set grid: 1/4″
6. Set snap: 1/8″
7. Create the layers on your own.
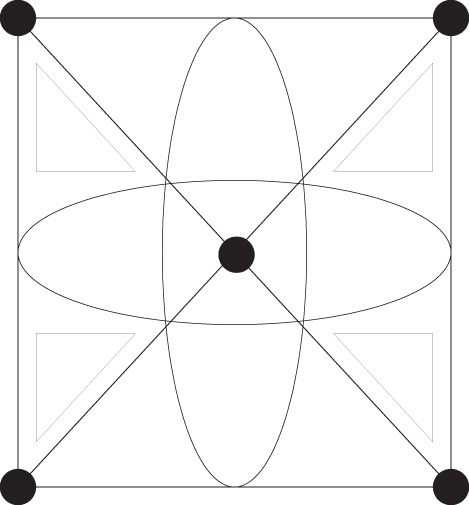
Figure 2-59 Project 2-2: Drawing a pattern (scale: 1″ = 1″)
Project 2-3: Drawing Shapes II [INTERMEDIATE]
Draw the shapes shown in Figure 2-60. Use an architectural scale to measure the shapes and draw them full scale. Your drawing will be the size shown in the figure. Use your workspace to make the following settings:
1. Use Save As... to save the drawing with the name CH2-P3.
2. Set drawing units: Architectural
3. Set drawing limits: 8-1/2,11
4. Set GRIDDISPLAY: 0
5. Set grid: 1/4″
6. Set snap: 1/8″
7. Create the layers on your own.
Figure 2-60 Project 2-3: Drawing Shapes II (scale: 1″ = 1″)
Project 2-4: Drawing a Door [INTERMEDIATE]
Draw the door shape shown in Figure 2-61. Use an architectural scale to measure the figure and draw it full scale. Use your workspace to make the following settings:
1. Use Save As... to save the drawing with the name CH2-P4.
2. Set drawing units: Architectural
3. Set drawing limits: 8-1/2,11
4. Set GRIDDISPLAY: 0
5. Set grid: 1/4″
6. Set snap: 1/8″
7. Create the layers on your own.
Figure 2-61 Project 2-4: Drawing a door (scale: 1″ = 1″)
Project 2-5: Drawing Shapes III [ADVANCED]
Draw the shape shown in Figure 2-62. Use an architectural scale to measure the figure and draw it full scale. Use your workspace to make the following settings:
1. Use Save As... to save the drawing with the name CH2-P5.
2. Set drawing units: Architectural
3. Set drawing limits: 8-1/2,11
4. Set GRIDDISPLAY: 0
5. Set grid: 1/4″
6. Set snap: 1/16″
7. Create the layers on your own.
Figure 2-62 Project 2-5: Drawing Shapes III (scale: 1″ = 1)