

Billing page
Test plan: This is a group of test suites and test cases to be executed in an iteration or in an area.
Test suite: This is a group of test cases to validate a scenario or use case. It can be a static test suite, a requirement-based test suite, or a query-based test suite; we will discuss more about test suites in the “Test Suites” section of this chapter.
Test cases: These validate a single functionality of the application. Test cases can be added to test suites or test plans and can be mapped to multiple suites or plans at a time.
Test Cases
Unit test case: This will be used by developers to verify the completeness of their implementation. There are many tools and technologies available associated with each of the implementation technologies to automate the unit test cases. There are many unit test frameworks and libraries such as Junit for Java-based applications, NUnit for .NET, Jasmine and Karma for Angular, and Mocha and Chai for React.
Functional test case: This is a test case used to validate the functional implementation of the system.
Security test case: This verifies the security constraints with the system. For example, security test cases may verify any cross-site scripting issues with a web application.
Performance test case: This verifies the performance of the system with different parameters such as data volume, user load, stress testing, and so on.
User acceptance test: This is acceptance testing by the business stakeholders.
There are many test cases such as regression testing, integration testing, smoke testing, sanity testing, system testing, BVT test cases, and so on. As a good practice, test cases will be reviewed by test leads or the functional SME to align the test cases with the expected functionalities. Most of the NFR-related test cases will be reviewed by the architect.
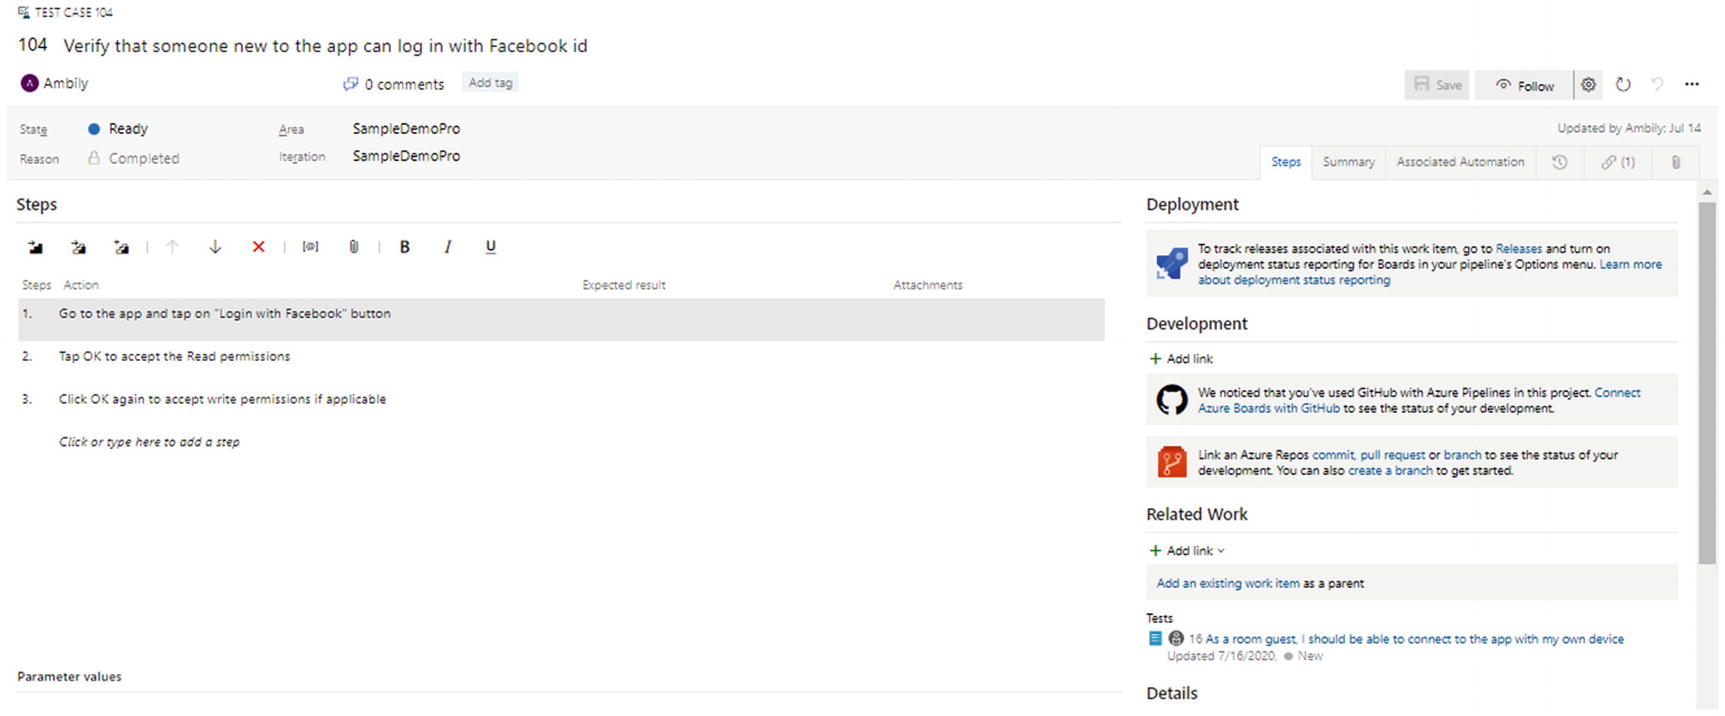
Test case template
The main fields are the steps defining the the actions and expected result, and the parameters. A step defines an action by the user to validate a user interaction in the system. For example, a user can provide credentials in a login form and click the Login button to login to the system. When the user performs an action such as the login, user input is required. When a tester executes such steps, they should pass various values to identify whether the system is working properly and responding to different user input values. These values define the positive cases, negative cases and boundary conditions. If a test step requires a user value that can vary and return different results, then such fields are marked as parameters.
Shared steps are another important concept; these are where a set of steps will be shared across multiple test cases. For example, the login test steps will repeat across most of the test cases that require the user authentication. The user can define such steps along with actions, results, and parameters as a shared step and reuse it in other test cases to avoid duplication of the same content. Follow the Don’t Repeat Yourself (DRY) principle to avoid duplicating the same steps in another test cases.
Shared Steps and Parameters
As mentioned earlier, a shared step is a set of test case steps that can be reused in multiple test cases. For example, the steps for logging in to the system can be defined as a shared step and included in many other test cases.

Shared steps

Shared steps inserted

“Shared step” work item
Users can further customize the steps by adding parameters, which expect data from users at the time of execution. For the previous scenario, add the parameters username and password and bind to the steps.

Parameter values
If the parameters are used across multiple test cases, they can be added as a shared parameter set. Just like shared steps, a shared parameter set will be available for all test cases to reuse the same set of data across multiple test scenarios.
In Figure 5-6, select the parameters and click the “Convert to shared parameters” link to convert it to a shared parameter set. The “Parameters” section will cover more about the parameters.
Test Suites
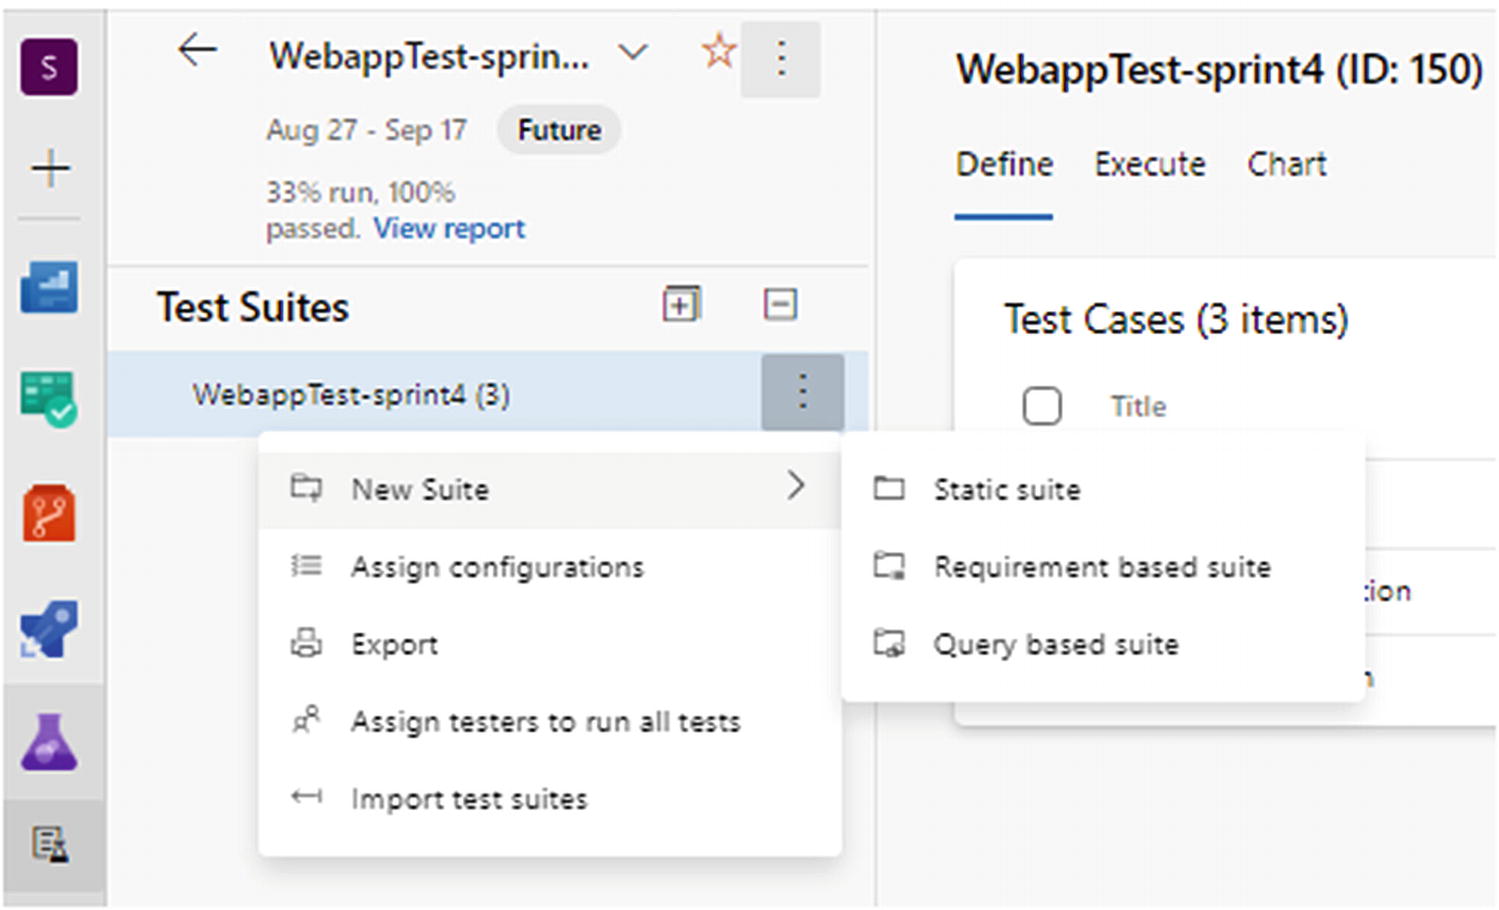
Test suites
Static suite: Add the test cases manually to the suite.
Requirement based suite: Select the test cases based on the requirements.
Query based suite: Select the test cases using a query.
Test Plans
A test plan defines the test suites and test cases corresponding to an area or iteration. It is used for grouping the test cases based on the features prioritized in an iteration or related to a specific area.

Test Plans section
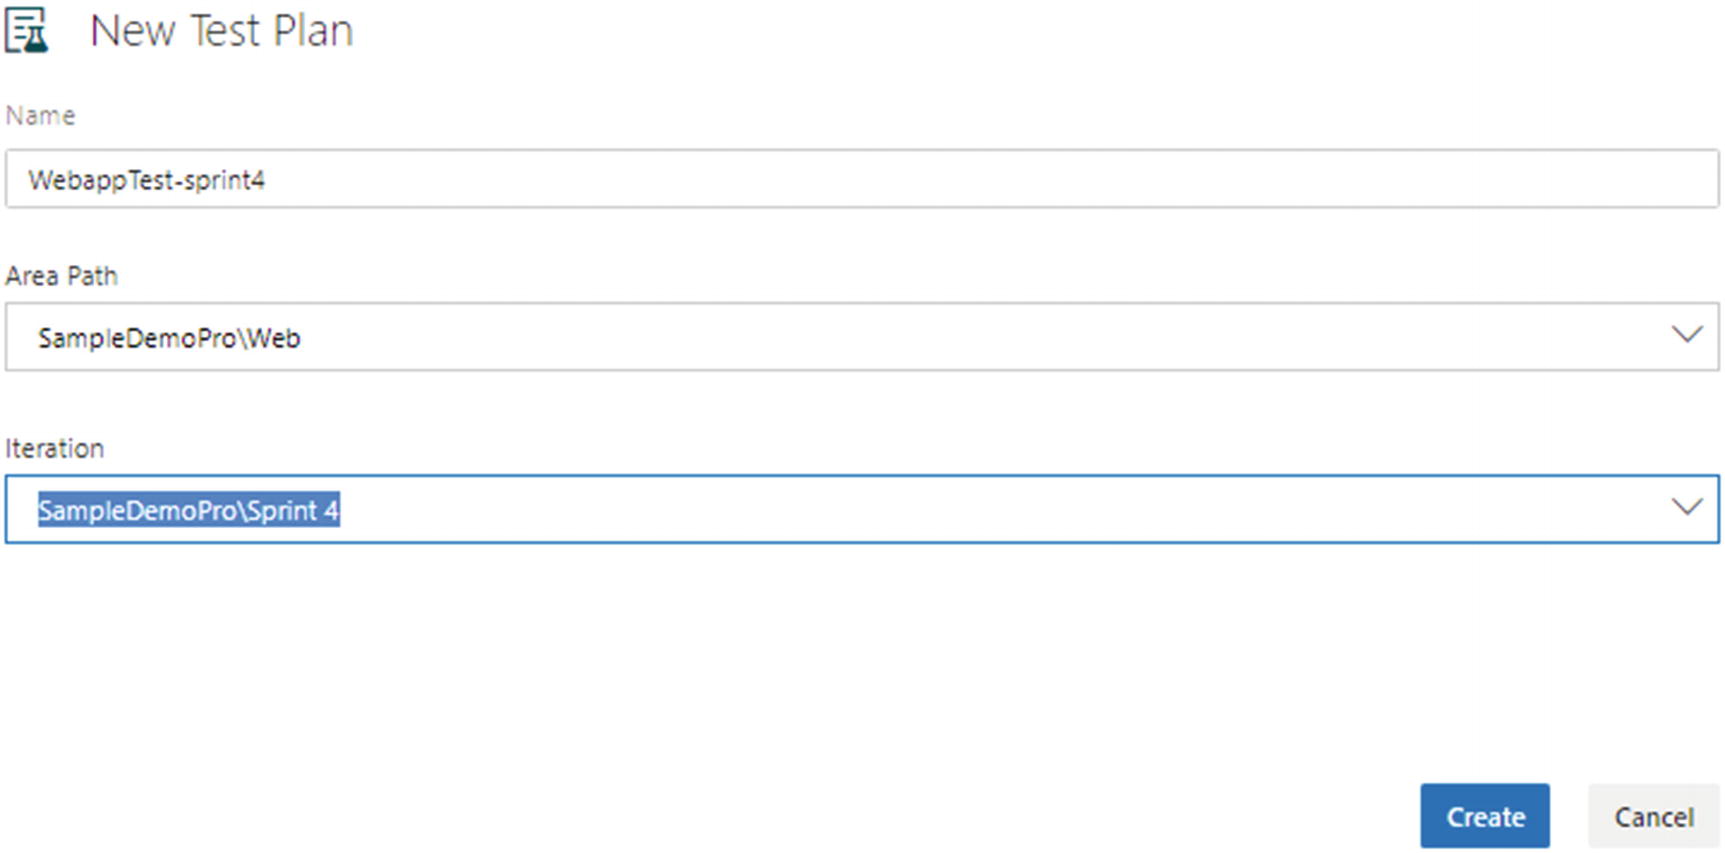
Creating a new test plan
Add existing test cases: This adds an existing test case. This option opens a query window to select the test cases based on a query, as shown in Figure 5-10. The user can edit the query to filter the test cases and select the specific test cases from the result set.
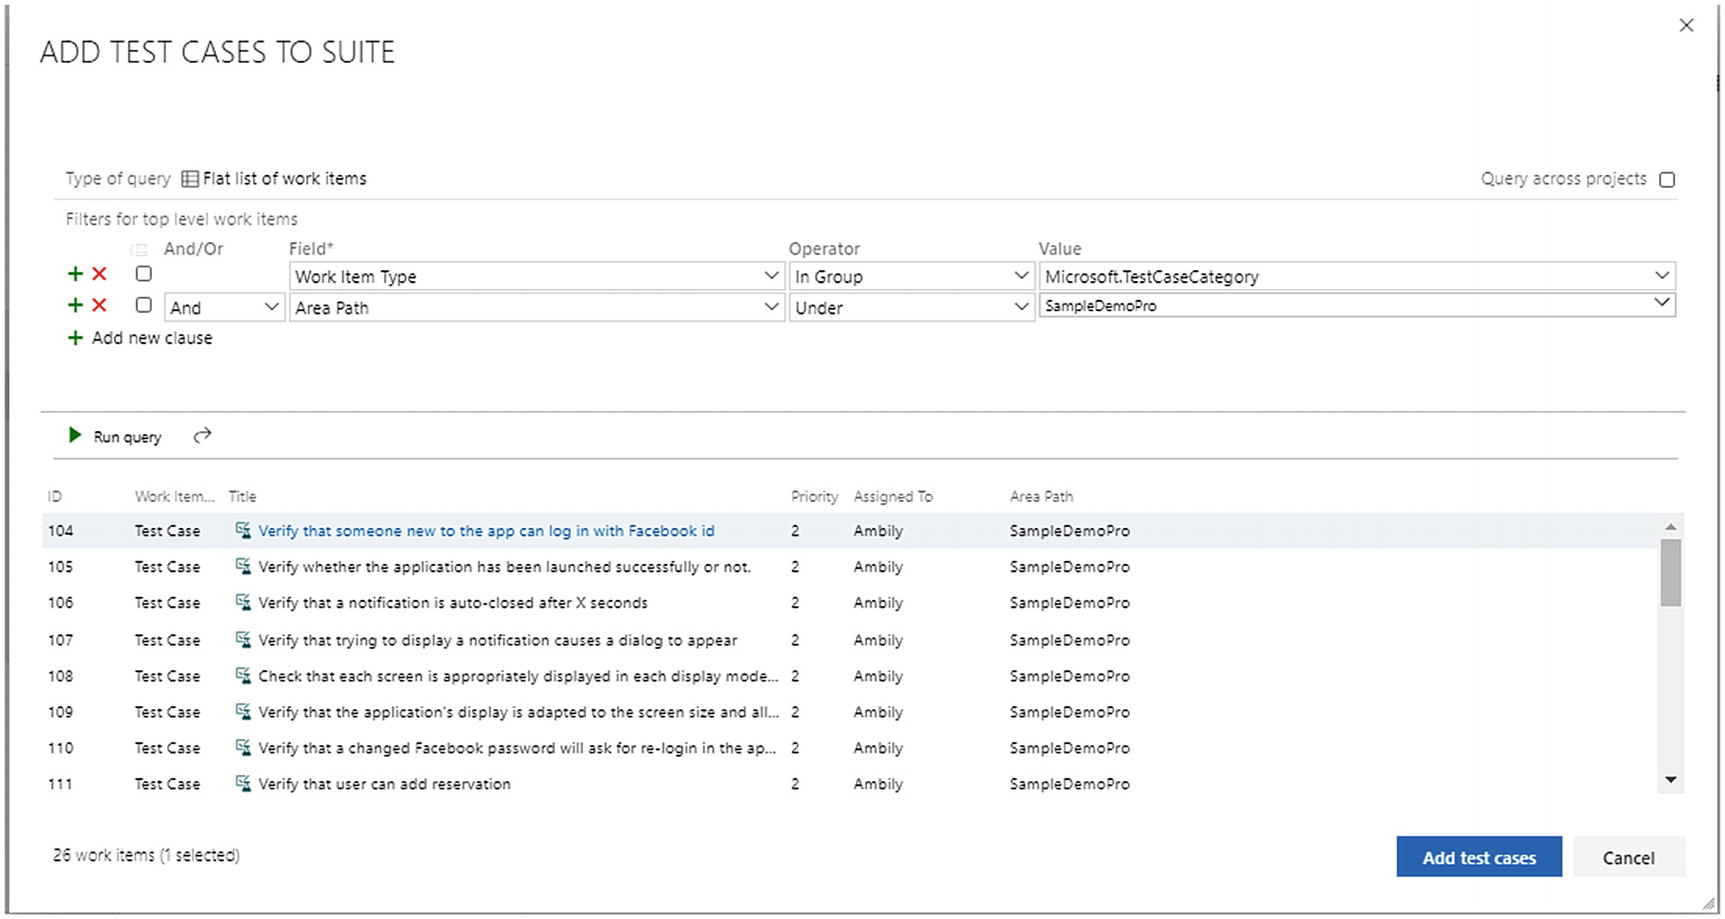
Adding the test cases to suite
Add test cases using grid: This option supports the entry of multiple test cases using an Excel or table format. The user can create test cases in Excel or CSV format, and then testcases can be copied directly to the grid view to insert the test cases. This feature helps the testers to work offline.
Enter the test case title in the first column and define the steps associated with the test case in the second column. Each step should be specified in different rows along with the expected result, as shown in Figure 5-11.
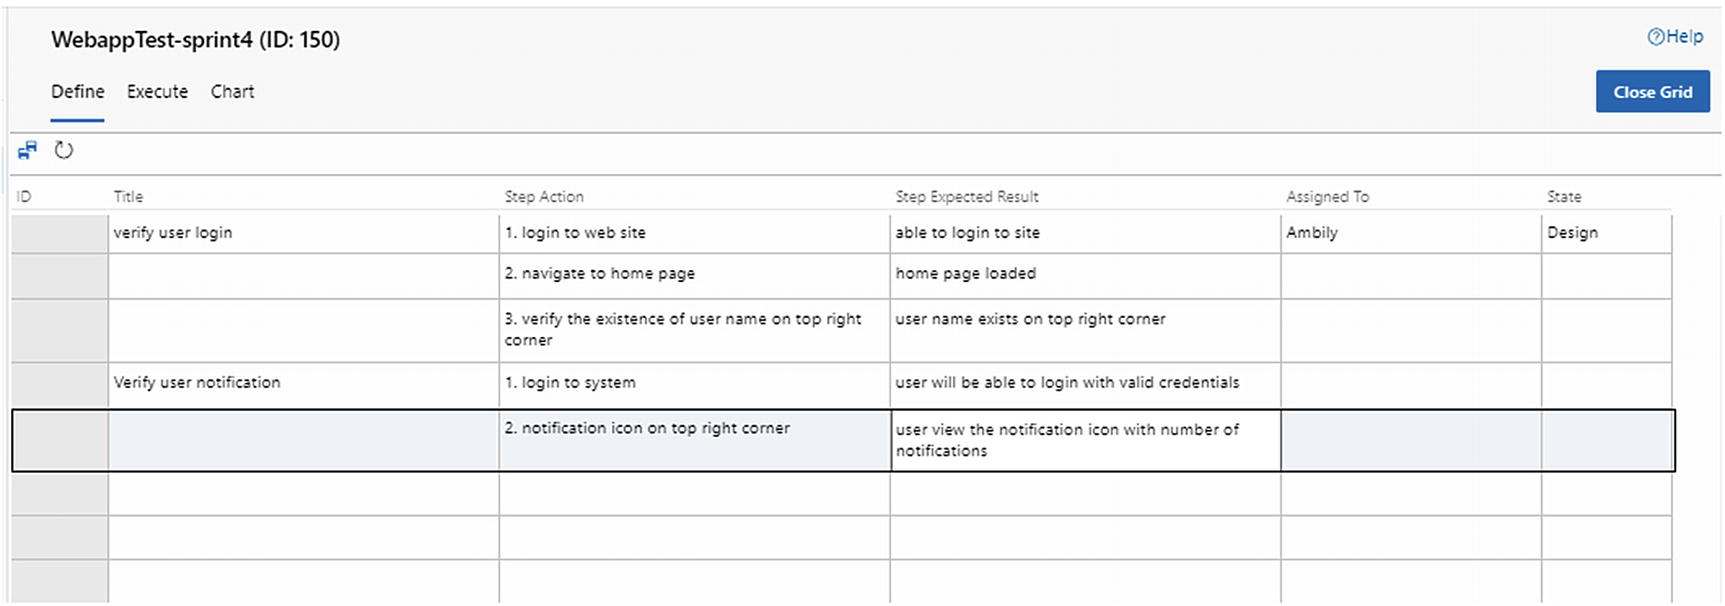
Adding test cases using a grid
The Assigned To and State columns can be filled based on the requirements or left empty. The default option is for the system to add the state Design to every new test case. Once the test cases are added, click the Save icon (![]() ) on top of the grid to save the test cases.
) on top of the grid to save the test cases.

Test cases, grid view
Define Tab

Define tab
View Linked Items: This option shows the linked test suites, requirements, and bugs. If the system establishes proper traceability, the user can identify the requirements and bugs associated with the current test case, as shown in Figure 5-14.

Linked items
Open test case: This option opens the test case.
Assign configuration: This specifies the system configurations required to execute the test cases; refer to the “Configurations” section for more details, as shown in Figure 5-15.

Assigning configurations
Remove: This option removes the selected test case.
Edit test cases(s) in grid: This allows you to edit multiple test cases in a grid.
Edit test case(s): This allows you to edit the test case or test cases by selecting specific fields, as shown in Figure 5-16.
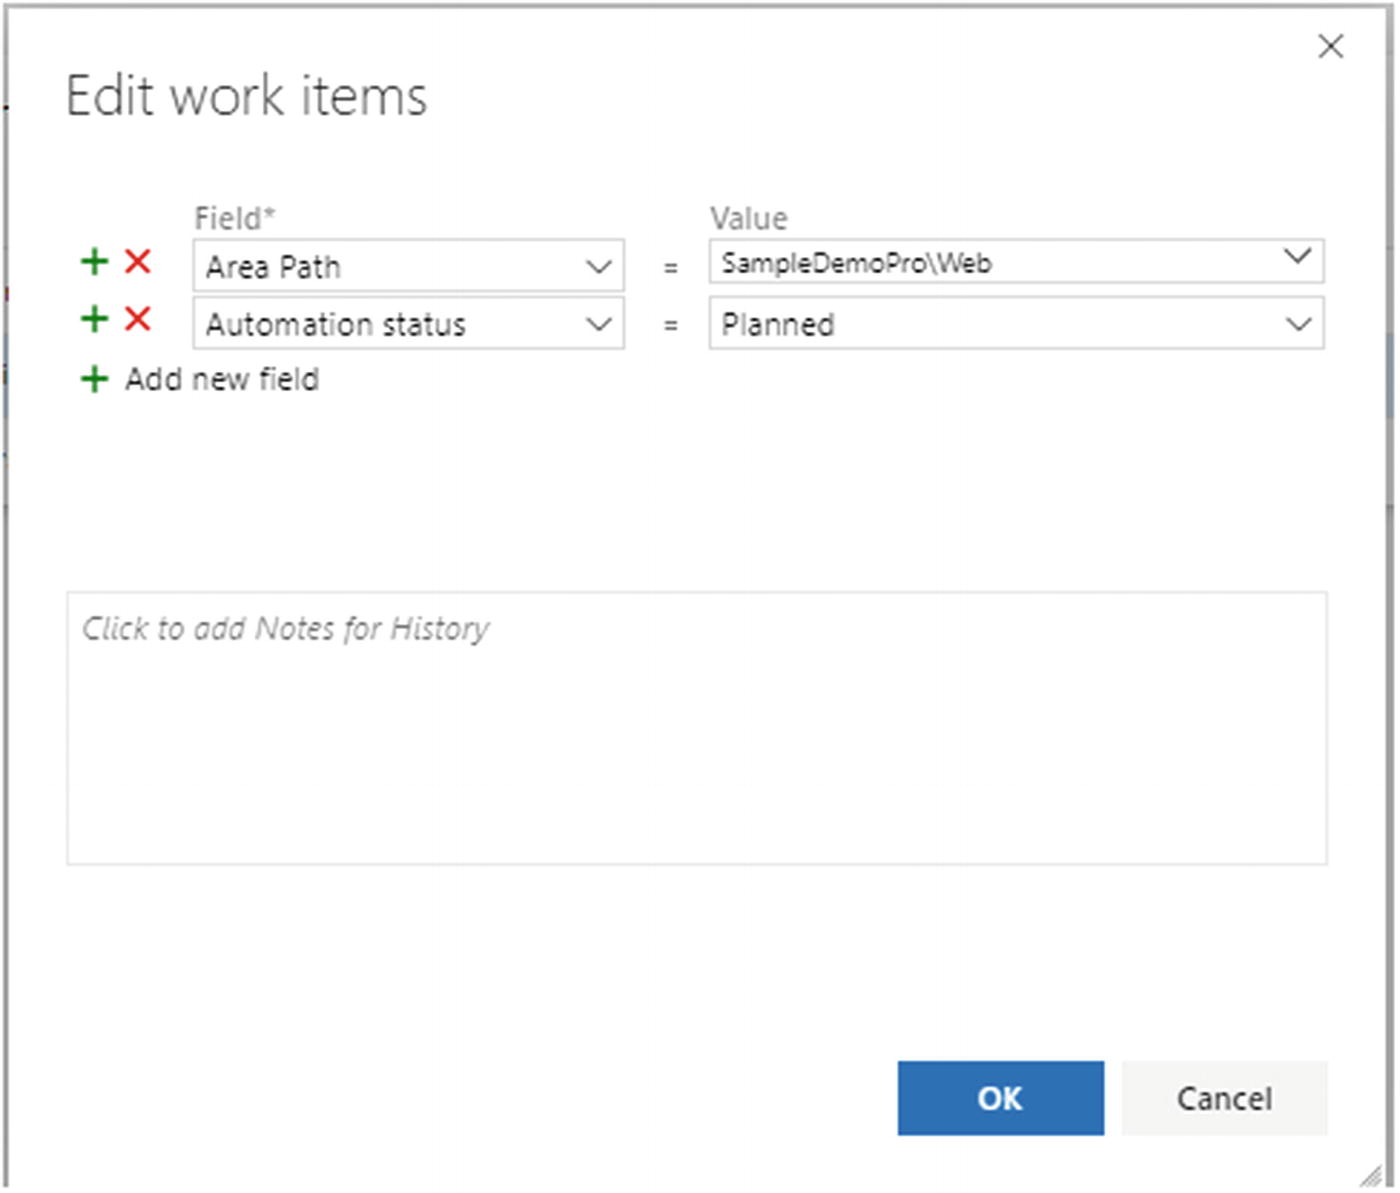
“Edit work items” screen
Copy test case(s): This copies the test case.
Export test case(s) to csv: This allows you to export the selected test cases to CSV.
Execute Tab

Executing a test plan
You’ll see a list of run options available to execute the selected test cases. The run options available are as follows: Run for web application, Run for desktop application, and Run with options.

Filtering option
Run for Web Application

Runner window, test plans

Runner window, edit step
The user will get further options to add new test steps, delete the existing step, and move down and up the selected step in the test case. Pass and Fail mark the test step status as part of this execution.
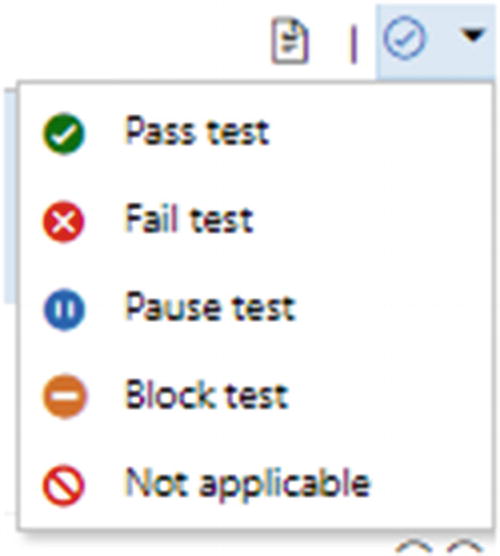
Runner window, mark status
Save: Save the changes.
Save and Close: Save and close the Runner window.
Create new Bug/Add to existing bug: From the Runner window, the user can create a bug related to the current test case execution.
Capture screenshot: Capture the current screen to provide more details for bug fixing or feedback.
Capture user actions as image action log: Capture all the user actions as image logs, which will help the team to reproduce the execution or defects.
Record screen: Add a video recording of the execution of the test case, which will help provide further details about the user actions.
Add Comment: Add comments as part of the test case execution.
Add attachment: Add additional information as an attachment such as the log files.
Record screen with audio: Add a screen recording with audio, where the user can explain the observations clearly.
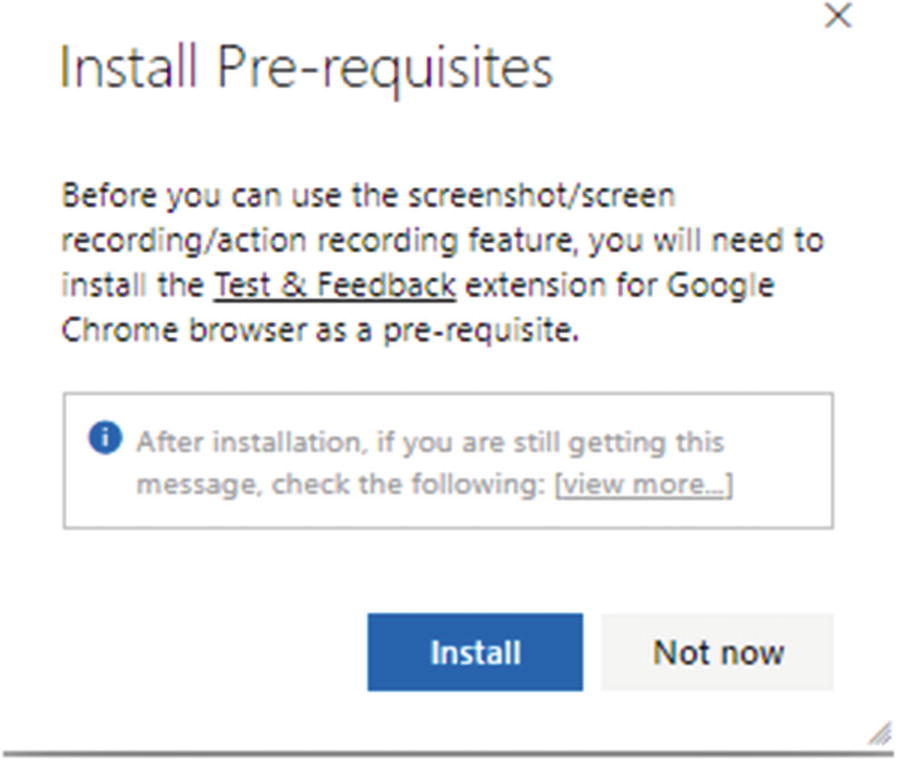
Installing the Test & Feedback extension
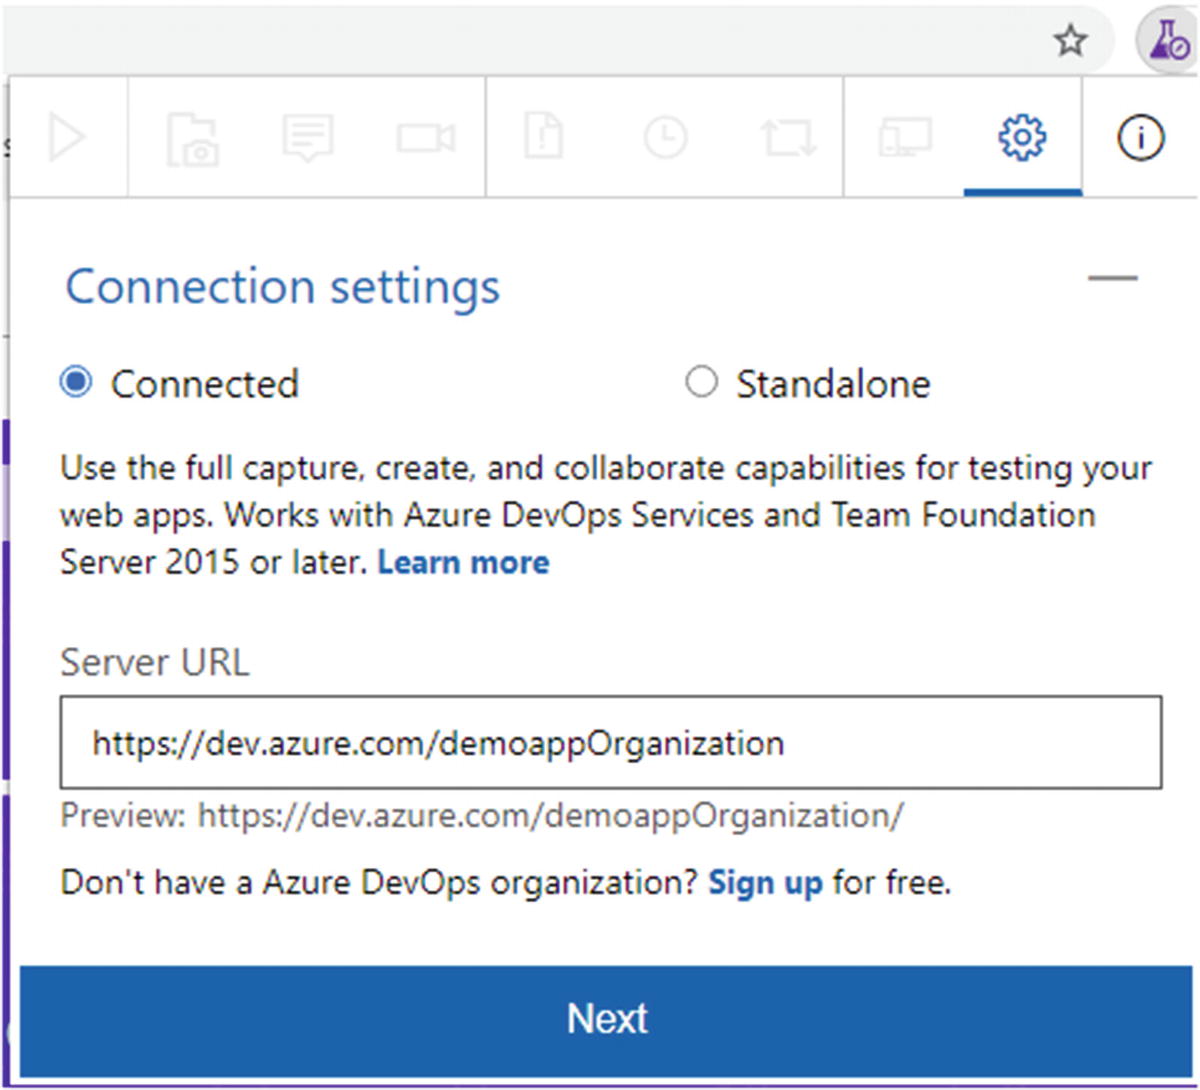
Test & Feedback extension
Once integrated with Azure DevOps, relaunch the Runner window to execute the test case with an image or screen recording.
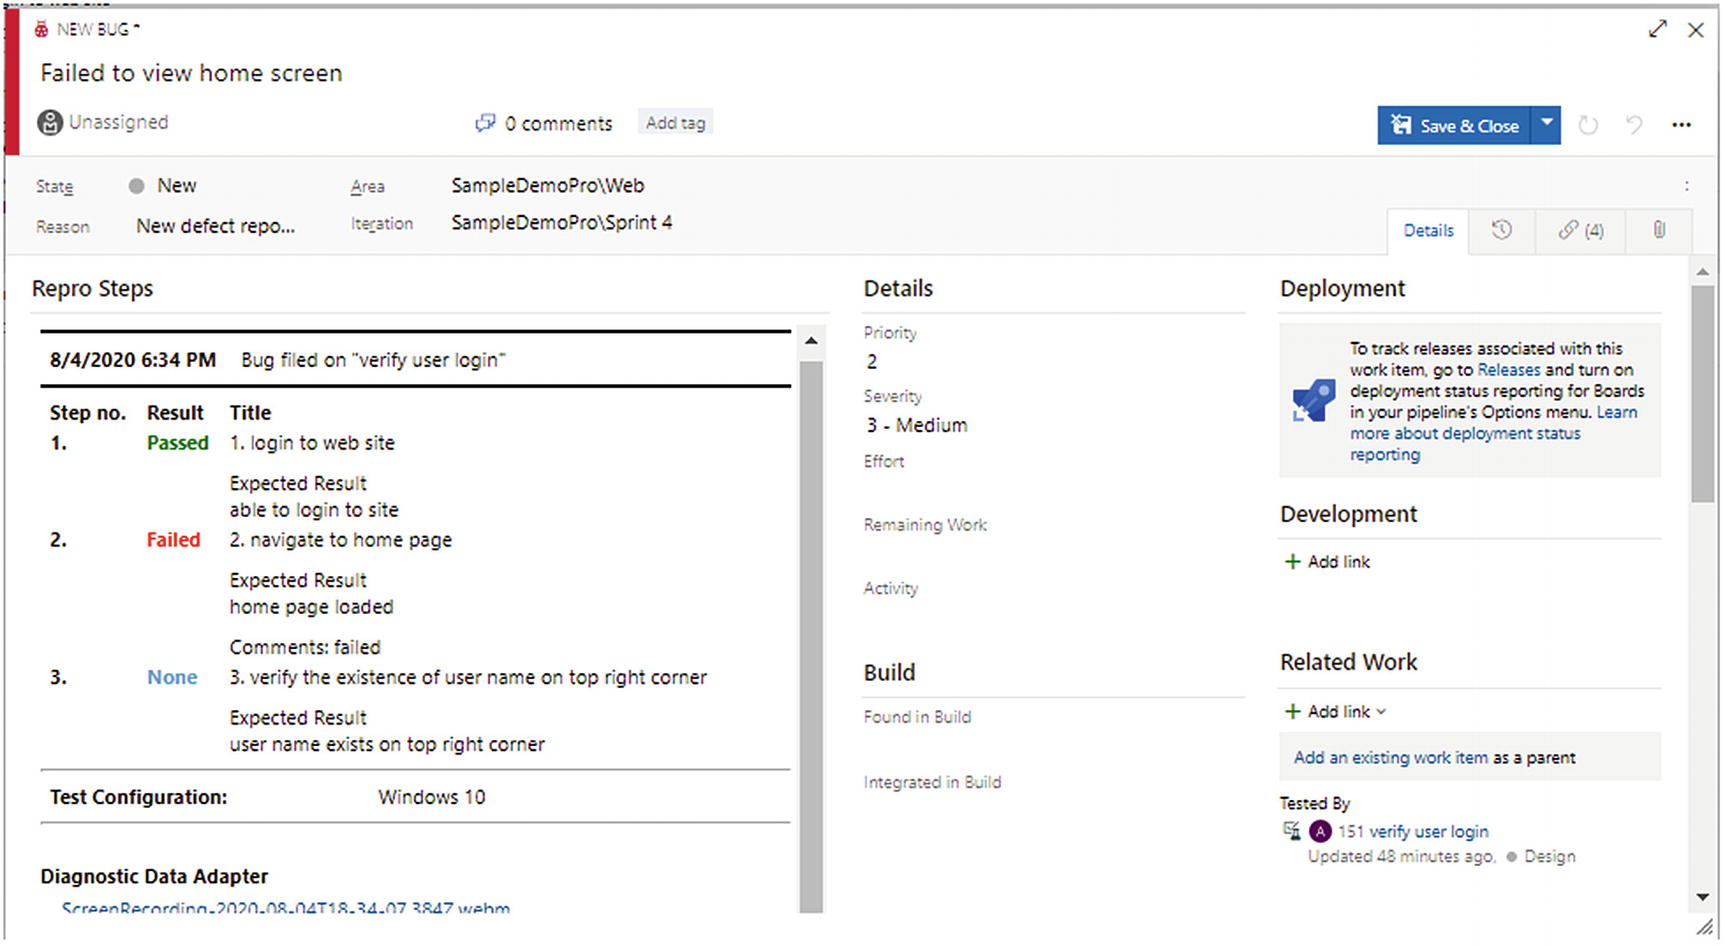
Runner window, new bug
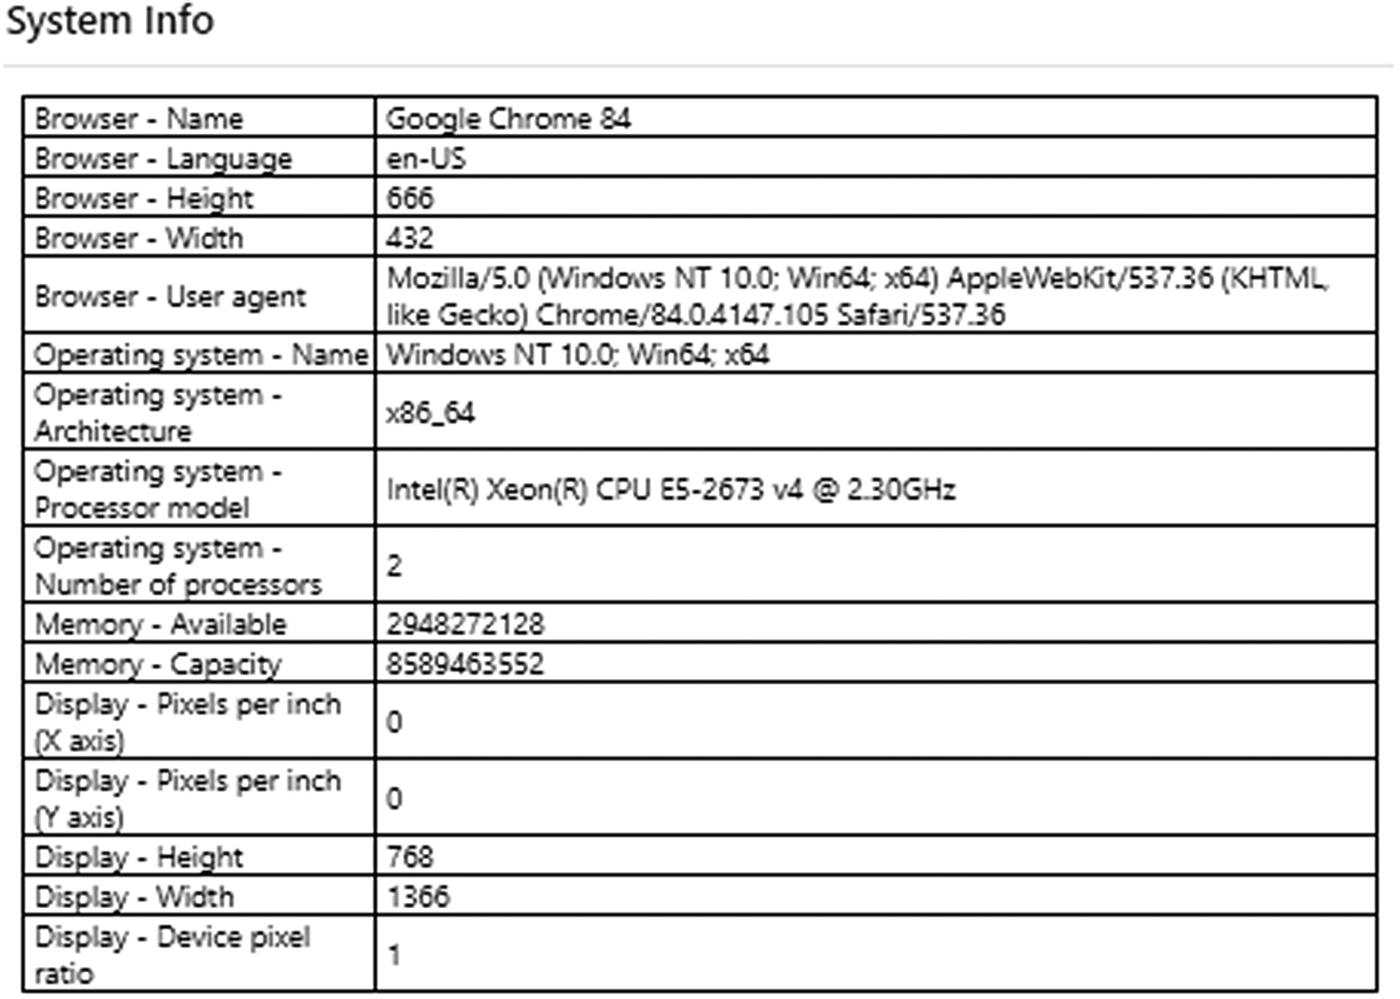
System info captured
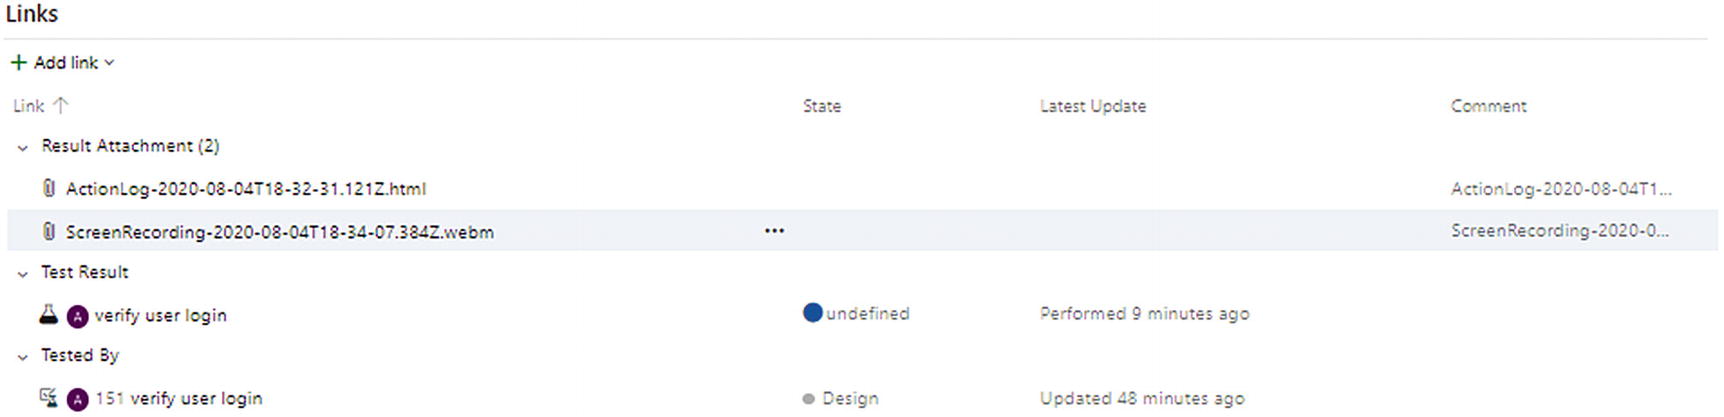
Attachments
Creating a bug based on test case execution provides enough information such as the steps followed, screen recording, image captured, comments, etc., to reproduce the defects in a similar setup.
The Test & Feedback extension will be used for exploratory testing, where the test cases are not defined in the system. Exploratory testing is the random testing of the system to identify the defects. This is explained in more detail in my article published in Simple Talk (https://www.red-gate.com/simple-talk/dotnet/net-development/exploratory-testing-chrome-plugin/).
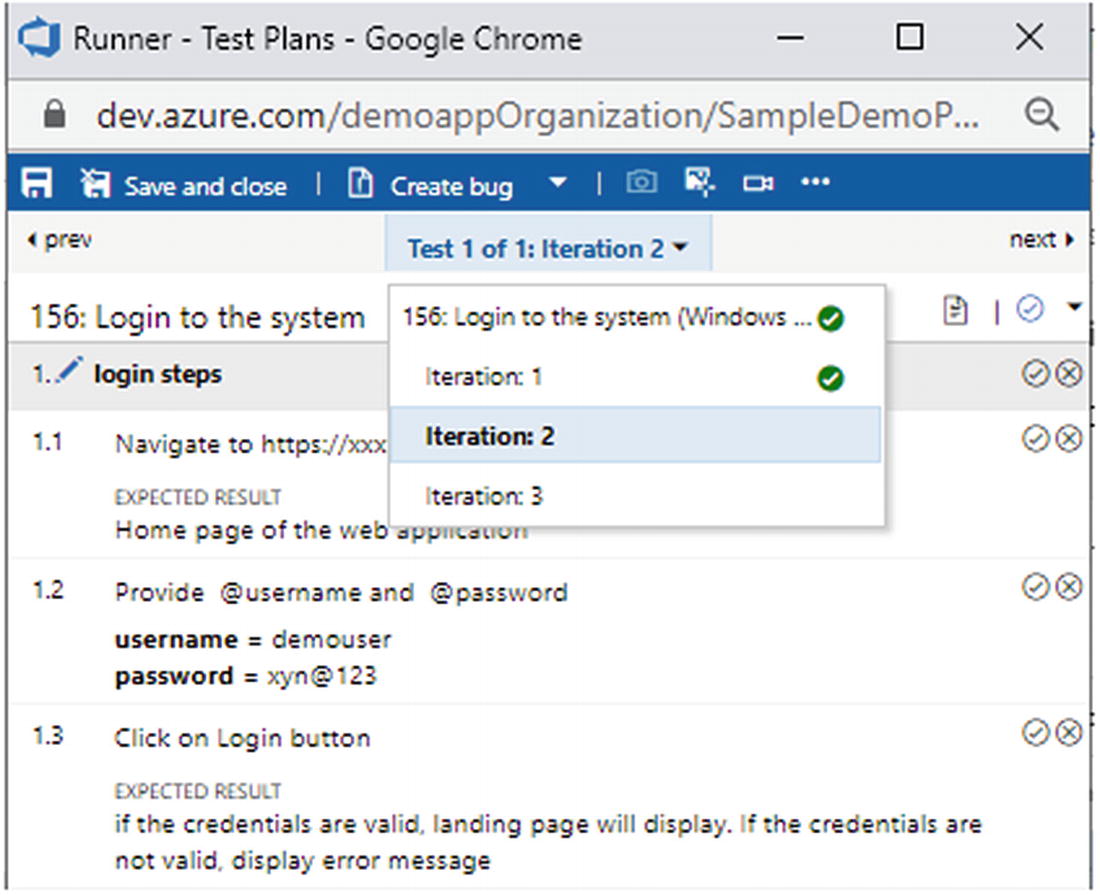
Runner window, multiple iterations
Run for Desktop Application
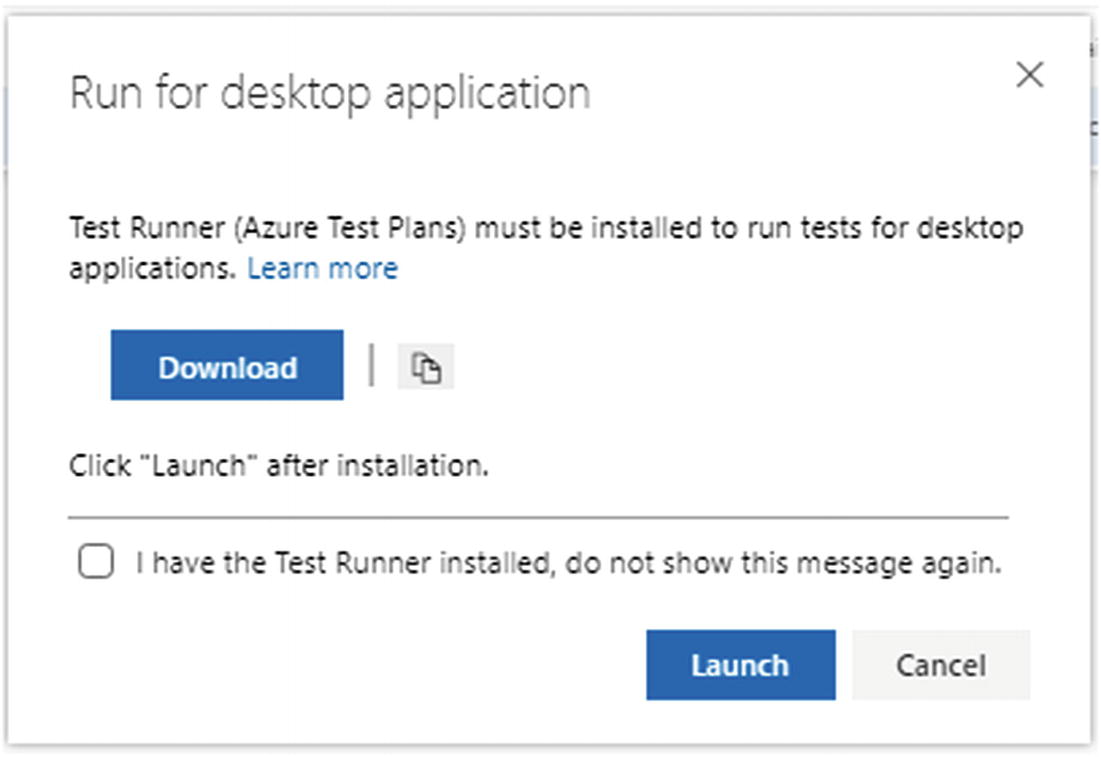
Desktop runner
Download and install Test Runner. Any new test case run against the desktop application will launch the desktop-based Test Runner and capture the desktop environment details while running an application installed in the system.
Run with Options

“Run with options” window
Manual tests using browser-based runner
Manual tests using test runner client
Automated tests using release stage
Manual tests using Microsoft Test Manager 2017 client
Manual tests using Microsoft Test Manager 2015 or earlier client
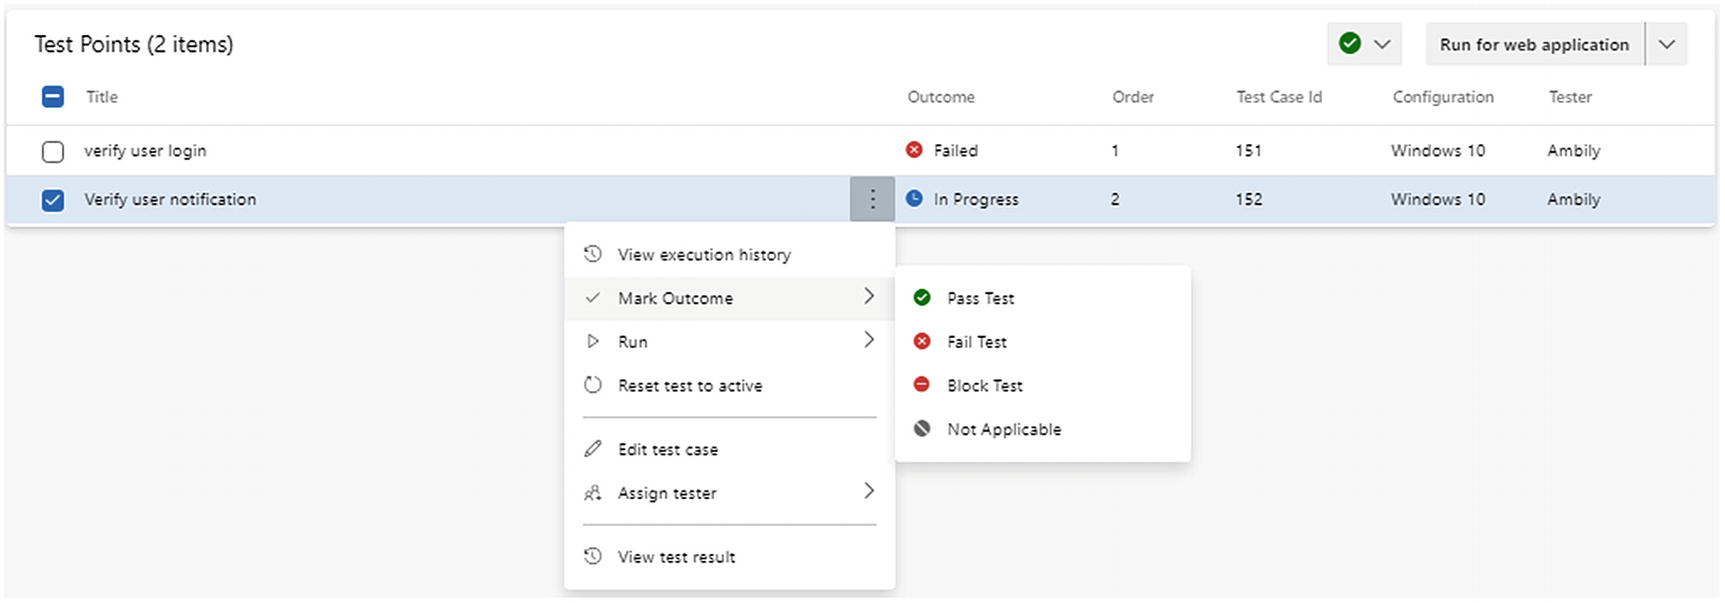
Test case, options
View execution history: This shows the execution history of the test case.
Mark Outcome: This marks the outcome as pass, fail, block, etc.
Run: This runs the test cases using any of the previously mentioned three options.
Reset test to active: This resets the test to active mode.
Edit test case: This edits the test case.
Assign tester: This assigns a tester.
View test result: This views test results.
Chart
New test case chart: Select this option to create a new chart based on the test cases grouped under this test plan, as shown in Figure 5-31. The user can select a specific chart type and associated parameters to define a chart that brings some insight.
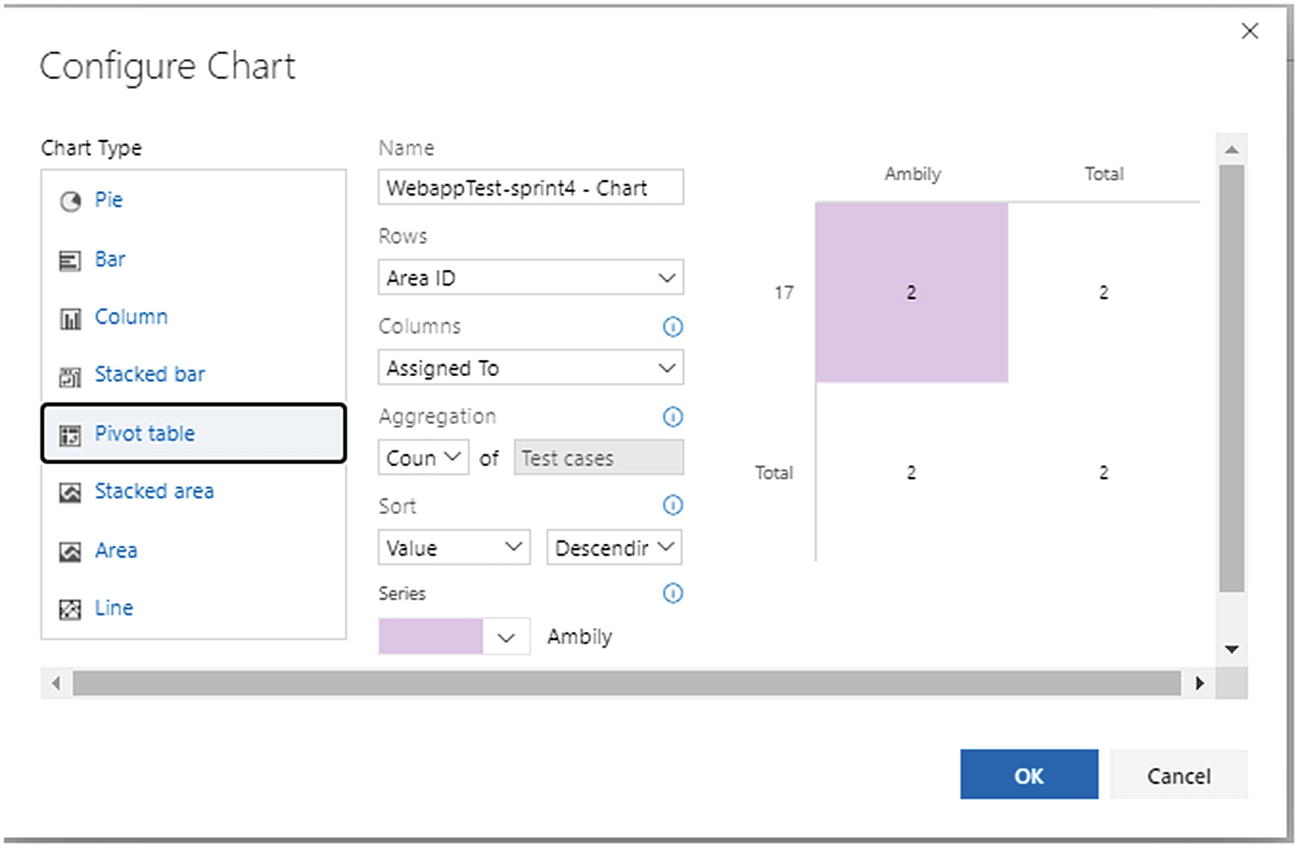
New test case chart
New test result chart: This option supports the creation of a new chart based on the test case results, as shown in Figure 5-32.

New test result chart
In this case, there are fewer chart types available compared to the test case charts. Moreover, the “Group by” parameter will be based on the test run and result only.
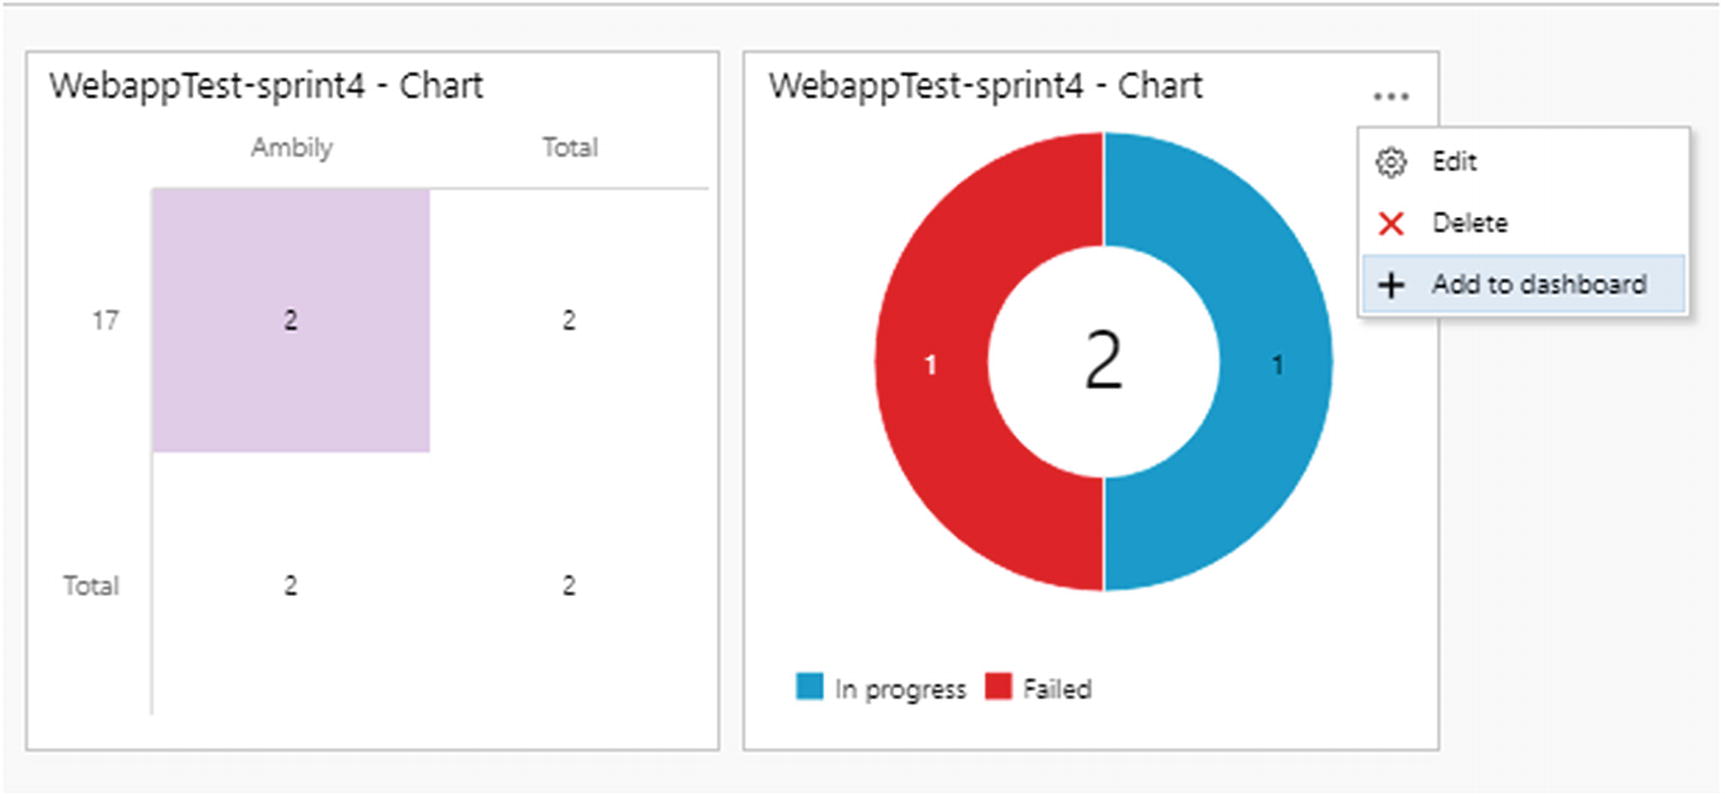
“Add to dashboard” option

Test plan settings
Progress Report

Progress report
Parameters
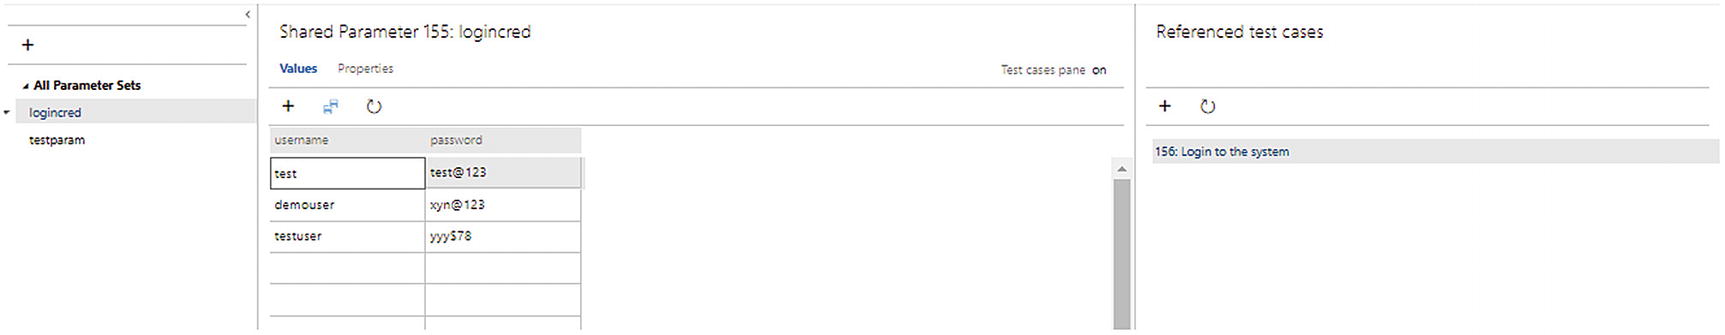
Parameters
The user will be able to add new shared parameters along with the values. The user can turn on or off the related test case view.
Configurations
Test configuration: This defines a set of configurations that can be used for executing a particular test case. For example, when the user tests the platform, the configuration will contain the supported OS such as Windows, Mac, or Linux along with other configuration variables.
Configuration variables: This is used for defining the variables, which can be configured for test configurations, as shown in Figure 5-37.
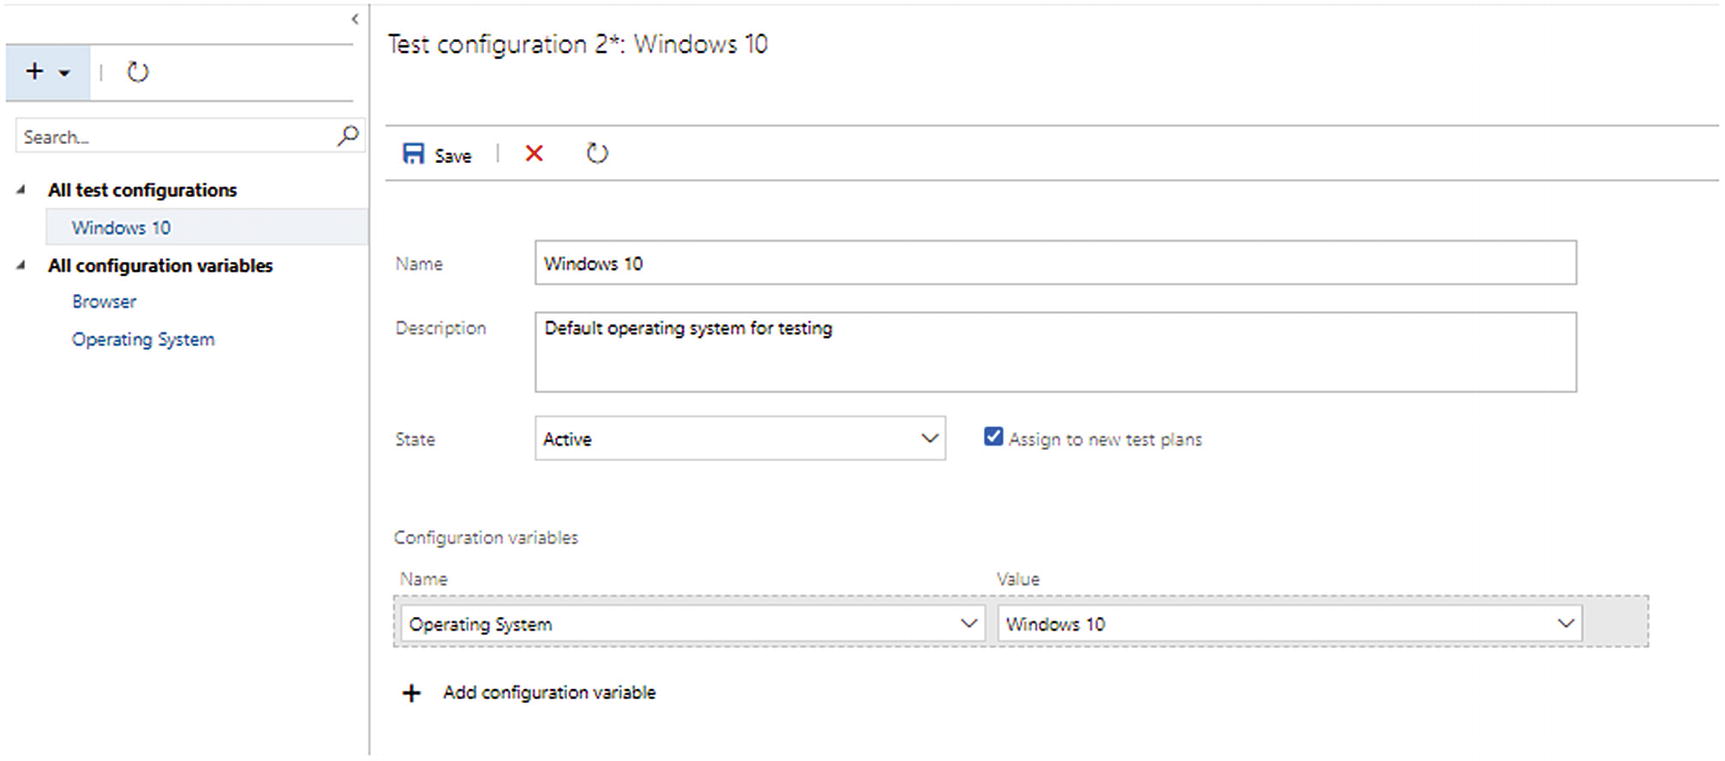
Test configurations
Runs

Test runs

Run details
Load Test
The load testing feature allows you to conduct performance testing on an application. Understanding end-to-end load testing requires a good understanding of performance testing. The load testing feature in Visual Studio and in Azure DevOps is being deprecated; please refer to the Microsoft blog at https://devblogs.microsoft.com/devops/cloud-based-load-testing-service-eol/ for more details.
Summary
Azure DevOps provides a set of test features to do the end-to-end test management. Test plans, test suites, and test cases are the fundamental elements for test management along with other supporting features. Moreover, the integrated platform provides an end-to-end integration between test cases and requirements, implementations, defects, and other artifacts, which enables full traceability.