PART 3
Ready for the
Big Leagues
CHAPTER 9
Intermediate API Topics
At this point in the book, you've reached a real milestone in your development as a map programmer. You now have a solid foundation in both the Maps and Mapplets APIs, including all the building blocks required to create great geo-mashups. In this third and final section, I'm going to bring it all together and focus on real-world mapping solutions, including a number of ways to help you deploy high-quality map applications, as well as more in-depth work with geodata.
We'll get things started in this chapter with several options for custom map markers, ranging from alternatives offered by Google to building the markers yourself from scratch. We'll then revisit geocoding with a solution to help overcome its limitations, followed by a look at one of the alternatives to Google's GGeoXml object, implemented in both mapping APIs. Finally, the chapter shifts into high gear with a solution to displaying larger data sets, the toughest problem you've tackled yet.
By now, you've certainly learned to walk with Google Maps, and you're ready at least to jog. So this chapter is definitely intermediate, if not actually advanced. As such, it's intentionally pitched at a slightly higher level; while I'll still be explaining everything, I'm deliberately not going to dissect every line of code in quite the same level of detail as I have in earlier chapters. We're now approaching the point where you, the fledgling map programmer, will need to fly on your own. Think of this chapter as stretching your wings.
Also, this chapter and the next are semi-optional material. You already have the tools to build functional map mashups. I encourage you to persevere with these chapters—you'll be a better map developer for it—but they're structured in quite self-contained topics, which means you can also just dip into specific areas of interest as needed.
Topic 1: Custom Marker Icons
One of the simplest ways to give your maps a polished look is to use custom marker icons. Let's face it, G_DEFAULT_ICON is easy, but it's also used on everybody's first map, so it inevitably makes your maps look like the work of a beginner. So an excellent step in taking your maps to the next level is to replace your marker icons.
A well-designed icon can convey information, intrinsically helping your map user to find what she is looking for, rather than becoming lost in a field of identical, indistinguishable markers. Good examples include using different icons for different types of locations, intuitive use of color, or icons of varying size. Also, consider using numbered markers, either to link markers to a sidebar list or to convey a bit of data for each marker. Custom icons can enhance both form and function.
Note As a counterpoint, in a mapplet there is some advantage to using the default marker icon. If you'll recall, Google assigns different colors of markers to different mapplets, helping the user to distinguish between them. If you have custom icons that convey extra information relevant to your mapplet, by all means use them. But if not, don't be afraid to stick with G_DEFAULT_ICON in mapplets.
Recap of Changing Icons
Before we get into the various sources of marker images, let's take a moment to review how you use them. As you saw in Chapter 4, the basic process looks something like this:
var myIcon = new GIcon(G_DEFAULT_ICON);

myIcon.image = 'http://somedomain.com/path/to/icon.png';

var options = {icon: myIcon};

var myMarker = new GMarker(coordinates, options);
You declare a new GIcon variable, usually basing it on G_DEFAULT_ICON when your custom image is roughly the same size and shape. You then assign its image property to the URL of your custom icon image and use it in the icon option when creating a GMarker.
You'll find some deviation from this process with more heavily customized icons discussed later, but that's the foundation—it's often just the image URL that changes.
Note As I'm sure you know, it's bad practice to embed an image hosted by someone else on your web page. Exactly the same principle holds true for marker images: your map's icons should be hosted by you. So when you set the myIcon.image property, somedomain.com should be your own domain. The only exception is with icons hosted by Google; because it owns the API, you can generally use its images directly.
Also, using Google's copy of files it hosts increases the chances that your web site visitor may already have the file in her browser cache, reducing your page's load time.
Pre-Made by Google
In support of its Maps API samples, Google maintains a small library of marker icons that are simple to use in your own maps. This is the shallow end of the custom icon pool, so it's a good place to get your feet wet.
Most of the image URLs in Google's library follow a similar pattern, which looks like this:
http://gmaps-samples.googlecode.com/svn/trunk/markers/color/markerx.png
where color is one of blue, green, orange, pink, or red, and x is a number from 1 to 99. Thus, an orange icon with the number 45 in it would use the following URL:
http://gmaps-samples.googlecode.com/svn/trunk/markers/orange/marker45.png
There are two special cases that break this pattern. First, there is a blank marker in each color set, with blank in place of markerx. So a green marker with no number can be referenced this way:
http://gmaps-samples.googlecode.com/svn/trunk/markers/green/blank.png
Second, there are three blank circular markers whose URLs are substantially different:
http://gmaps-samples.googlecode.com/svn/trunk/markers/circular/bluecirclemarker.png

http://gmaps-samples.googlecode.com/svn/trunk/markers/circular/greencirclemarker.png

http://gmaps-samples.googlecode.com/svn/trunk/markers/circular

/yellowcirclemarker.png
And because they're a different size and shape than G_DEFAULT_ICON, these three require a different initialization of the GIcon object. Here's the JavaScript you'll need for one of the circular icons:
var myIcon = new GIcon();

myIcon.image = 'http://gmaps-samples.googlecode.com/svn/trunk/' +

  'markers/circular/yellowcirclemarker.png';

myIcon.iconSize   = new GSize(31, 31);

myIcon.iconAnchor = new GPoint(15, 15);
I'll explain the iconSize and iconAnchor properties in a few pages, when I discuss making your own icons, but for now feel free to simply use this code.
Labeled Markers
Numbers from 1 to 99 are fine, but what if your map would benefit from some other label on the icon? Google's LabeledMarker object is for just that purpose, allowing you to place any text you'd like on a marker.
LabeledMarker isn't part of the standard Maps API—it's a separate utility library produced by Google—so to use it, you need to include it in your page. This is done with a standard XHTML script tag, like so:
<script type="text/javascript" src="http://gmaps-utility-library.googlecode.com

/svn/trunk/labeledmarker/release/src/labeledmarker.js"></script>
Note As with images, it's not good practice to link to JavaScript files on someone else's server directly from your code. In this case, we can again make an exception for Google, but ordinarily you'd copy the source to your own host and link to it there.
In your own map JavaScript, the first thing you need is a blank marker icon to accept the label:
var myIcon = new GIcon(G_DEFAULT_ICON);

myIcon.image = 'http://gmaps-samples.googlecode.com/svn/trunk/' +

  'markers/red/blank.png';
Note that the circular icons from the previous section would also be a good choice here, as they are easily large enough for two or three letters.
Next, there are a few options setting up what the label will contain and how it will be presented:
var options = {icon: myIcon,

               labelText: 'E',

               labelOffset: new GSize(−3, −32),

               labelClass: 'marker_label'};
I'll cover the specifics for these options in just a moment. For now, let's cut to the chase; integrating the LabeledMarker itself is simply a matter of using it instead of GMarker:
var myMarker = new LabeledMarker(coordinates, options);
The results can be seen in Figure 9-1.
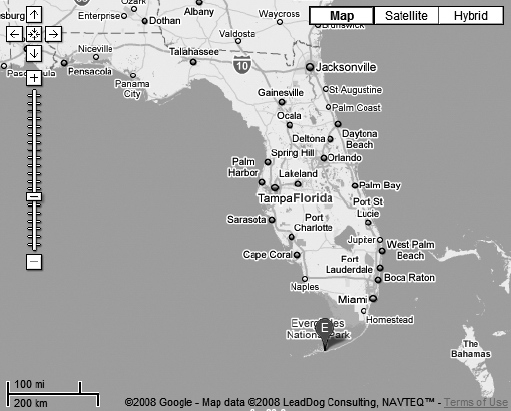
Figure 9-1. LabeledMarker in action
As promised, here's an explanation for the three label options in the example:
labelText: A string to superimpose on the blank marker. Obviously, this should usually be quite short to fit within the marker icon.
labelOffset: A GSize object containing the pixel distance between the marker's latitude/longitude coordinates and the upper-left corner of the label text. So in this example, the offset is 3 pixels left and 32 pixels up. The actual numbers are negative because standard web-design rules ordinarily measure position right and down (from the upper-left corner), so negative numbers reverse those directions.
labelClass: This is the clever one: a CSS class that you use to control all other aspects of the label's appearance. So to produce Figure 9-2, I also have the following CSS rule on my page:
div.marker_label {

  font: 12px sans-serif;

  color: white;

}
Notice the div.marker_label class selector, the same as you'd use for an XHTML element <div class="marker_label"> (which is exactly what LabeledMarker uses internally).
More information on LabeledMarker can be found on Google's reference page for it, at http://tinyurl.com/6kzl98.
The Map Icon Maker
Google has another handy utility, called the Map Icon Maker, for creating standard-shaped markers on the fly in any color you want. It's great on its own, but you can also use it in conjunction with LabeledMarker for full customization.
Like LabeledMarker, the Map Icon Maker is a standalone utility, which needs to be linked into your XHTML before you can use it. Here's the script tag you need:
<script type="text/javascript" src="http://gmaps-utility-library.googlecode.com

/svn/trunk/mapiconmaker/release/src/mapiconmaker.js"></script>
This one's used a bit differently than the previous examples. Just as LabeledMarker was a replacement for GMarker, so MapIconMaker is a replacement for GIcon. You specify options for it and then declare a variable from it:
var iconOptions = {width: 48,

                   height: 48,

                   primaryColor: "#ffffff"};

var myIcon = MapIconMaker.createMarkerIcon(iconOptions);
The options of width, height, and primaryColor are the main ones you'll need. Rather than discussing the additional options that MapIconMaker supports, I recommend that you use Google's Icon Maker Wizard, at http://tinyurl.com/3d68xy. It's a web-based tool for setting all the options, previewing the markers, and generating the JavaScript.
With the custom icon in hand, then, you use it when you create the marker, just as you would with an ordinary GIcon:
var myMarker = new GMarker(coordinates, {icon: myIcon});
The results of this example can be seen in Figure 9-2. I'm not going to go through the additional step to combine MapIconMaker with LabeledMarker, as I have no doubt that you can accomplish that on your own. Note, however, that you can specify a width and height for MapIconMaker, potentially giving you more space in which to fit a LabeledMarker.

Figure 9-2. A map marker from MapIconMaker
Making Your Own Icons
The previous three sections should satisfy every conceivable need for standard-shaped Google Map icons. However, there will be times when you want an icon of a different shape, perhaps to convey specific information, or simply to make your map more distinctive. For that purpose, you'll need to create your icons.
This approach isn't for the faint of heart. To start with, you need sufficient skill with a graphics program (like Illustrator) and an eye for design to create good-looking icon images. But beyond that, for reasons of cross-browser compatibility, building a GIcon up from scratch is remarkably complex. In fact, full coverage of the process is beyond the scope of this book, involving various aspects of PNG and GIF formats, transparency, and image maps. So I'm only going to give you the condensed version, enough to get you started with simple icons.
We'll start with a simple, "flat" icon, without the three-dimensional shadow effect of G_DEFAULT_ICON. For one of my examples later in this chapter, I've created a simple, circular graphic of a star within a circle (see Figure 9-3), so let's go through the process of creating a map icon from it.

Figure 9-3. The two-dimensional star icon (enlarged to show pixel detail)
You begin by creating a GIcon object and setting its image property, as in the previous few sections:
var myIcon = new GIcon();

myIcon.image = 'http://sterlingudell.com/bgmm/markers/star.png';
Note that because my star icon bears very little resemblance to the default Google Maps icon, I don't base the GIcon on G_DEFAULT_ICON as I often did in my examples earlier in the chapter. This will generally be the case for two-dimensional icons.
By not basing your custom icon on the default, however, you're required to define its attributes explicitly, and that's what the next couple of lines will be about. First and foremost is the size of the icon's image:
myIcon.iconSize = new GSize(17, 17);
In this case, the star image is 17 pixels in diameter, so the two parameters (width, height) are both set to 17.
Finally, I need to set the icon's anchor point. This is the pixel coordinate within the image that Google will align with the marker's specified latitude and longitude when we assign the icon to it. In this case, the anchor should be in the middle of the star, halfway down and across the image—so the pixel coordinate is (8, 8). Compare that with the standard Google Map icon (in Figure 9-4); the image is 20 by 34 pixels, but the anchor point is at the middle of the bottom edge, so its coordinates are (10, 34).
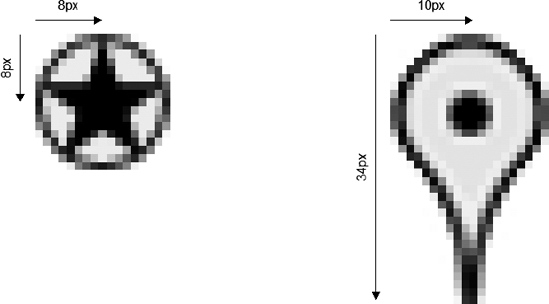
Figure 9-4. My star icon and the standard marker icon, with their anchor point coordinates
When you create your own icons, or find ready-made icon images from elsewhere, you'll need to locate the exact anchor point pixel coordinates in your graphics software.
Tip Icons need to have an odd-numbered pixel size (like 17 for my star icon) in order to be symmetric around their anchor point.
Applying the anchor coordinates to the code, then, is simply a matter of supplying them to the iconAnchor property:
myIcon.iconAnchor = new GPoint(8, 8);
The GPoint API object is used for expressing pixel coordinates (as distinct from latitude/longitude coordinates, for which you use GLatLng).
Finally, you need an infowindow anchor. The principle here is the same as for iconAnchor—pixel coordinates within the graphic—except that this is the point on the icon where the infowindow will "attach." In my case, it's at (12, 4), or roughly the one-o'clock position on the rim of the circle:
myIcon.infoWindowAnchor = new GPoint(12, 4);
Again, you'll need to find the exact pixel coordinates using your graphics software.
And that's sufficient for a simple, flat icon like this. Bringing it all together, the full JavaScript looks like this:
var myIcon = new GIcon();


myIcon.image = 'http://sterlingudell.com/bgmm/markers/star.png';

myIcon.iconSize         = new GSize(17, 17);

myIcon.iconAnchor       = new GPoint(8, 8);

myIcon.infoWindowAnchor = new GPoint(12, 4);
To see this icon in action, please flip forward to Figure 9-9.
For a three-dimensional icon, you have the added complication of a shadow. This is a semitransparent gray outline of your icon that the API will place underneath it (and other, nearby markers) for the visual effect that your marker is standing up from the map. It is a separate graphic file from your main marker image. If you're proficient enough with your graphics software, you can make one yourself; otherwise, you can find an automated shadow generator at http://www.cycloloco.com/shadowmaker.
Once you have your shadow image, you need to tell the API about it. Not surprisingly, it's back to the GIcon object. In Listing 9-1, you can find the complete, minimal specification for a three-dimensional icon based on the graphics in Figure 9-5. I've highlighted the new shadow-related properties.

Figure 9-5. The icon and shadow images for a three-dimensional icon (enlarged to show pixel detail)
Listing 9-1. JavaScript to Assign the Basic Properties for a Three-Dimensional Icon
var myIcon = new GIcon(G_DEFAULT_ICON);

myIcon.image = 'http://sterlingudell.com/bgmm/markers/music.png';

myIcon.iconSize         = new GSize(25, 40);

myIcon.iconAnchor       = new GPoint(12, 40);

myIcon.infoWindowAnchor = new GPoint(12, 1);

myIcon.shadow     = 'http://sterlingudell.com/bgmm/markers/shadow.png';
myIcon.shadowSize = new GSize(41, 40);
The shadow property is fairly self-explanatory; it's the URL of your shadow graphic. And shadowSize is the width and height of that graphic. Note that the API will align the upper-left corners of your main icon image and its shadow, so you may need to add some top and left margin if you create your own shadow graphics.
There are many more GIcon properties that you can set, and for full cross-platform compatibility, you should. I refer you to the Google documentation (see Appendix D) for the complete list. The properties in Listing 9-1, however, are sufficient for a bare-bones three-dimensional icon, as shown in Figure 9-6.
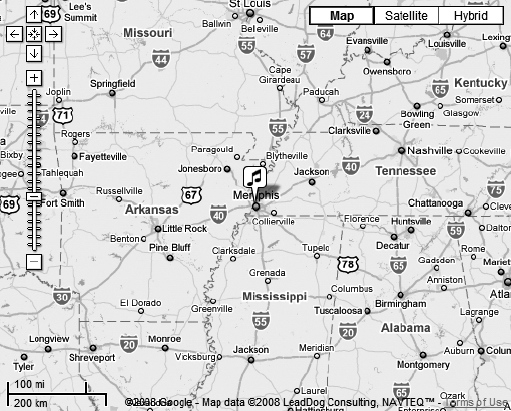
Figure 9-6. The three-dimensional custom icon in action
That concludes my coverage of custom map icons, though I'll continue to use them in my examples throughout the rest of the chapter.
Topic 2: Verified Geocoding
In Chapter 5 I introduced geocoding, the process of turning everyday addresses into map-compatible coordinates. And as you'll recall, I mentioned that geocoders are far from perfect; they get some addresses wrong, occasionally very wrong, and are unable to find other addresses at all. For this reason, it's generally unwise to rely on geocoding in an automated or unattended process. In this topic, on the other hand, we'll take a look at a process for which geocoding is well suited and which you can probably apply to a web project of your own at some point.
The case in point is that of a web form where a user is entering information—for example, within the context of a sign-up process. If the information on the form includes an address, then—as we know—there is implied geospatial information there. But in order to make use of it, perhaps on a member or customer map, we'll need to geocode that address, and we'd like it to be correct. So the approach will be as follows:
- Let the user enter the address.
- Geocode that address.
- Display the geocoded results on the map.
- Let the user correct the mapped location if necessary.
- Save the verified coordinates with the user's address.
The Basic Page
Figure 9-7 shows the page we're working with: a very basic XHTML form for entry of the user's address. Of course, in a real web application this content would be contained within a larger page structure, but these are the essential elements.
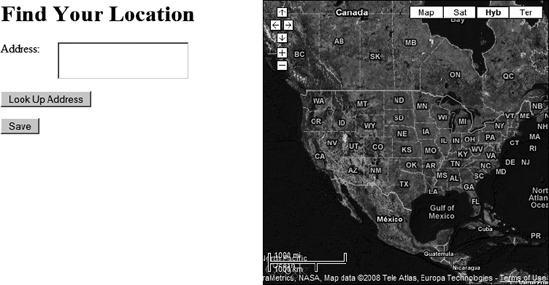
Figure 9-7. The basic location entry page
In this example, I've used a freeform textarea element for the address entry; but the same technique would work fine with separate address fields—street, city, state, and so on, which some sites might need for a back-end database. In such a case, only a bit more JavaScript would be required to assemble a single address from those fields. For now, let's keep it simple.
In Listings 9-2 and 9-3 you'll find the XHTML and CSS code for the location entry form. There's only one thing I want to draw your attention to: there are two hidden input elements, for latitude and longitude. We'll come back to these later, but for the moment just be aware of them; they're key to this approach.
Listing 9-2. XHTML for the Location Entry Page
<!DOCTYPE html PUBLIC "-//W3C//DTD XHTML 1.0 Strict//EN"
"http://www.w3.org/TR/xhtml1/DTD/xhtml1-strict.dtd">
<html xmlns="http://www.w3.org/1999/xhtml">
<head>
<meta http-equiv="Content-Type" content="text/html; charset=UTF-8" />
<title>Geocoding Revisted</title>
<link type="text/css" rel="stylesheet" href="listing_09_03.css" />
<script type="text/javascript"
src="http://maps.google.com/maps?file=api&v=2.124&key="></script>
<script type="text/javascript"
src="http://gmaps-utility-library.googlecode.com
/svn/trunk/mapiconmaker/release/src/mapiconmaker.js"></script>
<script type="text/javascript" src="listing_09_06.js"></script>
</head>
<body onload="loadMap()" onunload="GUnload()">
<div id="map"></div>
<h1>
Find Your Location
</h1>
<form method="post">
<p>
<label for="address">Address:</label>
<textarea name="address" id="address"></textarea>
</p>
<p>
<input type="button" value="Look Up Address"
onclick="geocode(); return false;" />
</p>
<p>
<input type="hidden" name="latitude" id="latitude" />
<input type="hidden" name="longitude" id="longitude" />
<input type="submit" value="Save" />
</p>
</form>
</body>
</html>
Listing 9-3. CSS for the Location Entry Page
label {

  float: left;

  width: 5em;

}


p {

  clear: left;

}


#map {

  float: right;

  width: 400px;

  height: 400px;

  border: 1px solid;

  overflow: none;

}
Geocoding the Address
When the user enters his address in the textarea and clicks the Look Up Address button, the process gets underway. It starts the same as in Chapter 5, where you first saw geocoding: an event handler on the button calls a geocode function.
function geocode()

{

  var address = document.getElementById('address').value;

  geocoder.getLatLng(address, afterGeocode);

};
There's very little here, and certainly nothing to surprise you; the address is extracted from the XHTML and passed along to the geocoder, along with the callback function for when the process returns.
Let's take a look at that callback function, in Listing 9-4.
Listing 9-4. The afterGeocode Callback Function
function afterGeocode(coordinates)

{

  if (coordinates == null)

    alert('Address not found. Please try again.'),

  else

  {

    // Address was found

    if (marker == null)

    {

      // This is the first time we've geocoded an address, so create the marker

      var iconOptions = {width: 24, height: 24, primaryColor: "#fffc1b"};

      var myIcon = MapIconMaker.createMarkerIcon(iconOptions);

      marker = new GMarker(coordinates, {icon: myIcon, draggable: true});

      map.addOverlay(marker);


      GEvent.addListener(marker, 'dragend',   markerDragEnd);

      GEvent.addListener(marker, 'dragstart', markerDragStart);

    }

    else

    {

      // The marker already exists; just move it to the new coordinates

      marker.setPoint(coordinates);

    }


    map.setCenter(coordinates, 14);


    marker.openInfoWindowHtml('Drag marker to exact location, then click Save.'),

    saveCoordinates();

  }

};
Again, much of this should look familiar from Chapter 5:
- Confirm that the address was found; if not, just show an
alert. - If address was found, check if the marker already exists.
- If not, create a marker at the returned coordinates. Note that it's a custom marker from
MapIconMaker. - If the marker does exist, move it to the returned coordinates.
- In either case, center the map on the marker at a reasonably high level of zoom, with
map.setCenter(coordinates, 14).
Verifying the Address
The new code, highlighted in Listing 9-4, is all related to the address verification process, and the approach I'm taking is based on a draggable GMarker. The idea is that if the geocoder got the user's address wrong, she can correct it by dragging the marker with her mouse to the right location. It's a simple and intuitive user interface; let's take a look at how it works.
The first part is that when you create the marker, you include an option of draggable: true. This simple flag is enough to instruct the API that the marker isn't permanently fixed but can be dragged around by the user.
Second, you need to attach a couple of event listeners to the dragging process:
GEvent.addListener(marker, 'dragend',   markerDragEnd);

GEvent.addListener(marker, 'dragstart', markerDragStart);
We'll get into what these event handlers do in a moment.
Third, you should let the user know what's going on, that she can—and should—drag the marker to confirm her address. I use the simple mechanism of an infowindow containing the instructions:
marker.openInfoWindowHtml('Drag marker to exact location, then click Save.'),
Finally, save the initial returned coordinates; you never know, they just might have been right.
saveCoordinates();
I'll cover this function in detail in the next section.
So the user then drags the marker until it's stuck on top of her house in the satellite imagery. Of course, this is where the dragstart and dragend event handlers come in, as shown in Listing 9-5.
Listing 9-5. The Marker Drag Event Handlers
function markerDragStart()

{

  map.closeInfoWindow();

};


function markerDragEnd()

{

  saveCoordinates();


  var content = '<a href="#" onclick="map.zoomIn(); return false">Zoom in</a>' +

                ' if needed to place marker<br />exactly, or click Save when done.';

  marker.openInfoWindow(content);

};
The markerDragStart handler is quite straightforward, closing the infowindow when marker dragging commences. This covers a minor quirk in the Maps API: the marker can be dragged away from its infowindow, leaving the latter hanging awkwardly in midair. But it's simple enough to work around.
And to be honest, markerDragEnd is not much more difficult:
- Save the new coordinates (that the marker has just been dragged to).
- Show another instructions infowindow, with
contentto nudge the user along in the process.
Saving the Coordinates
All that remains is to save the new coordinates, called from both afterGeocode and markerDragEnd. The saveCoordinates function is as follows:
function saveCoordinates()

{

  var coordinates = marker.getPoint();

  document.getElementById('latitude').value  = coordinates.lat().toFixed(6);

  document.getElementById('longitude').value = coordinates.lng().toFixed(6);

};
Here's where the rubber meets the road: the function gets the current marker coordinates and then saves them into the latitude and longitude XHTML form fields. It's incredibly simple, but effective; with the verified coordinates in the XHTML form, they'll be passed back to the web server when the user submits the form, right alongside the address. The same server process that's already in place to handle form submissions—saving the information to a database, most likely—will now receive the latitude and longitude also.
To illustrate how this will work, Figure 9-8 shows the form, with verified address, ready for submission. I've removed the hidden attribute from the coordinate fields to show that their values are ready to go as well.

Figure 9-8. Location form ready for submission, with latitude (38.897646) and longitude (−77.036605) shown
Bringing It All Together
So with just a couple of additional form fields, and a really minimal amount of JavaScript, we now have a mechanism to gather accurate, verified geospatial coordinates from a user sign-up process—or anything else that involves entering an address on a web form: perhaps an order processing system, which will now have a precise destination to pass to a delivery driver. The rubber meets the road, indeed.
For completeness, the full JavaScript for this example can be found in Listing 9-6 (and for once it doesn't include any code you haven't seen before).
Listing 9-6. JavaScript for the Geocode Verification
// Declare variables for later use

var map;

var geocoder;

var marker;


function loadMap()

{

  // loadMap: initialize the API and load the map onto the page


  // Get the map container div

  var mapDiv = document.getElementById('map'),


  // Confirm browser compatibility with the Maps API

  if (!GBrowserIsCompatible())

  {

    mapDiv.innerHTML =

      'Sorry, your browser isn't compatible with Google Maps.';

  }

  else

  {

    // Initialize the core map object

    map = new GMap2(mapDiv,

      {mapTypes: [G_NORMAL_MAP, G_SATELLITE_MAP, G_HYBRID_MAP, G_PHYSICAL_MAP]});


    // Set the starting map viewport

    var coordinates = new GLatLng(39.8, −98.5);

    map.setCenter(coordinates, 3, G_HYBRID_MAP);


    // Add the standard map controls

    map.addControl(new GSmallMapControl());

    map.addControl(new GScaleControl(),

                   new GControlPosition(G_ANCHOR_BOTTOM_LEFT, new GSize(6, 18)));

    map.addControl(new GMapTypeControl(true));


    // Initialize the geocoder object and tie it to the current map view

    geocoder = new GClientGeocoder();

  }

};


function geocode()

{

  // geocode: Call the Google geocoder with the address supplied by the user

  var address = document.getElementById('address').value;

  geocoder.getLatLng(address, afterGeocode);

};


function afterGeocode(coordinates)

{

  // afterGeocode: Callback function for the geocoder, showing the coords on the map

  if (coordinates == null)

    alert('Address not found. Please try again.'),


  else

  {

    // Address was found

    if (marker == null)

    {

      // This is the first time we've geocoded an address, so create the marker

      var iconOptions = {width: 24, height: 24, primaryColor: "#fffc1b"};

      var myIcon = MapIconMaker.createMarkerIcon(iconOptions);

      marker = new GMarker(coordinates, {icon: myIcon, draggable: true});

      map.addOverlay(marker);


      GEvent.addListener(marker, 'dragend',   markerDragEnd);

      GEvent.addListener(marker, 'dragstart', markerDragStart);

    }

    else

    {

      // The marker already exists; just move it to the new coordinates

      marker.setPoint(coordinates);

    }


    map.setCenter(coordinates, 14);


    marker.openInfoWindowHtml('Drag marker to exact location, then click Save.'),

    saveCoordinates();

  }

};


function markerDragStart()

{

  // markerDragStart: Close the infowindow when the marker is being dragged

  map.closeInfoWindow();

};


8function markerDragEnd()

{

  // markerDragEnd: Update the form coordinates and show more instructions


  saveCoordinates();


  var content = '<a href="#" onclick="map.zoomIn(); return false">Zoom in</a>' +

                ' if needed to place marker<br />exactly, or click Save when done.';

  marker.openInfoWindow(content);

};


function saveCoordinates()

{

  // saveCoordinates: Copy the current marker coordinates into the form fields

  var coordinates = marker.getPoint();

  document.getElementById('latitude').value = coordinates.lat().toFixed(6);

  document.getElementById('longitude').value = coordinates.lng().toFixed(6);

};
Additional Notes
As usual, I've only presented the essence of the solution; although it is fully functional as it stands, a production system would probably want a few more bells and whistles. For example, code like Listing 8-2 could easily be integrated into Listing 9-6 for location selection by map click, in addition to the current geocode+drag architecture. This would support users whose addresses fail geocoding entirely, which the system as shown does not.
Also, form validation should be included, perhaps with a function such as this attached to the form element's onsubmit event:
function validateForm()

{

  if (document.getElementById('latitude').value == '')

  {

    alert('Please enter your address or click your location on the map.'),

    return false;

  }

  else

    return true;

};
Such a routine could provide immediate feedback to the user, while also providing another layer of data verification.
Topic 3: Taking Control of GeoXml
Since Chapter 3, we've been making extensive use of Google's GGeoXml object to plot geodata on our map with minimal effort. As you'll recall, however, GGeoXml has certain serious drawbacks, and high on the list is a lack of control over how the geoXML data is displayed. If you don't like how the markers are shown on your map, or you want to do more with the data (like a sidebar display), GGeoXml isn't going to cooperate.
You may also recall, however, that GGeoXml isn't the only game in town. Independent developers have produced alternatives for displaying geodata quickly and easily, and they have shared their efforts with the API community. In this topic, I'll introduce you to one such alternative, an open-source object called EGeoXml, and create an enhanced display of KML data with it.
For this example, I'm displaying a KML data file of U.S. state capitals; this will be a traditional Maps API implementation, on an ordinary web page. Listing 9-7 contains the XHTML for this page; as you can see, it's pretty basic, with just a standard map div plus a sidebar where we'll list the markers from the KML. The only other new element is an additional script tag to link in the egeoxml.js source file; as mentioned earlier in the chapter, you always want to copy external JavaScript files to your own server and link to them there.
Note Download egeoxml.js from the code listing site for this book at http://sterlingudell.com/bgmm/egeoxml.js, or from the download page at apress.com.
Listing 9-7. XHTML for the State Capitals Page
<!DOCTYPE html PUBLIC "-//W3C//DTD XHTML 1.0 Strict//EN"
"http://www.w3.org/TR/xhtml1/DTD/xhtml1-strict.dtd">
<html xmlns="http://www.w3.org/1999/xhtml">
<head>
<meta http-equiv="Content-Type" content="text/html; charset=UTF-8" />
<title>US State Capitals</title>
<link type="text/css" rel="stylesheet" href="listing_09_11.css" />
<script type="text/javascript"
src="http://maps.google.com/maps?file=api&v=2.124&key="></script>
<script type="text/javascript" src="../egeoxml.js"></script>
<script type="text/javascript" src="listing_09_08.js"></script>
</head>
<body onload="loadMap()" onunload="GUnload()">
<div id="map"></div>
<div id="sidebar">
<h1>US State Capitals</h1>
<p id="list"></p>
</div>
</body>
</html>
And naturally, you'll need some JavaScript to make everything work, which can be found in Listing 9-8. Much of this listing will be very familiar to you as standard Maps API code; I've highlighted the interesting parts for further discussion.
Listing 9-8. JavaScript for the State Capitals Page
// Declare variables for later use

var map;

var geoXml;


function loadMap()

{

  // loadMap: initialize the API and load the map onto the page


  // Get the map container div

  var mapDiv = document.getElementById('map'),


  // Confirm browser compatibility with the Maps API

  if (!GBrowserIsCompatible())

  {

    mapDiv.innerHTML =

      'Sorry, your browser isn't compatible with Google Maps.';

  }

  else

  {

    // Initialize the core map object

    map = new GMap2(mapDiv,

      {mapTypes: [G_NORMAL_MAP, G_SATELLITE_MAP, G_HYBRID_MAP, G_PHYSICAL_MAP]});


    // Set the starting map viewport

    var coordinates = new GLatLng(39.8, −98.5);

    map.setCenter(coordinates, 4);


    // Add the standard map controls

    map.addControl(new GLargeMapControl());

    map.addControl(new GScaleControl());

    map.addControl(new GOverviewMapControl());

    map.addControl(new GMapTypeControl());


    // Initialize a custom marker icon

    var starIcon = new GIcon();

    starIcon.image = '../markers/star.png';

    starIcon.iconSize         = new GSize(17, 17);

    starIcon.iconAnchor       = new GPoint(8, 8);

    starIcon.infoWindowAnchor = new GPoint(12, 4);


    // Initialize the KML processor

    var url = 'state_capitals.kml';

    var options = {sidebarid: 'list',

                   markeroptions: {icon: starIcon}};

    geoXml = new EGeoXml(map, url, options);


    // Load the KML

    geoXml.parse();

  }

};
First, you'll notice that I'm using a fully custom marker icon, the two-dimensional star-in-a-circle described in Topic 1 of this chapter. So the initialization of starIcon has essentially already been covered in detail. I can also now reveal that this icon was specifically designed to match the symbol often used for capitals on traditional paper maps.
Next, you're ready to proceed with initializing the EGeoXml object. This happens in the following line:
geoXml = new EGeoXml(map, url, options);
The EGeoXml object initialization takes three parameters, as follows:
- The GMap2 object on which the data will be displayed. Here (as in all my examples) it's simply
map(and it's not a string). - The URL of the KML file to display. In this example, I set the
urlvariable a couple of lines earlier, using a relative URL to a file hosted in the same directory as my JavaScript source:
var url = 'state_capitals.kml'; - A list of
options. This is whereEGeoXmlreally shines, in all the options it provides us. Here I'm using two options, established with the following code:
var options = {sidebarid: 'list',

               markeroptions: {icon: starIcon}};
Let's take a look at these options in more detail.
The first option, sidebarid, is the id attribute of an XHTML element where EGeoXml will list all the KML data it processes. Refer back to Listing 9-7 and you'll see <p id="list"> in the sidebar div. So list is the element id you need here.
The second item, markeroptions, is itself a list of options. Specifically, these are the options that EGeoXml will use when creating GMarkers from KML Placemarks. And remember from Topic 1 that you specify custom marker icons by passing them to GMarker this way:
var myMarker = new GMarker(coordinates, {icon: starIcon});
Therefore, specifying {icon: starIcon} for EGeoXml's markeroptions will create the map markers with my custom starIcon. Any valid GMarker option (such as draggable: true, from Topic 2) can be included here.
The options list for EGeoXml can be far more extensive than I'm using here; you can include as many options as you like, and in any order. For a full list of the possible options, see the EGeoXml documentation at http://econym.googlepages.com/egeoxml.htm.
With the EGeoXml object fully initialized (in a variable named geoXml), it's a simple matter to add its KML data to the map:
geoXml.parse();
Since we specified a sidebarid option, geoXml will also list each marker there, and as a bonus these sidebar items are clickable links. You can see the results in Figure 9-9; clicking on a state in the sidebar opens the infowindow for the associated capital marker.

Figure 9-9. Custom marker icons and clickable sidebar links from KML
Of course, EGeoXml does have certain drawbacks, and it's worth reviewing them here:
- It supports only a subset of the KML specification. As a result, some KML files won't display with
EGeoXml, nor will any KMZ files or GeoRSS feeds. - The KML must be hosted on the same server as your map, because of browser security restrictions. We'll see one way around this in the next topic, however.
- Unlike Google's
GGeoXmlobject,EGeoXmlperforms no caching, meaning that the KML is retrieved from your server every time the page is loaded (but again, see the next topic for more information).
Overall, though, EGeoXml is a good alternative for displaying your own KML data in a map, and I'll continue to use it throughout the chapter.
Topic 4: Converting to a Mapplet
A question that frequently arises with map developers is, "How do I convert an existing Maps API implementation to a mapplet?" In this section and the next, we'll look at some of the issues surrounding such a conversion.
The first question you should ask yourself is what aspects of your Maps application are well suited to life in a mapplet. Remember that mapplets exist in a shared environment. Will your application coexist happily with others, or does it need too much control over the underlying map?
Before embarking on a conversion, it's also worthwhile investigating its feasibility. The Mapplets API is smaller than the Maps API; not all functionality is replicated between them. So the key question is, do any of your application's core features rely on API functions or objects that don't exist on the mapplet side?
Tip The main Google Maps site typically uses the latest released version of the Maps API internally (equivalent to version=2 in the Maps API, from Chapter 2). As a result, many newer Maps features are available in mapplets, even if they aren't specifically documented for the Mapplets API. And in general, the Mapplets API documentation does seem to lag a good deal behind the functionality, so if there's a particular function, object, or event you want to use that's not listed in the documentation, build a small test mapplet and give it a try.
Assuming that your Maps API application is suitable, I encourage you to proceed with the transition to the Mapplets API. To help guide you, I've converted the State Capitals application (from the previous topic) to a mapplet, as shown in Figure 9-10. The specification for this mapplet can be found in Listing 9-9.

Figure 9-10. The State Capitals mapplet, faithfully duplicating the original application
Listing 9-9. Specification for the State Capitals Mapplet
<?xml version="1.0" encoding="UTF-8"?>

<Module>

  <ModulePrefs title="US State Capitals"

               description="The capitals (and capitols) of the 50 US states."

               author="Sterling Udell"

               author_email="[email protected]"

             screenshot="http://sterlingudell.com/bgmm/chapter_09/state_scr.png"

             thumbnail="http://sterlingudell.com/bgmm/chapter_09/state_thm.png">

    <Require feature="sharedmap" />

    <Require feature="dynamic-height" />

  </ModulePrefs>

  <Content type="html"><![CDATA[

    <style type="text/css">

      p {

        font-size: 90%;

      }

    </style>


    <p id="list"></p>


    <script type="text/javascript"

            src="http://sterlingudell.com/bgmm/egeoxml.js"></script>

    <script type="text/javascript">

      function xmlParsed()

      {

        // xmlParsed: After KML processing, adjust the height of the sidebar display

        _IG_AdjustIFrameHeight();

      };


      // END FUNCTION DECLARATIONS - BEGIN MAIN MAPPLET CODE


      // Initialize the map

      var map = new GMap2();


      // Initialize a custom marker icon

      var starIcon = new GIcon();

      starIcon.image = 'http://sterlingudell.com/bgmm/markers/star.png';

      starIcon.iconSize         = new GSize(17, 17);

      starIcon.iconAnchor       = new GPoint(8, 8);

      starIcon.infoWindowAnchor = new GPoint(12, 4);


      // Initialize the KML processor

      var url = 'http://sterlingudell.com/bgmm/chapter_09/state_capitals.kml';

      var options = {sidebarid: 'list',

                     markeroptions: {icon: starIcon},

                     nozoom: true};

      var geoXml = new EGeoXml(map, url, options);


      // Attach an event handler for after the KML is processed

      GEvent.addListener(geoXml, 'parsed', xmlParsed);


      // Load the KML

      geoXml.parse();

    </script>

  ]]></Content>

</Module>
A comparison with Listing 9-8 will show that much of the core JavaScript is unchanged. I've simply removed the inapplicable aspects (predominantly GMap2 parameters, setCenter, and addControl calls) and then copied the remainder into the mapplet framework that you should be familiar with by now. The following are the high points from this conversion:
- I've moved the essential JavaScript from an external
.jsfile into the mainscriptelement of the mapplet, as discussed in Chapter 7. - It was impractical to move the
EGeoXmlsource code into the mapplet, so my code is still referencing the externalegeoxml.jsfile, using another standardscripttag.
Note The original EGeoXml object was developed for the Maps API; the beauty of open source is that I was able to modify it slightly to make it mapplet-compatible. If you want to use EGeoXml in a mapplet, you need to copy it from the URL in Listing 9-9 or the Apress download site for this book. Do not try to use the original code (written by Mike Williams and available from his web site) in a mapplet.
An advantage of this port is that the mapplet version is able to use a different mechanism to retrieve the KML. As a result, it's no longer limited to KML from the hosting domain (any publicly accessible URL will work), and it also uses the Google caching mechanism (to speed response time and reduce server load). Good news all around.
- All URLs are now absolute, as mapplets are served from the
gmodules.comdomain rather than my own server. - In accordance with the Good Neighbor policies from Chapter 8, I'm disabling
EGeoXml's default behavior that when the KML finishes loading, it automatically zooms the map to encompass all the points. I do this with an additional option,nozoom: true. - There's an event handler,
xmlParsed, attached to theEGeoXmlobject. It will fire when the KML parsing has completed (and therefore all data has been displayed). - When this event fires, a call to
_IG_AdjustIFrameHeightwill resize the sidebar to accommodate its content. I alsoRequirethe associateddynamic-heightmodule.
I'm fortunate with this application; it's simple enough that it contained no functionality incompatible with the mapplet platform. But this is potentially the biggest part of a conversion: where your application uses a Maps API function or object that is different in the Mapplets API, that code will need to be altered. You'll find more information on this in the last topic of the chapter, but beyond that, there's not a lot of specific guidance I can give you. You'll need to delve into the documentation yourself, do some testing, and perhaps ask other map developers for assistance if you get stuck. You can find links to relevant resources in Appendix D.
Topic 5: Larger Data Sets
You may recall that in previous chapters, I've recommended that you shouldn't plot more than about 50 markers on a Google map at any one time—ideally, no more than 25. It's a good guideline, and it's easy enough to comply with if your data set naturally fits within it, like the state capitals. But what about larger data sets? Especially when working with geodata from other sources, you often have no control over the quantity. What should you do when a KML file contains a thousand Placemarks?
Answering that question is the subject of the last topic in this chapter, and it's also the most ambitious. Although I've made it as simple as possible, the code in this topic is easily the most advanced to this point in the book, and it contains JavaScript constructs you may never have seen before. If you're up for a challenge, however, it's an extremely valuable technique to have in your map programming toolbox.
So, brave knights, if you do doubt your courage, or your strength, then come no further...
—Tim the Enchanter, Monty Python and the Holy Grail
Still with me? Good. At the least, I can promise you a worthy example: it's a map of all the breweries in Great Britain, 459 of them.
Executive Summary
The approach we're going to use is as follows. When the page loads, an EGeoXml object will load the KML, same as with the State Capitals. However, it's not going to create 459 map markers. Instead, it will add the data for each Placemark to a JavaScript array. Then whenever the map moves, an event handler will display markers for up to twenty data points within the map view-port. The upshot is that although we've loaded 459 data points, no more than 20 are ever shown at once. As the user pans and zooms the map, it'll be a different 20, but never more than that.
Loading the Data
As usual, we start with the XHTML and CSS for the page where the map will live, shown in Listings 9-10 and 9-11. You'll notice that Listing 9-10 is virtually identical to Listing 9-6, a basic map plus sidebar; only the names have been changed. They even use the same stylesheet. There is one additional JavaScript file being included, async.js, but I'll discuss that in a few pages.
Listing 9-10. XHTML for the Basic UK Brewery Map Page
<!DOCTYPE html PUBLIC "-//W3C//DTD XHTML 1.0 Strict//EN"
"http://www.w3.org/TR/xhtml1/DTD/xhtml1-strict.dtd">
<html xmlns="http://www.w3.org/1999/xhtml">
<head>
<meta http-equiv="Content-Type" content="text/html; charset=UTF-8" />
<title>British Breweries</title>
<link type="text/css" rel="stylesheet" href="listing_09_11.css" />
<script type="text/javascript"
src="http://maps.google.com/maps?file=api&v=2.124&key="></script>
<script type="text/javascript" src="../egeoxml.js"></script>
<script type="text/javascript" src="../async.js"></script>
<script type="text/javascript" src="listing_09_15.js"></script>
</head>
<body onload="loadMap()" onunload="GUnload()">
<div id="map"></div>
<div id="sidebar">
<h1>Breweries in Great Britain</h1>
<ol id="list"></ol>
</div>
</body>
</html>
Listing 9-11. CSS for the Basic UK Brewery Map Page
html {

  height: 100%;

}


body {

  height: 100%;

  margin: 0;

  font-family: sans-serif;

  font-size: 90%;

}


#map {

  width: 70%;

  height: 100%;

}


#sidebar {

  position: absolute;

  left: 70%;

  top: 0;

  right: 0;

  bottom: 0;

  overflow: auto;

  padding: 1em;

}


h1 {

  margin: 0;

  font-size: 100%;

}


ul {

  padding-left: 1em;

}

li {

  padding-left: 0em;

}
Things begin to get interesting in the JavaScript. You can find the first part in Listing 9-12; I'll go over its important aspects before we dive into the block of code that drives the 20-marker display.
Listing 9-12. The Basic UK Brewery Map (First Half)
// Declare variables for later use

var map;

var geoXml;

var data = new Array();

var markers = new Array();


function loadMap()

{

  // loadMap: initialize the API and load the map onto the page


  // Get the map container div

  var mapDiv = document.getElementById('map'),


  // Confirm browser compatibility with the Maps API

  if (!GBrowserIsCompatible())

  {

    mapDiv.innerHTML =

      'Sorry, your browser isn't compatible with Google Maps.';

  }

  else

  {

    // Initialize the core map object

    map = new GMap2(mapDiv,

      {mapTypes: [G_NORMAL_MAP, G_SATELLITE_MAP, G_HYBRID_MAP, G_PHYSICAL_MAP]});


    // Set the starting map viewport

    var coordinates = new GLatLng(53.6, −4.3);

    map.setCenter(coordinates, 6);


    // Add the standard map controls

    map.addControl(new GLargeMapControl());

    map.addControl(new GScaleControl());

    map.addControl(new GOverviewMapControl());

    map.addControl(new GMapTypeControl());


    // Initialize the KML processor

    var url = 'uk_breweries.kml';

    var options = {sidebarid: 'list', createmarker: createMarker, nozoom: true};

    geoXml = new EGeoXml(map, url, options);


    // Attach an event handler for after the KML is processed

    GEvent.addListener(geoXml, 'parsed', xmlParsed);


    // Load the KML

    geoXml.parse();


    // Attach an event to refresh the marker display whenever the map moves

    GEvent.addListener(map, 'moveend', mapMoveEnd);

  }

};


function addDataPoint(coordinates, name, description)

{

  // addDataPoint: save the data for a placemark found by the KML processor

  var d = data.length;

  data[d] = {coords: coordinates, title: name, details: description};

};


function xmlParsed()

{

  // xmlParsed: after KML processing, initialize the marker display

  mapMoveEnd();

};
The first thing to notice is the declaration of two array variables, data and markers:
var data = new Array();

var markers = new Array();
The former is the array that we'll load the KML Placemark data into, and later on we'll use the latter to manage the markers that are shown on the map.
Tip Recall that when it's not in a mapplet, the KML file used with EGeoXml must be hosted on the same domain as the page that displays it. Here, that's indicated by the relative URL for uk_breweries.kml.
Second, note that I've added a further option, createmarker: addDataPoint, when initializing EGeoXml. This is a callback function that EGeoXml will use as it is processing the KML data, and by setting the createmarker option we're basically saying, "Call my addDataPoint function rather than adding a marker to the map."
Next, take a look at that addDataPoint function. When EGeoXml calls this function, it passes three parameters—coordinates, name, and description—with the data from the corresponding elements in a KML Placemark (see Listing 1-1). And EGeoXml calls this for every Placemark. In turn, we package those three pieces of information up and add them to the data array:
var d = data.length;

data[d] = {coords: coordinates, title: name, details: description};
The result is that when the EGeoXml object has finished loading the KML, the data array will contain 459 elements, each containing the coords, title, and details for a single brewery.
Then the xmlParsed function will call the mapMoveEnd event handler, and the real fun will start.
Displaying 20 Data Points
After the data has finished loading, and every time the user moves the map, the mapMoveEnd event handler will be triggered. This is the real heart of this application: finding 20 data points within the map viewport to display. Here's how it works:
- Get the map boundary coordinates, defining the area in which we'll display markers.
var mapBounds = map.getBounds(); - Remove the previous set of markers from both the map and the
markersarray. This is done by means of a JavaScript statement called aforloop; Appendix B contains a full explanation, but for now, just accept that it will execute a block of code repeatedly, once for every element in the array:
for (var m = markers.length - 1; m >= 0; m--)
{
map.removeOverlay(markers[m]);
markers.splice(m, 1);
}
- Look for data in the new map area. This search is done with another
forloop, this time going through the basedataarray we set up in the last section. So for every data point we loaded withaddDataPoint
for (var d = 0; d < data.length; d++)
{
- Does the map viewport contain this data point?
if (mapBounds.contains(data[d].coords))
{ - Yes, it does. Create a new marker and add it to the array.
m = markers.length;
markers[m] = new GMarker(data[d].coords); - Save the associated brewery details with this marker as well.
markers[m].data = data[d]; - Add the marker to the map.
map.addOverlay(markers[m]); - Also attach an event handler to show detail information when the marker is clicked. Note the creation of a
Functionon the fly, containingm, the index of this marker!
GEvent.addListener(markers[m], 'click',
new Function('showDetail(' + m + ')')); - Create sidebar content for this data point, including a click event handler. Again, note that the event handler here has the marker array index
min it.
sidebarContent = sidebarContent +
'<li><a href="#" onclick="showDetail(' + m + '), return false">' +
data[d].title + '</a></li>'; - Have we added 20 markers yet? If so, finish off the sidebar content and break out of the
forloop.
if (m >= 19)
{
sidebarContent = sidebarContent +
'<li style="list-style: none">zoom in for more...</li>';
break;
}
}
}
- Does the map viewport contain this data point?
Note Why 19, when we're trying to show 20 markers? Because of the zero-based arrays, remember; when the index m is 19, we actually have 20 elements in the array.
- The
forloop has finished. Did we find any markers within the map viewport?
if (markers.length == 0)
- No. Let the user know with a message in the sidebar.
sidebarContent = '<li style="list-style: none">' +
'No results found in map area. ' +
'Try zooming out or moving the map.</li>';
- No. Let the user know with a message in the sidebar.
- Almost done: all that's left to do is move the new content into the sidebar.
document.getElementById('list').innerHTML = sidebarContent;
Whew! Lots of new concepts! I don't expect that you followed every last detail, but hopefully you have the general idea. And when you've caught your breath enough for a second look, you might find a few items in there that I haven't explained but that are intriguing enough to follow up on your own. The complete mapMoveEnd function, with all the steps just described, can be found in Listing 9-14 a few pages hence. There's one more piece missing, but it's fairly easy: the event handler called by the two click events (on the markers and sidebar list items). They're calling the same handler because we want the same functionality in either case, to show the detail infowindow associated with a particular marker. And here it is:
function showDetail(m)
{
markers[m].openInfoWindow(
'<h4 style="margin: 0; font-size=120%">' + markers[m].data.title + '</h3>' +
'<p style="margin: 0; font-size=90%">' + markers[m].data.details + '</p>'),
};
This is where we make use of the data we attached to each marker (in step 3c). We use the function parameter m as an index into the markers array, and then we build the infowindow's XHTML content based on that data (the title and details for the individual brewery).
One final aspect was omitted from the numbered steps shown earlier, for simplicity. To make the map more usable, I'm going to assign numbered icons to each map marker and correlate them with the sidebar list (which you'll notice was an ol ordered-list element in the XHTML of Listing 9-11). Here's how:
var numberIcon = new GIcon(G_DEFAULT_ICON);
numberIcon.image =
'http://gmaps-samples.googlecode.com/svn/trunk/markers/orange/marker' +
(m + 1) + '.png';
markers[m] = new GMarker(data[d].coords, {icon: numberIcon});
You should recognize the basic code here from the first part of this chapter; it's one of Google's pre-made icon set, in a vaguely beer-colored orange. I use m+1 (rather than m) for the icon number because it's a zero-indexed array, but with just that small tweak the numbers will automatically correspond with the sidebar list.
And with that, we have completed the basic UK Brewery map, as you can see in Figure 9-11. Load your page in a browser and pan and zoom anywhere in Great Britain to see breweries in the area; click on a numbered marker (or a sidebar link) for more details.
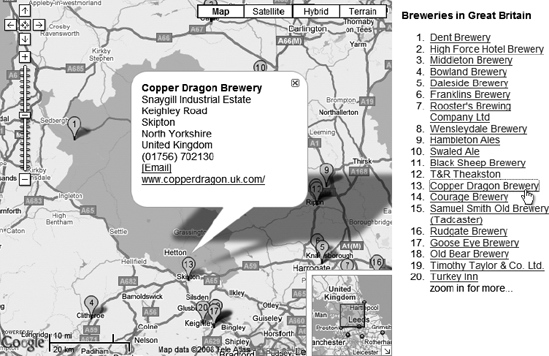
Figure 9-11. The UK Brewery map
Tying Up Loose Ends
It turns out that there's a slight problem with my first-pass implementation. When you open an infowindow, the API automatically pans the map so that the entire infowindow is visible. Unfortunately, this triggers our mapMoveEnd event—and this loads a new set of markers, which may or may not include the marker with the infowindow attached.
It's not actually a terribly hard problem. Listing 9-13 shows the full JavaScript, with the solution highlighted.
Listing 9-13. JavaScript for the UK Brewery Map, with Infowindow Fix
// Declare variables for later use
var map;
var geoXml;
var data = new Array();
var markers = new Array();
var clicked;
var current;
function loadMap()
{
// loadMap: initialize the API and load the map onto the page
// Get the map container div
var mapDiv = document.getElementById('map'),
// Confirm browser compatibility with the Maps API
if (!GBrowserIsCompatible())
{
mapDiv.innerHTML =
'Sorry, your browser isn't compatible with Google Maps.';
}
else
{
// Initialize the core map object
map = new GMap2(mapDiv,
{mapTypes: [G_NORMAL_MAP, G_SATELLITE_MAP, G_HYBRID_MAP, G_PHYSICAL_MAP]});
// Set the starting map viewport
var coordinates = new GLatLng(53.6, −4.3);
map.setCenter(coordinates, 6);
// Add the standard map controls
map.addControl(new GLargeMapControl());
map.addControl(new GScaleControl());
map.addControl(new GOverviewMapControl());
map.addControl(new GMapTypeControl());
// Initialize the KML processor
var url = 'uk_breweries.kml';
var options = {sidebarid: 'list', createmarker: addDataPoint, nozoom: true};
geoXml = new EGeoXml(map, url, options);
// Attach an event handler for after the KML is processed
GEvent.addListener(geoXml, 'parsed', xmlParsed);
// Load the KML
geoXml.parse();
// Attach an event to refresh the marker display whenever the map moves
GEvent.addListener(map, 'moveend', mapMoveEnd);
GEvent.addListener(map, 'infowindowopen', mapInfoWindowOpen);
GEvent.addListener(map, 'infowindowclose', mapInfoWindowClose);
}
};
function addDataPoint(coordinates, name, description)
{
// addDataPoint: save the data for a placemark found by the KML processor
var d = data.length;

data[d] = {coords: coordinates, title: name, details: description};
};
function xmlParsed()
{
// xmlParsed: after KML processing, initialize the marker display
mapMoveEnd();
};
function mapMoveEnd()
{
// mapMoveEnd: refresh the marker display after the map has moved
// Get the map boundary coordinates
var mapBounds = map.getBounds();
// Don't refresh if the currently selected marker is still in view
if (current != null)
{
if (mapBounds.contains(current))
return;
else
map.closeInfoWindow();
}
// Prepare to build new sidebar content by starting with a clean slate
var sidebarContent = '';
// Remove previous set of markers from the map and the array
for (var m = markers.length - 1; m >= 0; m--)

{

  map.removeOverlay(markers[m]);

  markers.splice(m, 1);

}
// Create a base icon
var numberIcon = new GIcon(G_DEFAULT_ICON);
// Look for data in the new map area
for (var d = 0; d < data.length; d++)

{
if (mapBounds.contains(data[d].coords))

  {
// Map does contain this data point; create a marker and add it to the map
m = markers.length;
numberIcon.image =
'http://gmaps-samples.googlecode.com/svn/trunk/markers/orange/marker' +
(m + 1) + '.png';
markers[m] = new GMarker(data[d].coords, {icon: numberIcon});
markers[m].data = data[d];
map.addOverlay(markers[m]);
// Also attach an event handler to show infowindow when marker is clicked
GEvent.addListener(markers[m], 'click',

  new Function('showDetail(' + m + ')'));
// Create sidebar content for this data point, including click event handler
sidebarContent = sidebarContent +

  '<li><a href="#" onclick="showDetail(' + m + '), return false">' +

  data[d].title + '</a></li>';
if (m >= 19)
{
// We've reached 20 markers, so break out of the loop
sidebarContent = sidebarContent +
'<li style="list-style: none">zoom in for more...</li>';
break;
}
}
}
if (markers.length == 0)
// No data points found in map boundaries
sidebarContent = '<li style="list-style: none">No results found in map area. ' +
'Try zooming out or moving the map.</li>';
// Move the new content into the sidebar
document.getElementById('list').innerHTML = sidebarContent;
};
function showDetail(m)
{
// showDetail: open the infowindow for the given map marker
current = clicked = markers[m].data.coords;
markers[m].openInfoWindow(
'<h4 style="margin: 0; font-size=120%">' + markers[m].data.title + '</h3>' +
'<p style="margin: 0; font-size=90%">' + markers[m].data.details + '</p>'),
};
function mapInfoWindowOpen()
{
// mapInfoWindowOpen: set the variable that keeps track of the selected coords
current = clicked;
};
function mapInfoWindowClose()
{
// mapInfoWindowClose: clear the variable that keeps track of the selected coords
current = null;
};
The solution is to keep track of the coordinates for the marker (if any) that currently has the infowindow open. So in the showDetail function, I set two new variables, current and clicked:
current = clicked = markers[m].data.coords;
The first of these is for the coordinates of the current marker, and the second is for the marker that's just been clicked on (the same coordinates at this point in the code).
Then in the mapMoveEnd handler, I add logic to prevent refreshing the marker display if the current coordinates are within the map viewport:
if (current != null)

{

  if (!mapBounds.contains(current))

    return;

  else

    map.closeInfoWindow();

}
Note that if the user has moved the map far enough so that current is no longer in view, I simply close the infowindow and proceed to refresh the marker display.
To finish off the fix, two more tiny event handlers set and clear current when the infowindow opens and closes:
function mapInfoWindowOpen()

{

  current = clicked;

};


function mapInfoWindowClose()

{

  current = null;

};
The clicked variable might seem a bit redundant here (as might the entire infoWindowOpen handler)—why not simply set current in showDetail? The answer is that when we call openInfoWindow in showDetail, the API actually closes any existing infowindow first—immediately triggering mapInfoWindowClose and clearing current. So we need to keep track of clicked separately and use it to reset current when the infowindow reopens.
Mapplet Conversion Revisited: GAsync and
Cross-API Development
It shouldn't surprise you greatly that I'll want to turn such a useful map application into a mapplet as well. And this time I have even higher aspirations: I intend to drive my mapplet from the same JavaScript code as my traditional Maps API implementation, a cross-API solution.
This is easier than you might think; looking at Listing 9-13, there is only one function that doesn't exist in the Mapplets API, getBounds:
function mapMoveEnd()

{

  var mapBounds = map.getBounds();

...
If I were doing a simple mapplet conversion, I'd just rewrite that section of code to use getBoundsAsync, the asynchronous mapplet-compatible equivalent (a la Chapter 6):
function mapMoveEnd()

{

  map.getBoundsAsync(afterGetBounds);

};


function afterGetBounds(mapBounds)

{

...
However, my approach will instead use a different Mapplets API function, GAsync, which will further my cross-API goal because it's also available as an add-on for the Maps API. GAsync can be complicated to explain, but in its most basic form it's really quite simple, and it's best illustrated with an example. It allows us to rewrite the previous mapplet-compatible snippet like this:
function mapMoveEnd()

{

  GAsync(map, 'getBounds', afterGetBounds);

};


function afterGetBounds(mapBounds)

{

...
So rather than calling getBoundsAsync directly, I wrap GAsync around getBounds instead. Internally, GAsync is still calling getBoundsAsync. It works just the same—and Figure 9-12 shows the mapplet in action.
But the beauty of this approach is that when I include the async.js in my XHTML page (back in Listing 9-10), I can use the exact same GAsync code in my Maps API application.

Figure 9-12. The UK Brewery mapplet
What does the mapplet code look like? As you'll see in Listing 9-14, it's remarkably simple, because I'm keeping the vast majority of the functionality in external JavaScript. I've highlighted the only items of note.
Listing 9-14. Specification of the UK Brewery Mapplet
<?xml version="1.0" encoding="UTF-8"?>

<Module>

  <ModulePrefs title="Breweries in Great Britain"

               directory_title="British Breweries"

               description="Map the locations of all breweries in Great Britain."

               author="Sterling Udell"

               author_email="[email protected]"

            screenshot="http://sterlingudell.com/bgmm/chapter_09/brewery_scr.png"

            thumbnail="http://sterlingudell.com/bgmm/chapter_09/brewery_thm.png">

    <Require feature="sharedmap" />

    <Require feature="dynamic-height"/>

  </ModulePrefs>

  <Content type="html"><![CDATA[

    <style type="text/css">

      ul {

        font-size: 90%;

        padding-left: 1em;

      }


      li {

        padding-left: 0em;

      }

    </style>


    <ol id="list"></ol>


    <script type="text/javascript"

        src="http://sterlingudell.com/bgmm/egeoxml.js"></script>

    <script type="text/javascript"

        src="http://sterlingudell.com/bgmm/chapter_09/listing_09_15.js"></script>

    <script type="text/javascript">

      // Initialize the map

      map = new GMap2();


      // Initialize the KML processor

      var url = 'http://sterlingudell.com/bgmm/chapter_09/uk_breweries.kml';

      var options = {sidebarid: 'list', createmarker: addDataPoint, nozoom: true};

      geoXml = new EGeoXml(map, url, options);


      // Attach an event handler for after the KML is processed

      GEvent.addListener(geoXml, 'parsed', xmlParsed);


      // Load the KML

      geoXml.parse();


      // Attach an event to refresh the marker display whenever the map moves

      GEvent.addListener(map, 'moveend',         mapMoveEnd);

      GEvent.addListener(map, 'infowindowopen',  mapInfoWindowOpen);

      GEvent.addListener(map, 'infowindowclose', mapInfoWindowClose);

    </script>

  ]]></Content>

</Module>
First, I'm linking in listing_09_15.js, the same cross-API JavaScript code that the Maps API version is using (referenced in Listing 9-10). And second, I've only had to transfer a few lines of code—for loading and parsing the KML—from my loadMap function into the mapplet's main script element. The rest is still in listing_09_15.js, Listing 9-15.
Note The listing_09_15.js file still contains the original loadMap function that the Maps API implementation uses. When the JavaScript is linked into the mapplet, loadMap is ignored, as the mapplet doesn't need it.
Listing 9-15. The Final, Cross-API Version of the UK Brewery Map JavaScript
// Declare variables for later use

var map;

var geoXml;

var data = new Array();

var markers = new Array();

var clicked;

var current;


function loadMap()

{

  // loadMap: initialize the API and load the map onto the page


  // Get the map container div

  var mapDiv = document.getElementById('map'),


  // Confirm browser compatibility with the Maps API

  if (!GBrowserIsCompatible())

  {

    mapDiv.innerHTML =

      'Sorry, your browser isn't compatible with Google Maps.';

  }

  else

  {

    // Initialize the core map object

    map = new GMap2(mapDiv,

      {mapTypes: [G_NORMAL_MAP, G_SATELLITE_MAP, G_HYBRID_MAP, G_PHYSICAL_MAP]});


    // Set the starting map viewport

    var coordinates = new GLatLng(53.6, −4.3);

    map.setCenter(coordinates, 6);


    // Add the standard map controls

    map.addControl(new GLargeMapControl());

    map.addControl(new GScaleControl());

    map.addControl(new GOverviewMapControl());

    map.addControl(new GMapTypeControl());


    // Initialize the KML processor

    var url = 'uk_breweries.kml';

    var options = {sidebarid: 'list', createmarker: addDataPoint, nozoom: true};

    geoXml = new EGeoXml(map, url, options);


    // Attach an event handler for after the KML is processed

    GEvent.addListener(geoXml, 'parsed', xmlParsed);


    // Load the KML

    geoXml.parse();


    // Attach an event to refresh the marker display whenever the map moves

    GEvent.addListener(map, 'moveend',         mapMoveEnd);

    GEvent.addListener(map, 'infowindowopen',  mapInfoWindowOpen);

    GEvent.addListener(map, 'infowindowclose', mapInfoWindowClose);

  }

};


function addDataPoint(coordinates, name, description)

{

  // addDataPoint: save the data for a placemark found by the KML processor

  var d = data.length;

  data[d] = {coords: coordinates, title: name, details: description};

};


function xmlParsed()

{

  // xmlParsed: after KML processing, initialize the marker display

  mapMoveEnd();

};


function mapMoveEnd()

{

  //  mapMoveEnd: get the new map boundary coordinates for use in marker display

  GAsync(map, 'getBounds', afterGetBounds);

};


function afterGetBounds(mapBounds)

{

  // afterGetBounds: refresh the marker display


  // Don't refresh if the currently selected marker is still in view

  if (current != null)

  {

    if (mapBounds.contains(current))

      return;

    else

      map.closeInfoWindow();

  }


  // Prepare to build new sidebar content by starting with a clean slate

  var sidebarContent = '';


  // Remove previous set of markers from the map and the array

  for (var m = markers.length - 1; m >= 0; m--)

  {

    map.removeOverlay(markers[m]);

    markers.splice(m, 1);

  }


  // Create a base icon

  var numberIcon = new GIcon(G_DEFAULT_ICON);


  // Look for data in the new map area

  for (var d = 0; d < data.length; d++)

  {

    if (mapBounds.contains(data[d].coords))

    {

      // Map does contain this data point; create a marker and add it to the map

      m = markers.length;

      numberIcon.image =

        'http://gmaps-samples.googlecode.com/svn/trunk/markers/orange/marker' +

        (m + 1) + '.png';

      markers[m] = new GMarker(data[d].coords, {icon: numberIcon});

      markers[m].data = data[d];

      map.addOverlay(markers[m]);


      // Also attach an event handler to show infowindow when marker is clicked

      GEvent.addListener(markers[m], 'click',

        new Function('showDetail(' + m + ')'));


      // Create sidebar content for this data point, including click event handler

      sidebarContent = sidebarContent +

        '<li><a href="#" onclick="showDetail(' + m + '), return false">' +

        data[d].title + '</a></li>';


      if (m >= 19)

      {

        // We've reached 20 markers, so break out of the loop

        sidebarContent = sidebarContent +

          '<li style="list-style: none">zoom in for more...</li>';

        break;

      }

    }

  }


  if (markers.length == 0)

    // No data points found in map boundaries

    sidebarContent = '<li style="list-style: none">No results found in map area. ' +

        'Try zooming out or moving the map.</li>';


  // Move the new content into the sidebar

  document.getElementById('list').innerHTML = sidebarContent;

};


function showDetail(m)

{

  // showDetail: open the infowindow for the given map marker

  current = clicked = markers[m].data.coords;

  markers[m].openInfoWindow(

    '<h4 style="margin: 0; font-size=120%">' + markers[m].data.title + '</h3>' +

    '<p style="margin: 0; font-size=90%">' + markers[m].data.details + '</p>'),

};


function mapInfoWindowOpen()

{

  // mapInfoWindowOpen: set the variable that keeps track of the selected coords

  current = clicked;

};


function mapInfoWindowClose()

{

  // mapInfoWindowClose: clear the variable that keeps track of the selected coords

  current = null;

};
Pros and Cons of Dynamic Data Handling
This topic has shown you a useful technique for handling medium to large data sets, in both the Maps and Mapplets APIs, with what's still a relatively small amount of JavaScript. It's not the perfect solution for every geodata-mapping problem, but it should prove useful in your mapping endeavors.
How large a data set will it handle? That's more a function of the physical size of the KML data file. A drawback to any solution that attempts to handle large amounts of data purely in the browser is that by definition, all the data has to be downloaded to the browser. The uk_breweries.kml file is 241 kilobytes, a reasonably quick download for most users. By contrast, the global brewery data file from which it was sourced is 3.8 megabytes, too large for the average web surfer to happily download as part of an ordinary page load. So while the JavaScript will actually handle the 7,500 data points in the global KML, it's not practical to do so.
But to answer the question, this solution will generally work well up to a few thousand data points, assuming that the total file size is reasonable to download. For larger data sets, a server-based solution is usually a better choice, working in conjunction with the map page to filter the data before sending it. We'll look at these in the next couple of chapters.
Another limitation of this solution as it's written is that it always displays the first 20 data points it finds. For the UK brewery data, this works out well at high zoom levels, but less so when you're zoomed out; because the KML has the data points grouped by county, the first twenty are usually from only one or two counties, and they appear in clumps on the map. It would work better if data points that were more important in some way—newer data, perhaps, or highly rated on some scale—appeared earlier in the KML file. That way, the first 20 found in the viewport would also be the most important 20.
Nonetheless, a solution like this is still a vast improvement over trying to place a couple of thousand markers on the map.
Summary
This chapter has pushed your JavaScript skills as far as they'll go in this book (and possibly even a bit farther). I hope you feel it's been worth the effort; you should now be well-equipped for most mapping challenges. You've progressed beyond the beginner level and are ready to produce Google Map integrations that you can be proud of.
You've learned how to customize your marker icons in several different ways, including markers of varying sizes, colors, and with dynamic labels. You might even take a stab at creating icons from scratch.
You should also have more confidence in geocoding results after asking your users for verification. When that data comes back to you as KML, you're ready to customize the display in any way required. And finally, you now have tools at your disposal as well for handling large sets of markers and for efficiently developing applications for both the Maps and Mapplets APIs.
In short, you're finished with the pure API sections of this book. So in the next chapter, we'll explore various strategies for generating the geodata that you've been displaying up until now.