Appendixes
APPENDIX A
Mapping Fundamentals
Not long ago, the specialized skills required to make accurate maps meant that the endeavor was restricted to trained cartographers. With the Google Maps API, you now have that ability yourself, with no more specialized knowledge than keeping your latitude and longitude coordinates straight (and some basic web design, of course). Nonetheless, some additional background on cartographic principles will make you a better map programmer, and that's what you'll find in this appendix.
Most of the information here is indeed to do with latitude and longitude: different formats you might encounter, how precise you need to be, and the relation of the two numbers to each other. You'll also learn about how to calculate distance between two locations using only their coordinates, and finally, I'll present some useful insights into map projections in general and the Mercator projection used by Google Maps in particular.
Latitude and Longitude
We've been using latitude and longitude throughout the book—there's very little that can be done in the Maps API without them—but until now, we haven't really talked much about them. And that's been fine; we haven't really needed to. But there are a couple of pitfalls lurking in this simple pair of numbers that could cause trouble for you, and my first task here is to guard you against them.
Degrees, Minutes, and Seconds
As you know by now, the numbers of latitude and longitude are generally expressed in degrees. This is because they are fundamentally measuring angles on the (roughly) spherical surface of the Earth. For latitude, it's the angle north of the equator; hence south latitudes are negative, and the North Pole has a latitude of 90°, "straight up" from the equator's "horizontal." Similarly, as the east-west circumference of the Earth measures 360°, longitude represents angles within that range. From an arbitrary zero line called the prime meridian, the angles run west to −180° and east to 180°, where they meet (in the mid-Pacific).
Following Google Maps' lead, we've been expressing these latitude and longitude angles in a format called decimal degrees: each number simply includes a few decimal places to specify partial degrees. However, there is an alternative method of expressing fractional degrees: each degree can be broken up into sixty minutes, with each minute further divided into sixty seconds. It's as if a degree was an hour of time. This approach is generally just called DMS, for Degrees/Minutes/Seconds.
Long before Google Maps hit the mainstream, DMS was the common format for expressing coordinates, and you still find it in use today. It's the default display setting on many GPS receivers, some paper maps show coordinates in this fashion, and certain organizations use it as their standard. Google never uses minutes or seconds, but as an API developer you may need to be aware that they exist, because you'll sometimes find coordinates in this format—from an external source, or a legacy database perhaps—and they cannot be plotted directly onto an API map.
Recognizing Minutes and Seconds
The first hurdle is recognizing when coordinates need conversion, and it's sometimes harder than you'd think. The easiest case is when the units are explicitly given, perhaps in separate database columns or labeled in text:
North 43 degrees, 28 minutes 3 seconds

West 103 degrees, 51 minutes, 27 seconds
It's also common to see quotation marks used as symbols, with single quotes (') for minutes and double quotes (") for seconds:
43° 28' 3" N

103° 51' 27" W
So quotes are a dead giveaway for DMS. But occasionally, you will just see bare numbers separated by spaces:
43 28 3 N

103 51 27 W
When greater precision is required, you will see decimal numbers on the seconds:
43 28 3.2

−103 51 26.9
Remember that negative longitudes are (almost) always west.
And finally, you will occasionally come across degrees plus decimal minutes:
43 28.053

−103 51.450
What do all of these possibilities have in common? In all cases, there are a couple of important clues that you're dealing with DMS, rather than decimal degrees.
- Each ordinate has a several distinct numbers, not just a single decimal number.
- Minutes and seconds, the second and third distinct numbers, are never greater than 60.
And finally, if you're plotting coordinates on a Google map and they're always coming out just a bit off, be suspicious: minutes and seconds may be your problem.
Converting to and from Decimal Degrees
Once you have established that coordinates are in DMS format, you need to convert them to decimal degrees before using them with the Maps and Mapplets APIs. It's actually quite easy, and in Listing A-1, you'll find a couple of JavaScript functions to do it.
Listing A-1. DMS Conversion Functions
function dms2decimal(deg, min, sec)nn

{

  // dms2dd: converts degree/minutes/seconds to decimal degrees

  if (sec == null)

    sec = 0;

  return deg + (min / 60) + (sec / 3600);

};


function decimal2dms(degrees)

{

  // dd2dms: converts decimal degrees to degree/minutes/seconds

  var minutes = (Math.abs(degrees) - Math.floor(Math.abs(degrees))) * 60;

  var seconds = new Number(((minutes - Math.floor(minutes)) * 60).toFixed(2));

  var minutes = Math.floor(minutes);

  var degrees = Math.floor(degrees);

  return {deg: degrees, min: minutes, sec: seconds};

};
The first function, dms2decimal, is the one you'll use more often. It converts DMS to decimal degrees, ready for use in any Google mapping API:
var latitude  = dms2decimal(43, 28, 3.2);

var longitude = dms2decimal(−103, 51, 26.9);

var coordinates = new GLatLng(latitude, longitude);
Note that the min and sec parameters can be decimal numbers themselves; if you have decimal minutes and not seconds, you can safely leave sec out.
The second function, decimal2dms, is for use if you need to convert API-standard decimal degrees to DMS. It returns a bit of JSON with the three components, used as shown here:
var dms = decimal2dms(coordinates.lat());

alert('Latitude is ' + dms.deg + ' degrees, ' + dms.min + ' minutes, ' +

      dms.sec + ' seconds'),
So you simply use the deg, min, and sec properties of the returned value for the three DMS components.
Tip A quick and easy way to convert a single DMS coordinate is by using Google Maps itself. Simply paste virtually any DMS format (such as 43 28 3, −103 51 27) into the Search Maps box at maps.google.com, and a map marker will be shown at the correct location, with the decimal degrees in an infowindow.
Other Coordinate Systems
Throughout the world and over the centuries, many different coordinate systems have been used to express location. You might encounter one of these when working with data predating the GPS era; others are still in use in particular areas of the world, such as Britain's National Grid. It's beyond the scope of this book to cover them all in detail, especially since most are far more involved than the simple decimal-DMS conversions you've just seen. If you come across a different format or grid system, you will need to track down conversion routines yourself. Either a Google search or a query on the Maps API discussion group (see Appendix D) is a good place to start.
For reference, Google Maps latitude and longitude use a standard (called a map datum) known as WGS84, also the most commonly used by consumer GPS receivers.
Coordinate Precision
The other major numeric trap awaiting the unwary map programmer involves coordinate precision—essentially, how many decimal places to use with your latitudes and longitudes. Precision in coordinates directly translates to precision in mapping; more decimal places on your latitude and longitude means more exact placement on the map, and by extension, on the surface of the Earth.
Table A-1 illustrates this relationship, showing the accuracy of increasing decimal places at 40° latitude. These numbers are interesting from two directions, at both extremes.
Table A-1. Coordinate Accuracy at 40° Latitude
| Decimal Places | Example | East/West Accuracy | North/South Accuracy |
| 0 | 40° |
44 miles | 69 miles |
| 1 | 40.1° |
4.4 miles | 6.9 miles |
| 2 | 40.12° |
0.44 miles | 0.69 miles |
| 3 | 40.123° |
235 feet | 364 feet |
| 4 | 40.1234° |
23 feet | 36 feet |
| 5 | 40.12345° |
2.3 feet | 3.6 feet |
| 6 | 40.123456° |
2.8 inches | 4.4 inches |
| 7 | 40.1234567° |
0.3 inches | 0.4 inches |
Note East/west accuracy varies based on the exact latitude in question; this will be covered in more detail in a few pages, when I discuss map projections. The 40° values in Table A-1 are reasonable for middle latitudes, like those found in the continental USA.
First, it's important to have sufficient precision for the mapping task at hand. If you are giving the location of a specific address on a street, for example, a precision of one or two decimal places isn't really sufficient, but four probably is.
Second, it's all too easy to use excessive precision, which is useless at best and misleading at worst. Google maps clearly don't have sub-inch resolution, so anything more than six decimal places would be wasted. Even six is a bit much for most applications; consumer GPS receivers rarely have an accuracy better than ten or twenty feet, so for any coordinates relating to GPS, decimal places beyond five are meaningless.
And at worst, they are misleading. I once had a map-programming job where the client supplied coordinates for his customers and suppliers; my tasks included showing the existing customers on a map, and a system for geocoding the addresses of new customers. One day the client got it in his head to geocode one of his older customers—and immediately began complaining to me that the geocoder was broken, because it gave "entirely different coordinates" for the existing customers. The problem? The underlying software he was using showed the coordinates to eight decimal places, and after new geocoding, the last half of those decimal places were indeed "entirely different". So to the client, the latitude and longitude were "obviously" wrong, even though the marker hadn't visibly moved on the map.
As a rule, five (or maybe six) decimal places is a good target, neither insufficient nor excessive for most applications.
Avoiding Precision Problems
With one notable exception (covered in the next section), modern programming languages like JavaScript always have sufficient precision for good mapping. So as a developer, your major concern here should be avoiding excessive precision. For our purposes, there are two primary tools to use.
The first is native to JavaScript; all numbers have a built-in function, toFixed, that converts them to strings with the given precision. Here's an example of toFixed in use:
var latitude = coordinates.lat();

alert('Latitude is ' + latitude.toFixed(5));
It's as easy as that; always using toFixed for your latitudes and longitudes should ensure that your users see just the right amount of precision. For an example of this technique in action, see Listing 8-9.
The second tool is built into Google's mapping APIs: toUrlValue, a function of the GLatLng object. This function accepts an optional precision parameter (which defaults to 6 if left out), and simply creates a string containing the coordinates, separated by commas and formatted with the given precision. So for example, the following code:
var coordinates = marker.getpoint();

alert(coordinates.toUrlValue(3));
would produce a message like this:
43.468,−103.858
As its name implies, toUrlValue was originally intended for adding coordinates as parameters to a URL, but it's handy whenever you need both latitude and longitude together. An example of such a usage can be found in Listing 5-7.
SQL Data Types
As mentioned, JavaScript and PHP always give you plenty of precision for good coordinate calculations, but with SQL, precision is an option. SQL allows several storage possibilities for decimal numbers, each with strengths and weaknesses for coordinate values. If you need to create geospatial databases, read on for full coverage; if not, feel free to skip to the next section.
The basic issue is precision versus storage space. It's certainly possible to always get plenty of precision from SQL, but for a large geodata table with millions of rows, conserving storage may be an issue. Table A-2 details the principal options for MySQL; other database systems are similar.
Table A-2. MySQL numeric types
| Type | Coordinate Precision | Bytes per Field |
FLOAT |
3 decimal places | 4 |
DOUBLE |
12 decimal places | 8 |
DECIMAL(9,6) |
6 decimal places | 11 |
As you can see, the DECIMAL type—good for fixed-precision values, like currency—isn't the most efficient choice for coordinates. You get more precision in fewer bytes with DOUBLE, and if the last digit isn't necessarily exact (the bugbear of floating-point storage), the four-millionths of an inch involved doesn't exactly matter.
The only real advantage of DECIMAL is that, with the precision specified in the database structure, you may be able to avoid formatting the results in JavaScript (as described in the previous section).
Finally, if your coordinates only need accuracy within a few hundred feet (see Table A-1) and space is at a premium, FLOAT is probably an even better option for you. But don't do this unless it's genuinely necessary; if the database truncates valid digits from your coordinates, that precision is gone forever.
Calculating Distance
Now that your latitudes and longitudes are in good shape, a common requirement is to calculate the distance between the coordinates of two points. On the curved surface of the Earth, such a calculation isn't trivial, but it's not insurmountable either.
If you have the two points in JavaScript, your easiest option is to let Google's API do the heavy lifting for you. The GLatLng object has a built-in function, distanceFrom, to calculate its distance (in meters) from another GLatLng. Here's how it's used:
var coordinates1 = new GLatLng(43.489532, −80.489487);

var coordinates2 = new GLatLng(43.487788, −80.498650);

var distance = coordinates1.distanceFrom(coordinates2);

alert('Distance is ' + distance.toFixed(0) + ' meters'),
In this example, the result (displayed by the alert) will be "Distance is 765 meters." Note that again, I'm avoiding excessive precision by applying toFixed, rounding the displayed result to the nearest meter.
If you're not in JavaScript, you have to do the calculation yourself, and the best technique to use is generally one called the spherical law of cosines. I'm not going into the mathematical derivation of this formula, of course, but I will show you how to use it. 1 In fact, if you're working in SQL, I already have; this is the formula that was introduced in Listing 10-10.
The other programming language used in this book is PHP, and in Listing A-2 you can find an implementation of this distance formula. It shows a calculation using URL parameters, but of course the same technique will work wherever the numbers have come from.
Listing A-2. Distance Calculation in PHP
<?php

  $lat1 = $_GET['lat1'];

  $lon1 = $_GET['lon1'];

  $lat2 = $_GET['lat2'];

  $lon2 = $_GET['lon2'];


  $distance = (6371008 * acos(cos(deg2rad($lat1)) * cos(deg2rad($lat2)) *

                              cos(deg2rad($lon2) - deg2rad($lon1)) +

                              sin(deg2rad($lat1)) * sin(deg2rad($lat2))));


  echo 'Distance is '.round($distance).' meters, '.

       round($distance / 1609, 3).' miles.';

?>
Note that both of the code samples in this section give the distance in meters, and Listing 10-10 in kilometers. For other units of measurement, simply apply the correct conversion factor. For example, for distance in miles, divide meters by 1609 (as shown in Listing A-2); for feet, multiply meters by 3.281; and for kilometers, divide by 1000.
Map Projections
We frequently talk about latitude and longitude as if they were a grid overlaid on the Earth's surface, and when discussing the coordinate system, that's quite convenient. But the reality is that they're not a grid: neither latitude nor longitude lines are parallel (as we generally understand the term 2), and in fact all lines of longitude meet at both the North and South Poles. So, any talk of a latitude/longitude grid is fundamentally flawed—yet when working with maps, we continue to use the term.
The basic issue is that the Earth is round, and the conceptual lines of latitude and longitude represent angles (on that round surface) from agreed-upon starting points. Figure A-1 shows the general idea, with latitude and longitude lines drawn every twenty degrees on the globe. Note how the north-south longitude lines converge at the poles, while the east-west latitude lines remain separate from one another.
__________
1. For background on the spherical law of cosines for distance calculations, I recommend http://www.movable-type.co.uk/scripts/latlong.html, where you'll also find formulae for other map-related computations.
2. Lines of latitude do describe parallel planes in three-dimensional space, and in fact are sometimes even called parallels (as in "the 49th Parallel"). On the Earth's surface, however, latitudes are actually large circles, not parallel grid lines.
Note This convergence of longitude lines is why longitude precision improves as you approach the poles, as mentioned earlier in the appendix.
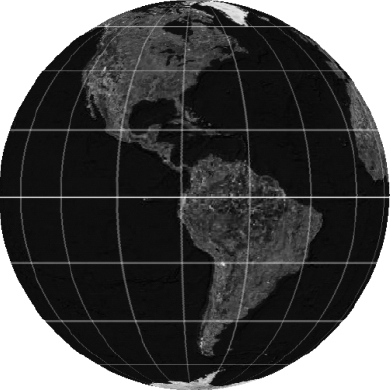
Figure A-1. Latitude and longitude lines on the spherical Earth
Of course, maps are flat, so a basic challenge of mapping is making the transition from the spherical Earth. It's done by a technique called projection, which is basically a consistent set of rules determining where every point on Earth will be represented on the flat map.
One of the simplest map projections, called equirectangular, has a rule that goes like this: Assume that latitude and longitude really do form a regular grid, and draw the Earth on that basis. The resulting map is shown in Figure A-2; it's twice as wide as it is tall, reflecting 360° of longitude by 180° of latitude, with the lines again drawn every 20°.
But like all map projections, the equirectangular Figure A-2 involves distortion. Here it's most obvious at the poles: the North Pole, for example, is a single point on the Earth's surface, but in Figure A-2 it occupies the entire top edge of the map. The same distortion exists at all high latitudes; notice how all the islands in northern Canada are horizontally elongated? They're not like that in reality. If you were to zoom in to the far northern or southern regions of an equirectangular projection, you'd find this distortion makes the map all but useless in those areas.
Over the years, cartographers have devised literally hundreds of different map projections, but they all distort sizes, shapes, distances, or directions in some area of the globe. As a newlyminted map programmer, it's important that you have some understanding of this issue: flat maps never represent the Earth perfectly. Google Maps are no exception, so to finish off this appendix, I'm going to acquaint you with the strengths and weaknesses of the map projection that Google uses.

Figure A-2. Equirectangular map projection, with the latitude/longitude lines forming a grid
The Mercator Projection
Google Maps may be only a few years old, but the map projection it uses goes back centuries. It was created in 1569 by a Flemish cartographer named Gerardus Mercator, and it became a standard for maritime use because compass angles can be measured directly from straight lines on the map. This is very handy for navigation, and Mercator's is one of the few global map projections with which it is possible to do so. Figure A-3 shows a typical Mercator projection.
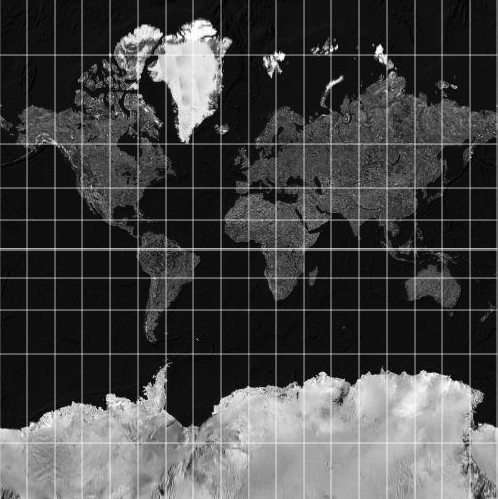
Figure A-3. Mercator projection, also with latitude/longitude lines every 20°
In recent decades, however, the Mercator projection had largely fallen out of favor because of a major drawback: the further you get from the equator (the thicker horizontal line in the middle of Figure A-3), the more regions become magnified. This is apparent if you examine the grid; the longitude lines (which converge at the poles in reality) remain parallel, while the latitude lines get progressively further apart (they're really equidistant, remember). For a real-world effect of this magnification consider that, in reality, Africa is roughly 14 times the size of Greenland, while on a Mercator map they appear roughly equal.
However, the high-latitude distortion isn't generally as extreme as with the equirectangular projection of Figure A-2, and is only visible over large latitude ranges. What this means in practice is that, as you zoom in to a Mercator-projected Google map, the distortions largely disappear, and the map view accurately reflects the surroundings that users experience around them. It also means that higher-zoom views can be overlaid seamlessly with undistorted aerial photographs anywhere in the world, from equatorial Sri Lanka to arctic Svalbard.
One other problem with all Mercator maps is that, because the latitude lines get progressively further apart, it's mathematically impossible to map all the way to the North and South Poles. And in reality, several degrees of the high arctic (and antarctic) regions are impractical to show on a Mercator map. But again, Google is not overly concerned with this problem, as there's essentially no population in these very high latitudes.
And for a web architecture, the Mercator map has a couple of advantages for Google. First, it's a rectangular projection, and this lends itself well to being constructed from rectangular XHTML img elements (see sidebar). And second, the math involved in the Mercator projection is reasonably simple. This is important because virtually all conversions between screen pixels and map coordinates are done using JavaScript in the browser, which isn't a very powerful computing platform.
GOOGLE MAP TILES
Google's take on the Mercator projection is a square map, cut into an array of 256-pixel square tiles, each of which is displayed on-screen in its own img element. Each successively-higher zoom level contains four times as many tiles as the level before it; each tile at a given zoom level is made up of four tiles at the next. For example, here's what the first two zoom levels look like. At zoom level 0, we have 1 tile:

At zoom level 1, we have four tiles:

Programmatically, this square arrangement is very convenient in a number of ways, from calculating pixel coordinates within the tile array to the naming convention of the tile images themselves.
All of this comes together to make the Mercator projection quite convenient to work with. As a Google map programmer, however, you should be aware of the drawbacks. They're all to do with the high-latitude magnification effect; the following list sums up the major practical implications:
- Google maps are completely unusable for the North and South Poles, as they do not show any latitudes above about 85°.
- The scale of a Google map is not fixed for a given zoom level, but is larger at higher latitudes (further from the equator).
GScaleControlaccounts for this, and as you move a map north and south, you can actually watch it change size. - As a result, distances on a Google map are not constant when moving the map north or south.
- At low zoom levels, the size discrepancy between high and low latitudes is extreme. Think of the Africa-Greenland contrast! So comparative areas on the map will be misleading below about zoom level 4. As an additional illustration, Figure A-4 shows two 1000-mile-diameter circles, with one centered on the equator and the other at 75° north.

Figure A-4. Thousand-mile circles at both low and high latitudes, showing the magnification effect of Mercator projection
Summary
Although Google's mapping APIs insulate you from most cartographic technicalities, it is still beneficial to understand a few basic mapping principles. Being able to recognize and convert DMS-formatted coordinates will save you from puzzling inaccuracies in plotting. Avoiding excessive precision in coordinate displays should prevent some confusion for both you and your users. And being able to calculate distances between any two coordinates will definitely come in handy.
Finally, you now have a basic understanding of map projections, and especially the Mercator system used by Google Maps. As a result, you should know when to watch out for distortions of size and distance on all your maps.
Armed with all this knowledge, you can avoid several basic traps that commonly befall fledgling map programmers.