
Bead array technologies for genetic disease screening and microbial detection
S.A. Dunbar and S.V. Angeloni, Luminex Corporation, USA
Abstract:
In recent decades rapid development and utilization of whole genome assay technologies has produced a vast amount of information on the gene expression patterns and genomic sequences of a number of different organisms. However, once a whole genome assay is used to identify key markers, faster and more cost-effective methods are more practical for the analysis of larger numbers of samples. Midplex or mid-density arrays provide a pragmatic solution for high-throughput analysis of hundreds to thousands of samples where only dozens to a few hundred markers need to be followed. This chapter describes several mid-density multiplex bead array technology platforms and reviews their applications in the study of genomics and infectious diseases.
Key words
bead array; multiplex; nucleic acid detection; gene expression; geno typing
4.1 Introduction
In the last 20 years the rapid development and utilization of whole genome assay technologies has produced a vast amount of information on the gene expression patterns and genomic sequences of a number of different organisms. In human biomedical research, these high-density assays have allowed us to collect an enormous amount of data that has helped us better understand the role of changes in gene expression patterns in the development of or resistance to infectious and non-infectious diseases. This information has also allowed us to identify the role of genetic variations such as single nucleotide polymorphisms (SNPs) and gene copy number variations (CNV), as well as insertions and deletions (indel) in organismal evolution and the development of or resistance to different diseases. The development of these high-density arrays allows the collection of thousands to millions of data points from one sample in one reaction. In the field of infectious diseases, these technology advancements have allowed us to unravel the genetic characteristics of many pathogens and better understand host-pathogen interactions in the process of infectious disease development. This information, combined with the advances in molecular and genetic assay technologies, has also provided better detection methods for identifying natural or manmade variants that may be responsible for different infectious disease outbreaks.
While the development of these assays was dependent on the accumulation of sequence information from many different organisms, for some applications, the development of next generation sequencing (NGS) technologies is quickly evolving to replace many of the conventional slide-based fluorescent imaging array technologies for whole genome applications. As the price of NGS technologies decreases, it seems like an attractive option to use NGS assays on larger numbers of samples to further study biological processes in organisms of interest. For some biological studies or in diagnostics, where a small number of samples is sufficient for analysis, continued use of high-density assay platforms should not be a burden. However, in situations where hundreds or thousands of samples need to be analyzed and where a few dozen to a few hundred markers are consistently followed, lower-density midplex assay platforms with higher sample throughputs are more practical. In this chapter we review several midplex nucleic acid array platforms employing different bead substrates, describe the various assay chemistries and instrumentation used with each and highlight some of their applications in the study of genomics and infectious diseases.
4.2 Luminex® xMAP® Technology
4.2.1 Technology
The Luminex® xMAP® Technology platform was the first commercial bead-based array platform to use differentially dyed microspheres of uniform size to achieve multi-analyte profiling for proteins and nucleic acids. Key drivers for adoption of the xMAP platform include cost savings, labor and workflow efficiencies, sample conservation, high sensitivity and broad dynamic range (Nolan and Sklar, 2002; Kellar, 2003). The system has the added benefit of being an open platform in that assays comprised of targets of interest can be rapidly developed, optimized and implemented by the end user. The versatility of this open architecture is evidenced by approximately 19 000 peer-reviewed publications describing a wide variety of applications (Luminex Corporation, 2014). As a result, the platform has been adopted for nucleic acid and protein analyses in various laboratory settings, and, further, the Luminex® 200™ system has achieved a 510(k) clearance status for in vitro diagnostic (IVD) applications. The scope of applications on the platform includes hundreds of commercially available analytes and numerous end user assays developed for a global install base of more than 10 000 instruments.
The Luminex xMAP system incorporates polystyrene microspheres (beads) that are internally dyed with two or three spectrally distinct fluorochromes. Using precise quantities of each of these fluorochromes, an array is created consisting of different bead sets with specific spectral addresses where the unique spectral characteristics within individual bead sets allow each bead set to be differentiated from all others in the multiplex. Each bead set can possess a different reactant on its surface, and, because bead sets can be distinguished by their spectral addressesand each address is associated with a specific marker, they can be combined in a single reaction to measure up to 500 different analytes simultaneously. An additional fluorochrome coupled to a reporter molecule quantifies the biomolecular interaction that has occurred at the bead surface. For the xMAP nucleic acid assay, specific capture oligonucleotides are covalently coupled to the surfaces of the internally dyed bead sets and the coupled microspheres are combined in a suspension array. After completion of assay incubations with a nucleic acid sample and a reporter reagent, the reactions are analyzed within a Luminex reader, classifying the beads based on the spectral address or bead identity (region) and quantifying the bound fluorophore in the reporter detection channel. The potential for simultaneous detection of 1–500 protein or nucleic acid targets provides for rapid, sensitive and specific multiplexed molecular analyses.
The earliest xMAP microspheres utilized two internal fluorescent dyes to produce a 100-membered array of spectrally distinct bead sets. Inclusion of a third internal dye has allowed the expansion from 100 to 500 bead regions. Several varieties of fluorescent bead reagents are available from Luminex for use in nucleic acid assays (Luminex Corporation, 2012a). The fundamental MicroPlex® Microspheres are 5.6 μm polystyrene beads functionalized with surface carboxyl groups for covalent attachment of capture ligands. Most of the currently available xMAP assays were developed on MicroPlex Microspheres. MagPlex® Microspheres are 6.5 μm superparamagnetic beads functionalized with surface carboxyl groups for covalent attachment of ligands. MagPlex Microspheres exhibit both high performance and low non-specific binding, and they can be magnetically separated from solution, allowing easy automation of assay processes and simplifying assay wash steps. Microsphere reagents pre-coupled with unique capture oligonucleotides (oligos) are also available for nucleic acid assay development. These reagents incorporate the use of xTAG® Technology, a proprietary universal tag sorting system that allows easy optimization, development and expansion of molecular assays and eliminates the need to couple content-specific capture probes to the beads. xTAG oligos are optimized to be an isothermal set and have minimal cross-reactivity. Earlier assays used MicroPlex-TAG™ Microspheres, which are non-magnetic MicroPlex beads, containing two internal fluorescent dyes and pre-coupled with xTAG oligo capture sequences (anti-TAGs). These beads have been replaced with MagPlex-TAG™ Microspheres, which are superparamagnetic MagPlex beads, containing two or three internal fluorescent dyes and pre-coupled with anti-TAG capture oligos.
4.2.2 Chemistries
xMAP Technology provides a flexible, open platform whereby users can easily develop their own custom assays. Various assay chemistries and assay development techniques have been used for nucleic acid detection on the xMAP Technology platform. Detailed sample protocols and recommendations to guide the userthrough the assay development process are available as downloads from the Luminex website (Luminex Corporation, 2012b). In addition, assay development training is available from Luminex and custom assay development services are also available from Luminex and its partners.
Selection of assay chemistry will determine whether microspheres must be coupled with unique capture sequences or whether MagPlex-TAG Microspheres pre-coupled with universal anti-TAG capture oligos can be used. For direct hybridization assays which require custom oligo coupling, capture oligos are modified with a spacer and terminal amine (e.g. 5′-Amino-Modifier C12) and covalently coupled to carboxylated beads using a carbodiimide coupling procedure (Luminex Corporation, 2007a; Luminex Corporation, 2007b). Capture oligos should be resuspended and diluted in dH2O, as Tris, azide or other amine-containing buffers can interfere in the coupling process. Stock uncoupled carboxylated beads are washed and resuspended in 100 mM 2-[N-morpholino] ethanesulfonic acid (MES), pH 4.5. The capture oligo is added, followed by addition of N-(3-Dimethylaminopropyl)-N′-ethylcarbodiimide (EDC) and incubation in the dark for 30 min. The EDC addition and incubation are repeated and then the coupled beads are washed once with 0.02% Tween-20 and once with 0.1% sodium dodecyl sulfate (SDS). Coupled microspheres are stored in 10 mM Tris-HCl, 1 mM ethylenediaminetetraacetic acid (EDTA), pH 8.0 (TE) at 2–8 °C in the dark. When properly stored, coupled microspheres are usually stable for more than one year (Luminex Corporation, 2007c). Coupling reactions can be easily scaled up or down according to user needs (Luminex Corporation, 2007d). Initial coupling and optimization of coupling amount (i.e. nmol oligo per million microspheres) are usually done in small coupling reactions of 2.5–5 million microspheres. Coupling reactions can then be scaled up for manufacturing and preparation of bulk reagents. For optimal coupling efficiency, it is important to perform oligo coupling reactions in as small a reaction volume as possible, typically 25–100 μl for 2.5–100 million beads.
Verification of coupling can be performed using a biotinylated reverse complementary positive control oligo (Luminex Corporation, 2007e). Coupled microspheres are resuspended by vortex and sonication and combined to a final concentration of 100–150 beads of each set/μl in hybridization buffer. Target biotinylated oligos are added (5–200 fmol) and hybridized to the coupled beads for 15 min, followed by labeling with streptavidin-R-phycoerythrin reporter (SAPE) for 5 min. The reactions are then ready for analysis. Effective coupling is demonstrated by a dose-response increase in median fluorescent intensity (MFI) with increasing concentration of oligo target (Luminex Corporation, 2007f).
Direct hybridization of a labeled polymerase chain reaction (PCR)-amplified target DNA to bead sets bearing oligonucleotide capture probes specific for each sequence is the simplest assay chemistry that can provide single nucleotide discrimination (Fig. 4.1). Direct hybridization benefits from the fact that the melting temperature for hybridization of a perfectly matched template comparedwith one with a single base mismatch can differ by several degrees (Ikuta et al., 1987) and mismatches in shorter sequences promote higher levels of destabilization on the duplex (Livshits and Mirzabekov, 1996). Design of sequence-specific capture probes for a direct hybridization assay on the xMAP suspension array can be simplified through the use of a tetramethylammonium chloride (TMAC)-containing hybridization buffer. TMAC stabilizes AT base pairs (bp), minimizing the effect of base composition on hybridization (Wood et al., 1985; Jacobs et al., 1988). Hybridization buffers incorporating TMAC equalize the melting points of different probes, allowing probes with different characteristics to be used under identical conditions with high duplex yields (Maskos and Southern, 1992; Maskos and Southern, 1993). Typically, for single nucleotide discrimination, capture probes are designed to be matched in length at approximately 20 nucleotides. The probes are complementary in sequence to the labeled strand of the PCR product and the polymorphic nucleotide is located at the center of the probe, as mismatches in the center have a more profound effect on the equilibrium state than mismatches near the 5′ or 3′ end (Gotoh et al., 1995; Luminex Corporation, 2007g).

Optimal assay conditions are determined by evaluating the effect of hybridization temperature, probe length and input target concentration on assay sensitivity and specificity. The probe melting temperature is influenced by length, sequence, type and position of the mismatched base. The effect of a mismatch on hybridization is greater with increasing temperature and decreasing probe length (Armstrong et al., 2000). Accordingly, discrimination can be improved by increasing the hybridization temperature and/or decreasing the probe length. After testing known DNA samples under a set of standard hybridization conditions, nucleotides are added to the 5′ and/or 3′ ends of the probe to improve sensitivity or removed from the 5′ and/or 3′ ends of the probe to increase specificity. The position of the polymorphism within the probe sequence can be adjusted when necessary to avoid formation of secondary structures, and adequate specificity can usually be achieved when the polymorphic nucleotide is between positions 8 and 14 of a 20-nucleotide probe (Luminex Corporation, 2007h).
PCR primers are typically designed to amplify 100–300 bp regions of target sequence with one primer of each pair biotinylated at the 5′ end for labeling the target strand of the amplicon. Using a small target DNA minimizes the potential for steric hindrance to affect hybridization efficiency. In some cases, larger targets have been used successfully, suggesting that hybridization efficiency is also dependent on the sequence and overall secondary structure of target (Diaz and Fell, 2004; Spiro et al., 2000). Hybridization kinetics and thermodynamic affinities of matched and mismatched sequences can be driven in a concentration-dependent manner (Wetmur, 1991). At concentrations beyond the saturation level, the hybridization efficiency can decrease, presumably due to competition of the complementary strand and renaturation of the PCR product (Armstrong et al., 2000). Consequently, it is also important to determine the range of target concentrations that yield efficient hybridization without sacrificing discrimination.
Another approach is to use a sequence-specific enzymatic reaction in solution to determine the target sequence followed by capture onto the bead surface for detection (Fig. 4.2). This format involves the incorporation of a specific capture sequence during the enzymatic step that allows hybridization to a complementary ‘address’ sequence on the bead surface. Commonly used enzymatic methods for sequence determination rely on the discriminating ability of DNA polymerases and DNA ligases, and include allele-specific or target-specific primer extension (ASPE or TSPE) (Ugozzoli et al., 1992), oligonucleotide ligation assay (OLA) (Landegren et al., 1988), single base (chain) extension (SBCE/SBE) (Syvanen et al., 1990) and target-specific PCR (TS-PCR). This approach takes advantage of solution-phase kinetics and permits the addressed bead sets to be used in many different assays where new sequences can be targeted by adding the appropriate capture sequence to the target-specific oligo used in the enzymatic step. Hybridization buffer and reaction conditions for detection are dependent upon the capture sequences attached to the microspheres. Commercially available Luminex MagPlex-TAG Microspheres, pre-coupled with xTAG capture oligos (anti-TAGs), are compatible with solution-based enzymatic chemistries. The assay developer adds an appropriate complementary TAG sequence to the 5′ end of each target-specific oligo to allow hybridization to the corresponding anti-TAG coupled to the bead.

Assay development parameters for enzymatic solution-based nucleic acid assays on the xMAP platform have been described (Taylor et al., 2001; Ye et al., 2001; Luminex Corporation, 2010) and various procedures are illustrated in Fig. 4.3. Briefly, target-specific oligos are designed to be matched in meltingtemperature at 51–56 °C. For ASPE/TSPE, TS-PCR and OLA, the discriminating nucleotide is positioned at the 3′ end of the oligo, whereas for SBCE the 3′ end of the oligo is positioned one nucleotide upstream of the discriminating nucleotide. The unique capture sequence for each target is incorporated at the 5′ end of the oligo. Optimization, when needed to improve sensitivity or specificity, can be achieved by adding or removing nucleotides from the 5′ end of the target-specific sequence (immediately downstream from the capture sequence) or by targeting the opposite DNA strand.
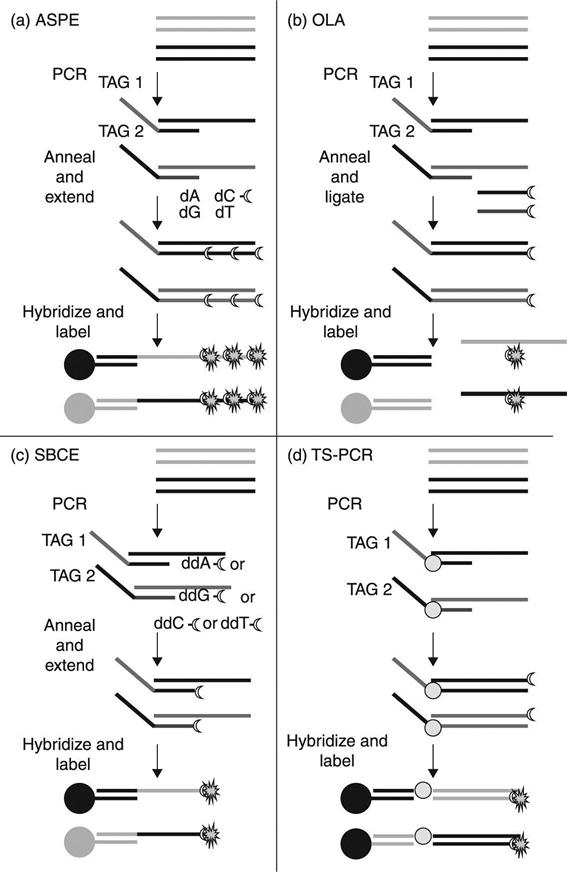
Templates containing the target sequences for the ASPE/TSPE, OLA and SBCE reactions are generated by PCR using unlabeled primers. In ASPE/TSPE, a thermostable polymerase is used to extend the primer by incorporation of dNTPs, including one which is biotin-labeled. Extension only occurs if the 3′ nucleotide of the primer is complementary and can anneal to the template DNA. OLA employs the same oligo design, but a thermostable ligase is used to ligate a biotin-labeled oligo (reporter probe) that is complementary to the sequence downstream from the target nucleotide. The reporter probe is designed to be matched in melting temperature at 51–56 °C, is phosphorylated at the 5′ end to provide a substrate for ligase and is biotin-labeled at the 3′ end for fluorescence detection with SAPE. For SBCE, individual reactions must be set up for each of the four possible nucleotides and a thermostable polymerase is used to incorporate a single biotin-labeled ddNTP. Extension occurs only if the nucleotide complementary to the sequence immediately downstream of the primer is present in the reaction. Targets for SBCE can be combined for each of the nucleotide reactions, and, if different capture sequences are used for each, the products can be multiplexed for capture onto the addressed microsphere sets. For TS-PCR, target sequences are directly amplified and labeled by PCR using one primer containing both capture and target-specific sequences paired with a biotinylated target-specific primer. This method requires a strategy that minimizes or eliminates production of the capture sequence in the non-target strand, which would compete for hybridization of the target to the addressed bead. Some methods include asymmetric PCR, post-PCR treatment with phosphatase and exonuclease or incorporating a spacer between the capture-specific and target-specific sequences of the primer (Luminex Corporation, 2010). TS-PCR chemistry eliminates the need for separate amplification and target-specific enzymatic steps, thus simplifying the assay procedure and reducing reagent costs and turnaround time.
Several variations of the OLA or ligation-dependent assay (LDA) chemistries have been developed for the xMAP platform. LDAs were first described by Landegren et al. in 1988 and further developed at the Broad Institute for whole genome transcription profiling (Peck et al., 2006). Similar applications referred to as multiplex digonucleotide ligation-PCR (MOL-PCR) and multiplex ligation-dependent probe amplification (MLPA) have also been applied to xMAP and other bead-based array platforms for both gene expression and SNP genotyping applications (Deshpande et al., 2010; Shao, 2011; Bergval et al., 2012). With upto 500 different bead types available, the expression of up to 500 genes can be analyzed in one sample, and for SNP genotyping up to 250 SNPs can be analyzed for biallelic variations in one sample.
A workflow for gene expression is shown schematically in Fig. 4.4. The first step involves the capture of polyA-mRNA with immobilized poly-T oligos, using either a purified total RNA sample or cell lysates (Kroutter et al., 2012). The captured mRNA serves as a template for cDNA synthesis with a reverse transcriptase. After cDNA synthesis, several washes are performed to remove unincorporated nucleotides, enzyme, excess RNA and other contaminants. The cDNA is then incubated with a mix of sequence-specific probe pairs where the 3′ base of the upstream ligation probe (ULP) can bind to the target sequence immediately adjacent to the 5′ base of the downstream ligation probe (DLP), when both probes are properly binding their target sequences. The mix is incubated overnight to ensure efficient sequence-specific hybridization of all probes with their targets in the mix.

To insure sequence specificity, the ULPs and DLPs should be designed and selected for optimum performance in any mix by an in silico analysis. This analysis insures that all probe pairs in a multiplex mix will not cross-hybridize or otherwise compromise data integrity. All probes should be designed to span a sequence-specific region of at least 50 bp (Fig. 4.5). The ULPs have an anti-TAG sequence of 24 base pairs that defines which of the 500 bead types a particular probe will bind in the subsequent bead hybridization step of the assay. All ULPs also share the same universal primer site (UP1) and all DLPs share a universal primer site (UP2) to which a biotinylated primer binds for amplification.

Subsequent to the overnight hybridization of the probe mix, the reaction is treated with ligase to ligate any adjacent probe pairs followed by amplification with a UP1/UP2-biotin universal primer mix. Any probes that did not hybridize to their sequence-specific site with its pair partner will not be amplified. After amplification, the reaction is further processed and hybridized with an appropriate bead mix for the plex being used, then incubated with SAPE and followed by additional washes before analysis. After SAPE labeling, the sample can be analyzed on one of several Luminex instruments depending on the bead regions employed in the assay and the plex level. Depending on sample layout, some data analysis can be done with Luminex xPONENT® software, or the data can be exported as a comma delineated (.csv) file for processing and analysis with Microsoft Excel or other data analysis programs.
For SNP genotyping, LDA chemistry can be adapted for biallelic analysis. The initial step of the assay is an overnight hybridization of purified genomic DNA with a ligation probe mix. While the concept of using upstream and downstream ligation probe pairs is similar to that of gene expression biallelic SNP genotyping requires a second ULP. The two ULPs required for SNP genotyping differ with respect to the 3′ terminal base of each probe. If, for example, a specific SNP isbelieved to be represented by either an A or G variation, one of the ULPs for this SNP will have a 3′ T and the other a 3′ C. Beginning with the probe hybridization step, the assay is performed in the same way as the gene expression assay. After data normalization, interpretation of SNP genotypes is dependent on the ratio of signals between the two probes for each SNP. If the signals are roughly equal it indicates that both alleles are present and the individual is heterozygous for this SNP. If one signal for the two alleles for a given SNP is considerably higher than the other, then the locus is considered homozygous for the higher signal.
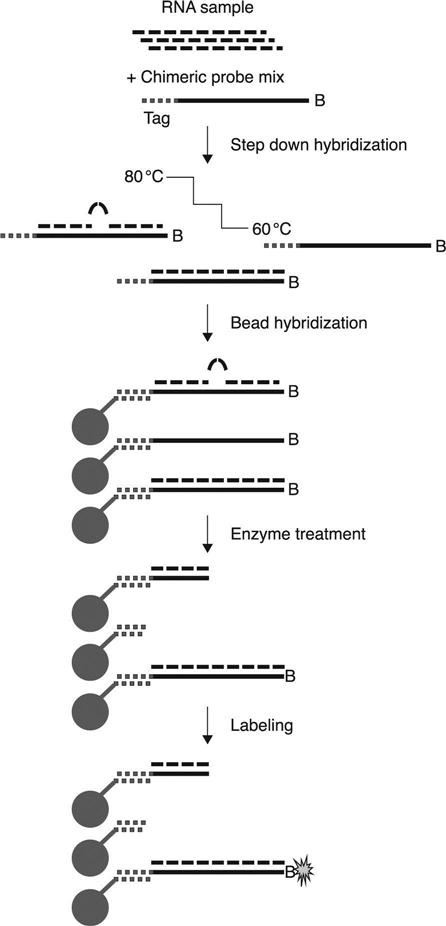
Luminex has also developed an assay for miRNA analysis that uses a nuclease protection assay chemistry does not require PCR amplification or probe-labeling (Sorensen, 2012). The assay is based on direct hybridization of a biotinylated chimeric probe to mature miRNAs in total RNA preparations (Fig. 4.6). The 5′ portion of the probe is DNA specific for anti-TAG binding and the 3′ portion of the probe is RNA complementary to a specific mature miRNA. The probe is also biotinylated at the 3′ end. The initial step of the assay is hybridization of a custom probe mix to a purified total RNA preparation for a step down hybridization. Step down hybridization is performed at a starting temperature of 80 °C and gradually drops to 60 °C. This step down hybridization series insures stringent sequence-specific hybridization of targets to their probes even with a wide range of different base compositions. Upon completion of step down hybridization, the probe-target complexes are hybridized to MagPlex-TAG beads. This produces three possible configurations of probe-miRNA hybrids: (1) chimeric probe not bound to a target miRNA; (2) chimeric probe with a single base mismatch in any position; and (3) an exact match of chimeric probe and target. Upon nuclease treatment, only exact match probe-miRNA hybrids retain the biotin for SAPE binding. Thus, after labeling with SAPE only exact match probe-target hybrids will produce a signal. After SAPE labeling and washing, the sample can be analyzed on a Luminex instrument and data analysis can be done with xPONENT software or exported asa .csv file for analysis with other data analysis software. Analysis and data presentation is similar to that of gene expression data with the results expressed as fold-change or other correlations.
4.2.3 Instrumentation
There are currently three xMAP analyzers available through Luminex or its partners: the Luminex 200, the FLEXMAP 3D and the MAGPIX® (Fig. 4.7). The Luminex 200 and the FLEXMAP 3D are flow analyzers capable of multiplexing up to 100-or 500-plex, respectively, with fluidics and laser-based optics similar to traditional flow cytometry instruments. The MAGPIX utilizes a flow cell and charge coupled device (CCD)-based optics with magnetic beads for multiplexing up to 50-plex. In the flow analyzers, the beads are introduced into a rapidly flowing fluid stream and, through hydrodynamic focusing, are interrogated individually as they pass by two separate lasers. A 635 nm, 10 mW red diode laser excites the fluorochromes contained within the microspheres and a 532 nm, 13 mW yttrium aluminum garnet (YAG) laser excites the reporter fluorochrome (R-phycoerythrin, Alexa 532 or Cy-3) bound to the bead surface. High-ipeed digital signal processing classifies the microsphere based on its spectral address and quantifies the reaction on the microsphere surface. Multiple readings are made per microsphere set, providing valid and robust statistics. Thousands of microspheres are interrogated per second, allowing analysis and reporting of up to 500 different reactions in a single reaction in just a few seconds per sample.

The Luminex 200 is designed to meet the multiplex testing needs of clinical and research laboratories. Built on proven, existing technologies including flow cytometry, microspheres, lasers, digital signal processing and traditional chemistry, the Luminex 200 analyzer allows multiplex analysis of up to 100 analytes per reaction. The system is versatile and can be used for a variety of applications such as immunoassays, genotyping, gene expression and enzymatic assays. A few microliters of sample in a 20–200 μl reaction can provide up to 100 results; thus the platform is well suited for applications where sample size is limited. Robust optics and fluidics afford quantitative results over a 3–4-log dynamic range with strong concordance with enzyme-linked immunosorbent assay (ELISA), real-time PCR and mass spectrometry. The intuitive template-based software, xPONENT, operates the system, is designed for use with commercial kits or custom protocols and has simple assay set-up, plate reading and data analysis capabilities. The 21 CFR Part 11 compatible upgrade offers multi-level user management, full audit trail, electronic records and electronic signatures. The system is also approved for IVD use, with more than 50 xMAP-based 510(k) cleared kits commercially available.
The FLEXMAP 3D is an enhanced flow-based multiplexing system utilizing xMAP Technology. The FLEXMAP 3D system assures rapid high-throughputanalyses without compromising flexibility or performance and optimizes workflow through automation of routine tasks and integration with front-end sample preparation platforms. Enhanced optics permit multiplexing of up to 500 analytes per well and can provide superior sensitivity with dynamic range extended to 4.5 log. The system is compatible with both 96-well and 384-well plates and has a piercing probe which allows sealed plates to be analyzed. The dual syringe configuration processes plates two to three times faster than the Luminex 200. The system’s xPONENT software has automation and laboratory information system interface components and includes walk-away maintenance and calibration functions. This combination of advanced features and capabilities can help to accelerate the discovery and development process and make the FLEXMAP 3D an ideal platform for multiplexing analytes that may be present at very different levels and eliminating the need for sample reanalysis due to out-ofrange results.
The MAGPIX, which utilizes a flow cell and robust light-emitting diode (LED)/CCD-based optics, supports multiplexing of up to 50 tests in a single reaction volume using MagPlex or MagPlex-TAG beads. In MAGPIX, the reacted magnetic beads are sent through a flow cell into an imaging chamber where a magnetic actuator pulls the beads out of suspension and holds them in place for optical analysis. Red LEDs (630 nm) excite the fluorescent dyes contained within the microspheres and green LEDs (515-521 nm) excite the reporter fluorochrome bound to the bead surface. A CCD imager identifies the bead region and quantifies the bound reporter. xPONENT software for MAGPIX operates the system and can be used with commercial kits or user-developed assays. With a lower cost and a compact size (requiring only 64.8 cm bench space), MAGPIX provides an affordable multiplexing solution ideal for the low- to medium-throughput laboratory and remote laboratory testing sites.
4.3 Illumina VeraCode
4.3.1 Technology
While Illumina® offers a wide range of high-density multiplex options forgenomic and proteomic applications, the VeraCode technology is Illumina’s midplex bead-based array technology (Illumina, 2010; Illumina, 2012a). The VeraCode platform is based on Illumina’s holographic tagged cylindrical glass microbead technology. The beads are 250 μm in length by 28 μm in diameter, and the large number of unique holographic patterns that can be imprinted in the beads allows the creation of bead mixes for the detection of hundreds to millions of markers in one sample. The holographic patterns also allow the identification of sample ID, laboratory ID and the specific kit used for an assay. The beads can be purchased in a number of formats, allowing users to develop their own assays, or can be purchased predesigned in ready-to-run kits. Depending on the detection chemistry beingemployed, user-developed assays or custom assay kits can be developed for both genomic and proteomic applications.
Assays for the detection of RNA, DNA or proteins can be designed by using different capture molecules and detection chemistries. Use of these different capture molecules allows the design of assays for gene expression, SNP genotyping, CNV analysis and a number of different proteomic assays. Based on the different assay types that can be developed with the technology, the platform is applicable for use in a variety of laboratory settings, including basic research, diagnostics, biodefense and forensics. For genomic applications, different chemistries are used for SNP genotyping and gene expression analysis. A number of high-density bead-based assays are also available from Illumina for gene expression analysis, and the company also offers NGS technologies for gene expression and other applications.
4.3.2 Chemistries
VeraCode, the company’s most popular midplex array technology, has been widely used for SNP genotyping. Assays based on the GoldenGate® (two-color) and ASPE (single-color) chemistries have been developed. In the GoldenGate assay (Illumina, 2012b), the initial step is shearing and immobilization of the genomic DNA to eventually remove it from the reaction. The manufacturer recommends starting with 250 ng of genomic DNA for single use or 2 μg for multiple uses. For biallelic analysis, the genomic DNA sample is hybridized with a mix of SNP-specific probes containing two allele-specific oligos (ASO1 and ASO2) and one SNP locus-specific oligo (LSO) (Fig. 4.8). The LSOs contain specific nucleotide tag sequences complementary to oligonucleotide tags attached to beads of specific code sets. This allows each SNP to be associated with a specific bead code in a mix that may contain hundreds to thousands of different code sets. The ASOs are designed to be from 1 to 20 bp away from their corresponding LSO. Their optimum location and sequences are determined by Illumina’s bioinformatics design group.

After hybridization of ASOs and LSOs to their genomic targets, the gap between the ASP and LSP primers is filled with DNA polymerase and then ligated. If there is no match of the 3′ terminal base of an ASO with its complementary genomic sequence, there is no primer extension and no subsequent ligation with the LSO. The presence or absence of ligated product, and thus which alleles are present, is determined by PCR amplification of ligated products. Detection of allele-specific ligation products is achieved through a universal primer binding site on each of the three primers. In addition, each ASO1 and ASO2 universal primer is labeled with either Cy3 or Cy5, respectively. This allows the ligated products to be hybridized with a mix of the three universal primers for PCR amplification. Analysis of labeled PCR amplicons is achieved after subsequent washes and hybridization to a complementary bead mix. The hybridized bead mixes arethen analyzed on an Illumina BeadXpress® reader. For each SNP, the biallelic call is made based on the ratio of Cy3 to Cy5 signal detected for each SNP locus. If the signals for both alleles at a locus are roughly equal, the SNP is considered to be heterozygous, and if the signal for one allele at a locus is considerably higher than the other, then the locus is considered homozygous for the higher-signal allele.
For single color detection, Illumina offers the ASPE assay chemistry (as shown in Fig. 4.3). The ASPE assay employs labeled nucleotides that are incorporated during primer extension when the 3′-OH base of the primer aligns with the SNP base in question. When the 3′ base of the primer is complementary to that of the SNP, labeled nucleotides are incorporated during primer extension. This approach allows any single nucleotide or all nucleotides to be labeled, which can enhance signals. To discriminate between the different alleles of each SNP, the allele-specific primers are assigned to specific coded beads and the signal intensities indicate whether a sample is heterozygous or heterozygous for each SNP. If thesignals for both alleles at a locus are roughly equal, the SNP is considered to be heterozygous, and if the signal for one allele at a locus is considerably higher than the other, the locus is considered homozygous for the higher-signal allele. This assay can also be designed to detect any of the four possible bases at any SNP, thus allowing detection of unexpected SNP types in different samples.
4.3.3 Instrumentation
While Illumina offers a number of different instruments for data analysis, the company’s BeadXpress reader is recommended for SNP genotyping assays based on VeraCode technology (Illumina, 2012c). The BeadXpress reader is used to analyze the results post-hybridization and offers various options for measuring up to 384 markers in each sample with the different chemistries. The instrument functions as a microfluidic processor for arranging the cylindrical beads in grooved chips for scanning and analysis. Once the beads have been processed and are positioned in the grooves, they are interrogated by lasers which excite the cyanine dyes for reporter quantitation and generate the holographic signal of each bead. Fluorescent reporter dye signals and holographic images are captured by a CCD camera, identifying the bead address or type for each unique bead holograph and recording the corresponding reporter signal. Data analysis can be done with Illumina’s GenomeStudio data analysis software. The software includes a number of features for data analysis and for analyzing the efficiency of an experiment. When various controls are run, information can be obtained about the efficiency of ASO primer extension, PCR amplification efficiency, gender determination of sample, annealing efficiency of ASO primers and other quality control data.
4.4 NanoString nCounter
4.4.1 Technology
NanoString® Technologies offers the nCounter Analysis System, which utilizes a novel digital technology that is based on direct multiplexed measurement of individual molecules and offers high levels of precision and sensitivity to <1 copy per cell (NanoString Technologies, 2010a). The technology uses molecular ‘barcodes’ and single molecule imaging to detect and count hundreds of unique transcripts in a single reaction. Each color-coded barcode is attached to a single target-specific probe corresponding to a gene of interest. Mixed together with controls, they form a multiplexed CodeSet. The technology was originally developed in the laboratory of Leroy Hood in 2000 (NanoString Technologies, 2010b). The company was formed in 2003 and obtained an exclusive license for the technology in 2004.
4.4.2 Chemistries
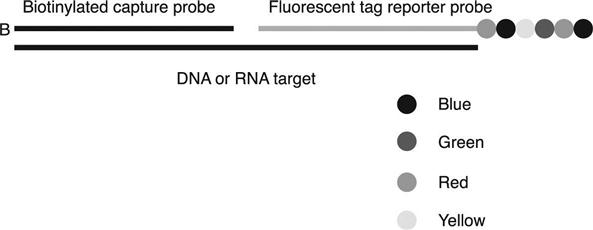
The assay chemistry is based on the hybridization of two sequence-specific probes to a target. For gene expression analysis, the target is mRNA. For CNV applications, the target is genomic DNA, and for miRNA analysis, the target is a ligation product of the mature miRNA and a miRtag sequence. For all assays, the sequence-specific probes are designed by the company’s informatics team to ensure uniform probe performance in mixes of up to 800 markers. Pre-made sets of probes are available or custom probe sets can be ordered. Each target-specific probe pair consists of a capture probe that is biotinylated on the 3′ end and a target-specific reporter probe that contains unique color barcodes on the 5′ end. The color barcode of the reporter probe contains six reporter positions, each of which contains one of four possible colors at each position (Fig. 4.9).
NanoString’s nCounter Gene Expression assay employs direct hybridization of the capture and reporter probes to RNA targets (NanoString Technologies, 2009). The annealing of probes to total RNA (purified or from cell lysate) is performed in microfuge tubes with the sequential addition of the reporter probe mix followed by addition of capture probe mix. Mixing of samples must be done gently to prevent shearing of the reporter probes, and centrifugation must be done at low speed to prevent probe pelleting. Following gentle mixing and centrifugation, the probes are hybridized directly to the RNA preparation for at least 12 h at 65 °C. After hybridization, the sample is further processed in the nCounter Prep Station to automatically wash away reporter probe and excess mRNA followed by washes to remove excess capture probe. The order of the washing steps is critical, and little to no signal is obtained if the order of these washes is reversed. After all unbound probes and targets are removed, the remaining hybridized complexes are immobilized to the surface of a streptavidin-coated cartridge and aligned for image collection and barcode counting. Data collection of the aligned moleculesis performed on an nCounter Digital Analyzer, and data can be analyzed by exporting the results as a .csv file and processing with Excel or other third party software programs.
For CNV analysis, NanoString offers the nCounter CNV assay (NanoString Technologies, 2011a). The assay employs the standard capture probe and reporter probe hybridization approach directly on genomic DNA, but requires a number of steps for preparing the genomic DNA for analysis. Prior to probe hybridization, the DNA must be fragmented. Uniform fragmentation of genomic DNA is achieved by digestion with Alu I using the recommended 600 ng of purified genomic DNA; however, as little as 200 ng may be used. The desired range of fragmentation is between 200 and 800 bp in length, which allows the use of formalin-fixed and paraffin-embedded (FFPE) samples if the DNA fragment size falls within the 200 to 800 bp range.
Following fragmentation, the DNA must be denatured to ensure that the capture and reporter probes access their targets. Denaturation is achieved by a 95 °C incubation for 5 min and immediate chilling on ice to minimize renaturation. Denatured DNA is then added to tubes containing reporter probe mix, followed by the addition of capture probe mix. Mixing of samples containing probes must be done gently to prevent shearing of the reporter probes, and centrifugation is performed at low speed to prevent probe pelleting. Hybridization is performed for at least 12 h at 65 °C and then reactions are further processed in the nCounter Prep Station as described above. Upon completion of sample processing, the sample cartridges are manually transferred to the nCounter Digital Analyzer for data collection. Data generated from analysis of the aligned molecules can then be analyzed by exporting the .csv files and processing with NanoString’s nSolver analysis software or other programs.
NanoString also offers a miRNA expression assay (NanoString Technologies, 2010c) and a variation that can be used for miRNA and mRNA analysis (NanoString Technologies, 2011b). In the miRNA expression assay, mature miRNAs, due to their small size, are first processed by capture and ligation to a miRNA tag sequence (mRitag) that is held to a specific miRNA by a miRNA-specific bridge (Fig. 4.10). After hybridization of miRNA to the mRitag and bridge molecules, the miRNA is ligated to the mRitag sequence. The miRNA tag ligation reaction can be performed in a background of total RNA following the procedure provided with the nCounter Human miRNA Sample Preparation Kit. A purification protocol prepares the ligation products for hybridization to the capture and reporter probes. As with the other NanoString protocols, the purified ligation product is hybridized to the capture and reported probes in strip tubes using a thermal cycler. After hybridization, the sample is processed on the nCounter Prep Station to wash away reporter probe and excess target, followed by washes to remove excess capture probe. Data of aligned molecules is collected on the nCounter Digital Analyzer and the exported .csv file can be analyzed by nSolver analysis software or other data analysis software.

4.4.3 Instrumentation
NanoString provides two generations of instruments for processing samples and analyzing data. Both consist of a post-hybridization sample preparation station and a digital analyzer for data collection. The nCounter Prep Station is used posthybridization to automatically process samples and prepare them for analysis (NanoString Technologies, 2011c). All reagents for sample processing are loaded into the prep station in a sealed microtiter plate format, so there is no need for hands-on processing by the user. The instrumentation automatically punctures the appropriate sealed wells on the reagent Prep Plate for processing of samples loaded onto the station. The user loads all required consumables and reagents into the Prep Station, including tips, the reagent plate, the sample cartridge and the samples. The Prep Station also has a small screen which displays step-by-step instructions for setting up the instrument for a sample processing run.
After a sample processing run is set up, the instrument performs the remaining steps automatically, including transfer of the sample for washing away reporter probe and excess target, followed by washing to remove excess capture probe. The automated protocol also ensures that wash steps are performed in the proper order, as if the wash steps are reversed the capture probes will be lost and no datacan be collected. The Prep Station also transfers sample to the sample cartridge for capture and alignment of target-probe complexes for data collection.
When processing is completed in the Prep Station, the user transfers the cartridge to the nCounter Digital Analyzer (NanoString Technologies, 2011d). The digital analyzer collects images of the aligned molecules attached to streptavidin in the bottom of the wells of the sample cartridge. These images are collected by the instrument’s CCD camera, which focuses on the bottom of each sample cartridge well through microscope objectives. When analyzed at the highest data sampling rate (280 fields for each well/sample), hundreds to thousands of data points can be collected by counting each reporter probe imaged in each viewed field. Since each individual reporter molecule imaged represents one target molecule, replicate samples are not needed. The image data for the different probes run in each well are tabulated and stored as .csv files, which can be transferred to computer via a USB device for analysis with nSolver Analysis Software (NanoString Technologies, 2011e) or other applications.
4.5 Applications
4.5.1 Applications on the xMAP platform
Suspension array assays have been used quite extensively for SNP genotyping and microbial detection, employing the various assay chemistries and platforms described above. In one of the earliest examples using the xMAP platform, Armstrong et al. (2000) used direct hybridization in a 32-plex SNP genotyping assay to determine genotypes of eight polymorphic genes. Four different allele-specific oligo probes were used per mutation, each with a different nucleotide at the polymorphic site. The results were compared with that obtained by TaqMan®, and, after optimization of the capture probe length, were unambiguous for the 39 genotypes tested. Direct hybridization has also been successfully applied to cystic fibrosis mutation screening (Dunbar and Jacobson, 2005), CNV analysis (Newkirk et al., 2006) and detection of chromosomal translocations in leukemia (Wallace et al., 2003). Yang et al. (2001) described a direct hybridization gene expression assay in which biotinylated cRNA was hybridized to complementary capture probes attached to microspheres to quantitate the expression of specific genes in Arabidopsis. The results were comparable to those obtained by Affymetrix GeneChip® probe array, and the sensitivity was sufficient to detect moderately expressed genes (10 to 30 copies per cell), making the midplex bead-based array system an ideal system for screening up to 100 genes in many samples.
Direct hybridization chemistry has also been applied to the detection and differentiation of a variety of microorganisms. Dunbar et al. (2003) developed a quantitative xMAP direct hybridization assay for detection and differentiation of Escherichia coli, Salmonella, Listeria monocytogenes and Campylobacter jejuni. The assay correctly and specifically identified each bacterial species and wassensitive to 103–105 genome copies in the PCR reaction. The assay was subsequently further optimized and expanded to detect ten different bacterial species (Dunbar and Jacobson, 2007). In 2004, Diaz and Fell described a 48-plex direct hybridization assay for high-throughput detection of Trichosporon. The assay was specific and fast, capable of discriminating species differing by one nucleotide, and required less than 50 min following amplification to process a 96-well plate. The sensitivity of the assay allowed detection of 102 genome copies in the PCR reaction. Direct hybridization has also been used for human papillomavirus (HPV) genotyping (Wallace et al., 2005; Schmitt et al., 2006), Mycobacterium tuberculosis spoligotyping (Cowan et al., 2004; Zhang et al., 2010) and many other microbial applications.
Taylor et al. (2001) used SBE chemistry with capture onto addressed microspheres to assay 20 multiplexed SNPs for 633 patient samples. Comparison of the results with those from gel-based OLA for 9563 genotypes showed 99.3% agreement in genotype assignments. To further simplify the assay procedure, they then used ASPE to allow multiplexing of all of the alleles of a particular SNP. Fifteen SNPs were genotyped from 96 samples using multiplexed ASPE, for a total of 1440 genotype determinations. The results obtained by ASPE showed 98.7% concordance with those obtained by OLA. While cost of an assay can vary greatly depending on the number of SNPs, the extent of multiplexing and the number of samples assayed, the investigators estimated their average cost to be less than $0.20 USD per SNP, excluding the cost of PCR, and found the costs of SBE and ASPE to be comparable. ASPE chemistry is also used in combination with Luminex’s xTAG Technology for a variety of Luminex genetic assay products, including the IVD-approved xTAG Cystic Fibrosis v2 and xTAG CYP2D6 v3 assay kits (Luminex Corporation, 2012c).
Solution-based chemistries with capture onto pre-coupled microspheres are also used in microbial detection and identification. In an early example, Ye et al. (2001) used ASPE and SBCE chemistries with addressed microspheres in a multiplexed assay to identify 17 different gram-negative or gram-positive bacteria with variable 16S rDNA sequences. The investigators found that both assays produced results identical to direct sequencing, and the accuracy was further demonstrated by species-specific patterns that were obtained for related bacterial strains. TSPE chemistry with xTAG Technology is the basis of Luminex’s xTAG Respiratory Viral Panel (xTAG RVPv1) assay kit, which can identify all major respiratory viruses commonly encountered, including Flu-A subtypes H1 and H3 (Krunic et al., 2007; Luminex Corporation, 2012d). The assay is approved for IVD use in the US, Canada and Europe for 12-19 virus types and subtypes (depending on geographical location) and also includes an internal (extraction control), a positive (run) control, and xTAG Data Analysis Software (TDAS) to interpret the results and establish the presence or absence of each target.
Iannone et al. (2003) used OLA with capture onto addressed microspheres to genotype nine SNPs located near the ApoE locus from seven DNA samples. Unique capture sequences (ZipCodes) were incorporated into the products during the OLA reaction, which allowed them to be captured by hybridization onto microspheres bearing the complementary capture probes (cZipCodes). They compared the results of the 18-plex assay with those obtained in single-plex and found no compromise of fluorescent signal in the fully multiplexed assay. They concluded that multiplexing has the advantages of rapid analysis and efficient use of reagents, the assay was high-throughput and accurate, and the method exploits the strengths of flow cytometry for rapid and accurate fluorescence analysis. Peck et al. (2006) further developed the LDA chemistry for gene expression analysis, combining multiplex LDA with the xMAP platform, and tested the method using a 90-gene expression signature. Replicate measurements of samples were highly correlated within a two-fold range of the corresponding means (97.7%) and overall correlation with microarray was 0.924.
The LDA chemistries have also been applied to microbial detection, with applications developed for measuring levels of Plasmodium spp. in malaria infections (McNamara et al., 2006). In blinded studies using P. falciparum-infected blood, infected and uninfected samples were detected with 100% concordance, and comparisons between parasitemia and fluorescent signal intensity showed very strong positive correlations, with r> 0.95. The assay has also been applied to P falciparum haplotyping (Dent et al., 2007) and detection of drug resistance SNPs (Carnevale et al., 2007; Barnadas et al., 2011). Deshpande et al. (2010) developed a LDA assay (MOL-PCR), consisting of a single-fube reaction followed by hybridization to pre-coupled xTAG Microspheres, that could be completed in less than 4 h. They demonstrated the utility of the assay in an application for detection of biothreat agents (Bacillus anthracis, Yersinia pestis and Francisella tularensis) using multiple sequence signatures per target organism to allow for redundancy in the detection. The assay was sensitive to 103–104 genome copies and specific for detection of nine out of ten blinded samples. One sample was not detected, presumably due to low sample DNA concentration.
TS-PCR chemistry is used in Luminex’s xTAG RVP FAST assay, which has been approved for IVD use in the US, Canada and Europe for 8–17 virus types and subtypes (Luminex Corporation, 2012d). This chemistry provides a simplified protocol with faster turnaround time as compared with TSPE. In RVP FAST, a multiplexed RT-PCR reaction is performed using target-specific upstream primers containing a TAG capture sequence paired with biotinylated downstream primers to amplify the target sequences in a single reaction. The amplified product is added to a combined hybridization/detection reaction containing corresponding anti-TAG-coupled bead sets and SAPE reporter. The completed reactions are read on the Luminex 200 analyzer and raw fluorescence values are analyzed using TDAS for RVP FAST software to interpret each target as present or absent. The risk of contamination from post-PCR manipulation is minimized by the reduction of operator handling steps to a single post-PCR transfer. TS-PCR chemistry isalso used for Luminex’s Gastrointestinal Pathogen Panel (xTAG GPP), which was launched in Europe in 2011 (Luminex Corporation, 2012e), as well as numerous laboratory-developed tests (LDTs) for multiplexed detection of fungal pathogens (Babady et al., 2011; Balada-Llasat et al., 2012).
4.5.2 Applications on the VeraCode platform
The VeraCode platform has been used for SNP genotyping a number of different species and pathogens. For example, Kitamura-Muramatsu et al. (2012) applied the VeraCode ASPE method to detection and genotyping of HPV. HPV DNA was amplified by PGMY-PCR (PGMY: PCR primer pools specific for the human papillomavirus L1 open reading frame), followed by ASPE using primers containing HPV type-specific L1 sequences. Labeled DNA was captured by hybridization to VeraCode beads and detected by the BeadXpress reader. Using this method, 16 clinically relevant HPV types were correctly genotyped in the multiplex format, and the results were identical to those obtained by validated PGMY-reverse line blot hybridization assay. The authors concluded that the VeraCode HPV genotyping assay provided a new platform for high-throughput genotyping of HPV needed for epidemiological surveys.
The VeraCode platform has also been used for detection and identification of genetic variations associated with a number of non-infectious diseases, including neurological disorders and cancer. Wang et al. (2012) used the VeraCode system in a study of 106 SNPs in 16 candidate genes using four sample sets consisting of 731 Alzheimer’s disease (AD) patients and 738 control subjects in the Han Chinese population. A SNP in the insulin-degrading enzyme gene was found to have a significant association with AD, whereby the C allele increased the risk of AD 1.72-fold as compared with the G allele. CC carriers had a 4.89-fold higher risk than CG and GG carriers, and the CC genotype was significantly associated with an earlier age at onset. In a study of late-onset AD disease in the Korean population, five SNPs in the ubiquitin-conjugating enzyme E2I and two SNPs in ApoE were genotyped by VeraCode technology in 312 AD patients, 347 subjects with mild cognitive impairment and 489 healthy controls (Ahn et al., 2009). The frequency of the AG genotype in one SNP in intron 7 was significantly higher in AD patients, and two SNPs were found to be associated with increased risk for mild cognitive impairment in females.
A genome-wide association study conducted on 2011 Parkinson’s disease (PD) patients and 18 381 controls from Japan led to the identification of two new susceptibility loci (PARK16 and BST1) for PD (Satake et al., 2009). The study also detected strong associations of two autosomal dominant parkinsonism loci in typical PD (SNCA and LRRK2). Comparison with genome-wide association studies performed on individuals of European ancestry showed that the BST1 and MAPT loci exhibited population differences, suggesting that population differences may contribute to genetic heterogeneity in PD.
Peethambaram et al. (2011) used the VeraCode 96-SNP platform to study polymorphisms in the ABCB1 and ERCC2 genes and their contribution to ovarian cancer development. The ABCB1 and ERCC2 genes are involved in drug metabolism, multi-drug resistance and DNA repair, along with CYP2C8, CYP3A4, ERCC1, GSTM1, XPC and XRCC1. The data indicated that, of these eight genes and associated SNP variants, only variants in the ABCB1 and ERCC2 genes were associated with influencing the outcome of patients with ovarian cancer. VeraCode and BeadXpress analysis has also been applied in population studies that have revealed genetic polymorphisms associated with male infertility (Aston et al., 2010), asthma (Kim, J. H. et al., 2010), variation in hemoglobin concentration (Beall et al., 2010) and variation in height (Kim, J. J. et al., 2010).
4.5.3 Applications on the nCounter platform
NanoString’s non-enzymatic hybridization chemistry has been proven effective for purified RNA samples; however, all gene expression assays have a more difficult time producing quality data from FFPE samples. A considerable amount of RNA degradation can occur in these samples, and, if not processed properly, certain contaminants can inhibit some downstream enzymatic assays. To assess the ability of the NanoString platform to process FFPE samples, Reis et al. (2011) tested the accuracy of data obtained from FFPE samples analyzed with NanoString vs. qPCR. In this study, the expression of 20 genes potentially involved in the development of oral carcinomas was measured using samples that had been flash frozen or paraffin embedded from 1997 to 2008. The results showed that flash-frozen samples performed best for both assays and that NanoString performed better than qPCR with FFPE samples.
The benefits of the NanoString technology to perform reliably with FFPE-derived samples were also demonstrated in a study by Northcott et al. (2011). This study evaluated the ability of the technology to identify three medulloblastoma subgroups (WNT, Group C and Group D) by their gene expression signatures. Specific gene signatures had previously been determined with high-density Affymetrix exon array analysis. The results of this study indicated that, by analyzing the expression profiles of only 25 genes representative of the different medulloblastoma subgroups, the accuracy of identification of the different subgroups ranged from 88% to as high as 98%. Malkov et al. (2009) also found that the nCounter Analysis System generated robust data for multi-gene expression signatures in total RNA prepared from flash-frozen tissues, FFPE and crude tissue lysates. Quantitation of gene expression was assessed for 48 genes in multiplexed reactions and found to be equivalent to that obtained by TaqMan® assays for genes expressed above 0.5 copies mRNA per cell. The system response was linear over more than two orders of magnitude with coefficients of variation at approximately 6%.
Direct multiplexed measurements of 70 small RNAs was performed on methicillin-resistant Staphylococcus aureus to determine the orientation andexpression of the expressed small RNAs (Beaume et al., 2011). The nCounter system was able to identify the coding strand of 61 of the small RNA molecules, and expression levels were comparable to those obtained by quantitative RT-PCR. The NanoString system was used to determine relationships among transcription factors required for adherence of Candida albicans to silicone (Finkel et al., 2012). Two transcription factors, Bcr1 and Ace2, were found to define a regulatory network of 12 transcription factors directing the expression of more than 25% of C. albicans cell surface protein genes. Fanning et al. (2012) used the NanoString platform to study the role of Bcr1 in a mouse model of oropharyngeal candidiasis. In one set of experiments, 64 new genes were identified with significantly altered RNA levels during oropharyngeal candidiasis.
Wyman et al. (2011) developed and validated a novel assay based on the nCounter platform to quantitatively profile 3′ nucleotide additions to miRNAs. The study showed that the 3′ modification of miRNAs was selective for specific miRNAs and governed by multiple enzymes, three of which were not previously known to modify miRNAs. NanoString technology was used to profile miRNA in esophagus and six additional tissues to determine the presence of a distinct miRNA signature in chronic zinc deficiency (ZD) associated with increased risk of esophageal squamous cell carcinoma (ESCC) (Alder et al., 2012). ZD caused overexpression of inflammation genes and altered microRNA expression in all of the tissues analyzed. The inflammatory ZD esophagus had a distinct microRNA signature, with miR-31 and miR-21 as the most up-regulated species, and esophageal miR-31 and miR-21 levels were directly associated with the appearance of ESCC in ZD rats, as compared with cancer-free Zn-sufficient or Zn-replenished counterparts.
nCounter Gene Expression assays have been applied to numerous studies of various cancers, which have illustrated their utility in screening for risk of cancer development and recurrence. Quek et al. (2012) developed a 20-gene multiplex test to measure RNA transcripts in urine for detection of prostate cancer. Six known prostate cancer markers were positive in urine from pre-operative cases, suggesting that the assay can potentially be used for screening, early cancer detection and patient stratification. Siddappa et al. (2013) used the nCounter platform for gene expression-based detection and classification of disseminated tumor cells in the bone marrow of breast cancer patients to identify women at high risk of recurrence. Thirty-eight validated transcripts were analyzed from 20 breast cancer patients. Tumor cell-specific gene expression was detected with a sensitivity of one cancer cell per 1 × 10⁶ nucleated bone marrow cells. Six of eight patients who developed metastatic disease had detectable expression of at least one transcript, and the panel identified expression of at least two genes that are therapeutic targets. Fernandez et al. (2012) used nCounter technology to analyze RNA phenotypes in a multi-center study on 86 samples from acute leukemia patients. Significant correlation between nCounter and flow cytometry (Pearson Correlation Coefficient values between 0.40 and 0.97) was found for the22 antigens tested. A correlation analysis performed on a per sample basis resulted in concordant results in 44-100% of the antigens tested (mean = 76%), depending on number of blasts present, homogeneity of the blast population and type of leukemia. The investigators concluded that the nCounter technology allows fast and easy depiction of a mRNA profile from hematologic samples and has the potential to become a valuable tool for the diagnosis of acute leukemias.
4.6 Conclusion
The development and utilization of whole genome assay technologies has allowed the accumulation of a vast amount of information on gene expression patterns and genomic sequences for many different organisms. However, once key markers are identified for a particular area of study, faster and more cost-effective methods are needed for the routine analysis of a greater number of samples where whole genome analysis is not required. Midplex or mid-density arrays provide a practical solution for high-throughput analysis of hundreds to thousands of samples where only dozens to a few hundred markers need to be followed. In this chapter we have described several of the mid-density multiplex bead array technology platforms and the associated assay chemistries and provided an overview of some of their applications to the study of genomics and infectious diseases. The features of each of these platforms are summarized in Table 4.1. Based on these advances and trends in biosensor development for multiplex nucleic acid analysis, we anticipate further development of the midplex bead-based array technologies in the future, ultimately resulting in even higher throughput with more data points per sample, at a lower cost and with more automation to further simplify upfront sample handling and processing requirements. When coupled with the diversechemistries that can be used with these platforms, continued improvement of assays for nucleic acid research and diagnostics will help advance our understanding of infectious and non-infectious disease mechanisms and provide the means for more accurate diagnostics in these disease categories.
Table 4.1
Summary of midplex bead array technologies for nucleic acid detection
| Company | Technologies | Instruments | Plex level | Chemistries |
| Luminex® Corporation | xMAP® Technology | MAGPIX® | 1—50 | Direct capture |
| xTAG® Technology | Luminex® 100/200™ | 1—100 | ASPE/TSPE | |
| FLEXMAP 3D® | 1—500 | SBE (SBCE) OLA/LDA RNase protection | ||
| Illumina®, Inc. | VeraCode | BeadXpress® | 1—384 | GoldenGate® ASPE |
| NanoString® Technologies | nCounter® Analysis System | nCounter® Prep Station nCounter® Digital Analyzer |
1—800 | Hybridization Ligation/hybridization |
