
Mass spectrometry-based proteomics techniques for biological identification*
R.E. Jabbour and A.P. Snyder, US Army Edgewood Chemical Biological Center, USA
Abstract:
This chapter presents the identification and differentiation of bacteria by proteomics-mass spectrometry (MS) and tandem mass spectrometry (MS/MS). Predominant MS techniques utilized for bacterial identification include electrospray ionization (ESI)-MS/MS and matrix-assisted laser desorption/ionization time-of-flight (MALDI-TOF)-MS. The diversity of the bacterial proteome requires the determination, identification and characterization of its protein content in order to understand their cellular functions. Bioinformatics software analysis tools have been developed to efficiently address microbial identification by proteomics MS, and several peptide searching algorithms (e.g. SEQUEST and MASCOT) are applied to address peptide identification using proteomics databases generated from either fully or partially genome sequenced organisms.
Key words
electrospray ionization; tandem mass spectrometry; bioinformatics; matrix-assisted laser-induced mass spectrometry; microbial identification
14.1 Introduction
The bacterial proteome represents the collection of functional and structural proteins that are present in the cell. The protein content of the cell represents the majority of the cell dry weight, which makes it an ideal cellular component to be utilized for bacterial characterization (Loferer-Krobacher et al., 1998). The diversity of the bacterial proteome requires the determination, identification and characterization of its protein content in order to understand their cellular functions (Costas, 1990). Indeed, studying the bacterial proteome is essential to identify pathological proteins for vaccine development, for diagnosis, to provide countermeasures to infectious diseases, and to understand biological system processes. The availability of microbial genomic sequencing information has expanded the discipline of bacterial proteomics. Proteomics addresses the functional proteins produced by the changes of genetic expressions. Comparative proteomics studies allow the examination of bacterial strain differences, both phenotype and genotype, and bacterial growthunder various nutrient and environmental conditions (i.e. nutrient type, growth phase, temperature and chemical compounds such as antibiotics). Comparative proteomics also provides the researcher with a tool to begin characterizing the functions of the vast proportion of ‘hypothetical’ or ‘unknown’ proteins elucidated from genome sequencing and database comparisons.
Comparative proteomics has been widely applied to microbial identification and characterization studies through the utilization of several MS techniques, with tandem mass spectrometry (MS/MS) techniques proving to be effective and reliable (Anhalt and Fenselau, 1975; Hillenkamp and Karas, 2000; Krishnamurthy et al., 2000; Aebersold, 2003; Dworzanski et al., 2006; Jabbour et al., 2010a). The most predominant MS techniques that have been utilized for bacterial identification and differentiation include electrospray ionization (ESI)-MS/MS, matrix-assisted laser desorption/ionization time-of-flight-MS (MALDI-TOF-MS), surface-enhanced laser desorption/ionization (SELDI) MS, one- or twodimensional sodium dodecylsulfatepolyacrylamide gel electrophoresis (1D or 2D SDS-PAGE), and hybrid techniques such as combinations of MS, gel electrophoresis and bioinformatics. These methods provide either fingerprints of the bacterial proteins, e.g. MALDI-TOF-MS, or amino acid sequences of proteins from ESI-MS/MS and post-source decay (PSD) in TOF-MS of ionized tryptic peptides. Investigations of the protein component in biological systems constitute the realm of proteomics (Nagele et al., 2003; Pennington et al., 1997). LC-ESI-MS/MS and MALDI-TOF-MS techniques are well suited to handle the complex and very comprehensive suites of proteins in a reproducible fashion (Williams et al., 2002) from microorganisms.
Furthermore, the vast amount of protein and peptide data generated from typical LC-ESI-MS/MS and MALDI-TOF-MS procedures needs to be addressed in an efficient and timely manner. Using MS techniques for bacterial identification and differentiation relies on the comparison of the proteome information generated from either intact protein profiles (top-down) or the product ion mass spectra of digested peptide sequences (bottom-up) analyses (Fox et al., 2002; Pennington et al., 1997). For top-down analysis, bacterial differentiation and identification are accomplished through the comparison of the MS data of intact proteins with an experimental mass spectral database containing the mass spectral fingerprints of the studied microorganisms (Jabbour et al., 2005; Fenselau and Demirev, 2001; Pineda et al., 2000; Demirev et al., 1999). Conversely, bacterial differentiation using the product ion mass spectral data of digested peptide sequences is accomplished through the utilization of search engines against publicly available sequence databases to infer identification (Williams et al., 2002; http://www.ncbi.nlm.gov/PMGifs/genomics/micr/html). A number of successful bioinformatics software analysis tools have been devised to efficiently address this task (Fox, 2006; Williams et al., 2002; Yates, 1998; Kuwana et al., 2002). In addition, several peptide searching algorithms (e.g., SEQUEST and MASCOT) have been developed to address peptide identification using proteomics databases thatwere generated from either fully or partially genome sequenced organisms (Krishnamurthy et al., 2000; Demirev and Fenselau, 2008; Ecker et al., 2005). Furthermore, new genomes are constantly being realized and resolved so as to increase the database of bacterial genomes for biological sample interrogation (Dworzanski and Snyder, 2005). Most of the Category A, B, and C biological threats from the Centers for Disease Control (CDC) have their genomes fully sequenced and available for bioinformatics-based proteomics methods (http://genomesonline.org/cgi-bin/GOLD/index.cgi; Rotz et al., 2002).
The identification and differentiation of bacterial strains using the proteome component is the main focus of this chapter from the point of view of MS applications, methods and techniques.
14.2 Bacterial proteome handling, processing and separation methods
Minimal to significant bacterial sample handling, preparation and extraction protocols and procedures are usually performed prior to introducing the bacterial proteome component into a mass spectrometer. Successful detection and comprehensive characterization of microbial agents using various LC-MS techniques are dependent on efficient sample processing methods. Therefore the lysis of microorganisms usually represents the first step in releasing the proteins using physical or chemical means and techniques to rupture cell walls and release a majority of the cellular proteins.
Processing of microbial proteins for proteomics analysis has developed into three main methods. Initially, all processing methods rely on cellular lysis to provide access to the vast milieu of proteins. Then either on-line or off-line transfer of the protein-laden supernatant is performed for additional processing. An important method of protein separation that has found extensive utility is 2D-polyacrylamide gel electrophoresis (PAGE) (Lambert et al., 2005; Quadroni and James, 1999; Lopez, 2000). The third step consists of processing the many separated proteins by excising a protein spot from the gel with subsequent purification, concentration and trypsin digestion. The physical manipulations of the PAGE method are very time-consuming, and there are inherent limitations, such as not providing for the realization of proteins with low and high molecular weight and low and high pI values, and the capture of non-polar membrane-bound proteins (Wolters et al., 2001a; Ihling and Sinz, 2005).
Alternative methods have been developed for direct protein processing with liquid and/or stationary supports (Wolters et al., 2001a; Vollmer et al., 2003; Salzano et al., 2007; Malen et al., 2008; Dai et al., 2005; Wu et al., 2003). Preprocessing consisted of protein precipitation, denaturation using concentrated urea to remove the protein’s secondary and tertiary structures, dithiothreitol (DTT) disulfide reduction, and alkylation steps. Trypsin digestion was then performed either in solution or on solid-phase porozyme media. The peptidesupernatant was concentrated and/or introduced into a 2D system which consisted of a strong cation exchange (SCX)-reverse phase (RP) LC-ESI-MS/MS for comprehensive peptide separation and detection and is known as multidimensional protein identification technology (MudPIT). The detailed sequence of steps usually followed different degrees of on-line status, where some steps were manual and others were performed from one step to the next with sample transfer from one module to the next module.
Craft and Li (2005) integrated a heated clean-up and digestion module for cytochrome c and bovine serum albumin protein standards prior to LC-MS/MS analysis. Further development was reported by combining thermal denaturation, reduction, digestion and peptide pre-concentration of protein standards and mouse liver protein extract for LC-MS/MS peptide characterization (Ma et al., 2009).
14.2.1 Bacterial cell lysis and protein extraction
Physical lysis has been the method of choice for cell disruption; however, it often requires expensive, cumbersome equipment and involves protocols that can be difficult to repeat due to variability in the apparatus. The most reliable methods in this category include ultrasonication, French press, pressure cycling, bead mills and thermal lysis. Recently, new methods for lysis of microbial cells directly on a chip were investigated and applied to pathogen detection systems (Wang et al., 2007; Andersson and van den Berg, 2004; Baoa et al., 2008).
Ultrasonication
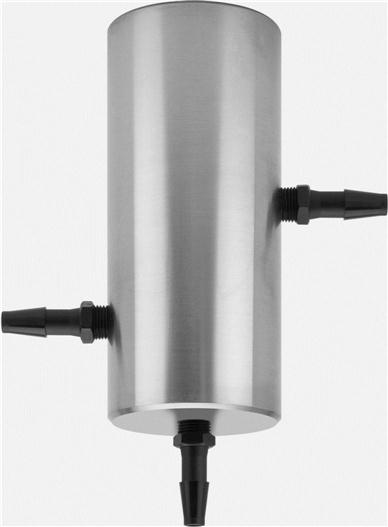
Cell membrane disruption by sonication is directed by ultrasound induced cavitation. Ultrasonic waves propagate in a liquid medium from pressure waves that alternatively expand and contract, creating microbubbles or ‘cavities’. Collapse of these cavities can produce extreme shear forces with the ability to disrupt membranes. The method uses pulsed, high-frequency sound waves to agitate and lyse bacteria and spores. The sound waves are delivered using an apparatus with a vibrating probe that is immersed in the liquid cell suspension. Mechanical energy from the probe initiates the formation of microscopic vapor bubbles that form momentarily and implode, causing shock waves to radiate through a sample. To prevent excessive heating, ultrasonic treatment is applied in multiple short bursts to a sample immersed in an ice bath. Using a sonicator tip with a small volume of biological sample usually requires deep insertion of the tip into the solution vial to avoid the formation of foaming of the protein. Also, addition of thiol-containing compounds, i.e. DTT or cysteine, could minimize the oxidative reaction resulting from radical formation during the sonication process (Zeng et al., 2006). Common sonication devices include a sonication bath, ultratip sonicator and miniaturized sonicators (Fig. 14.1) such as a mini-sonicator developed by Belgrader et al. (1999).
Reagent lysis
Reagent lysis of whole cells achieves both cell rupture and a selective way of extracting certain cellular components. There are two major types of reagents used to lyse microbial samples: chemical and biochemical reagents.
Chemical lysis
The original goal of cell lysis using chemical reagents was to preserve the cell in a largely intact state even after the release of its contents. This facilitates separation of the cell debris from the supernatant. However, the compatibility of the chemical reagent with the analytical technique must be considered. In the case of protein extraction, the removal of lysed DNA from the lysates is necessary to eliminate the viscosity issue that might occur during protein purification. Chemical lysis often involves the addition of chelating and chaotropic agents and/or detergents. Chelating agent addition to bacterial cells will diminish the cell wall permeability barrier, while chaotropic agents, i.e. guanidine, ethanol and urea, will weaken hydrogen bonds and act as denaturing reagents that destroy the higher-orderstructure of macromolecules and cause their denaturation. Unfortunately, these reagents are usually employed at high concentrations, which makes them unsuitable for large-scale lysis processes. Further, ionic and non-ionic (Triton X-100, Duponal, Brij-35 polyoxyethylene surfactant) detergents have been used to penetrate bacterial inner cell membranes. Various combinations and types of detergents are used to release specific cellular components such as periplasmic or cytoplasmic proteins.
In recent years, detergent-based lysis has become very popular due to ease of use, low cost and efficient protocols. Several vendors offer detergent-based reagents for the preparation of whole and fractionated cell lysates that are faster reacting and more convenient than traditional lysis methods. Furthermore, a new generation of detergents has been developed for MS applications (Cadene and Chait, 2000).
Biochemical lysis
Biochemical cell lysis employs certain enzymes and proteins. A most notable biochemical lysis method is using lysozyme to hydrolyze beta 1→4 glycosidic linkages in the peptidoglycan of bacterial cell walls. This approach is very effective for Gram-positive bacteria and they lyse rapidly. However, Gram- negative bacteria require a pre-treatment step to allow lysozyme to access the cell wall. Such a process requires the addition of chelating reagents such as EDTA (Hodson et al., 1995).
Extraction of microbial constituents and their introduction into MS systems
Conventional culture and staining techniques are currently the gold standard for isolation, detection and identification of target biological threat agents. However, the use of culture enrichment and selection results in lengthy assays, which can take days for preliminary results. The selective and differential culturing methods are in contrast to relatively rapid and efficient detection and identification methods such as DNA hybridization, nucleic acid amplification, antibody agglutination, enzyme immunoassays and MS-based techniques.
In most cases, detection methods require steps to concentrate the target biological threat agent and/or purify the target analyte from the sample matrix prior to detection. For example, polymerase chain reaction (PCR) and nucleic acid sequence-based amplification may enrich a single, specific DNA or RNA sequence up to 106-fold in 20 min to a few hours and theoretically have a sensitivity of a single bacterial cell. However, substances such as bile salts, polysaccharides, heme and humic acids in sample matrices inhibit enzymatic reactions required for nucleic acid amplification (Radstrom et al., 2004). In general, low levels of target analyte in samples require concentration and/or cultural enrichments to provide a sufficient amount of target for amplification. Although many MS-based methodsof low specificity do not require sample pre-processing, nevertheless, the more advanced MS methods that rely on revealing the sequence information of proteins usually require sample processing before the extracted, effective sample can be introduced into a mass spectrometer.
Many of the initial procedures were combined into a ‘one-pot’ system. Ethier et al. (2006) constructed an SCX proteomic reactor to accept the cell lysate. Sequential processing steps took place; however, the fate of the residual reactants and by-products in the denaturation, DTT reduction, iodoacetamide (IA) alkylation and trypsin digestion steps was unclear. Evaporation and concentration completed the peptide processing, and the peptides were presented to an LC-MS/MS for separation and analysis. A concern is that the reagents for each step prior to the LC-MS/MS were not removed or separated, and this was also of concern to Ma et al. (2009). It was possible that the reduction/alkylation/trypsin digestion reactants and residual products remained in the reactant SCX column, potentially causing sub-optimal conditions for protein processing.
14.2.2 Protein separation techniques
Proteins are the functional units of all organisms, and protein signatures represent an alternative to nucleic acid-based techniques for bacterial identification. Standard slab gel techniques are well established in the microbiology and biochemistry arenas for the analysis of proteins and can show differences in the proteome (protein) separation patterns that should help in the characterization of microorganisms. Nevertheless, these methods are time and labor intensive. Therefore, faster approaches have been widely investigated.
In general, proteins isolated from lysed bacterial cells will contain constituents detrimental to their isolation, such as lipids, nucleic acids and polysaccharides. Because proteins are often insoluble in their native state, the neutralization of interactions involved in protein aggregation, e.g. disulfide/hydrogen bonds, van der Waals forces, ionic and hydrophobic interactions, enables the proteins to disperse into individual polypeptides and thus promotes their solubilization (Wilkins et al., 1997). Unfortunately, the presence of buffers, chaotropes, detergents, or cocktails of proteinase inhibitors, which are usually added to aid in protein extraction and to preserve the integrity of a proteome, may interfere with further processing and analysis of proteins. Therefore, they have to be removed from the sample before introduction into a mass spectrometer. Due to the relatively low molecular mass of these additives and many other cellular contaminants, in comparison to the mass of proteins, size exclusion approaches are frequently used to remove them from protein samples. These methods include size exclusion chromatography, dialysis and ultrafiltration. In addition, both ion exchange and RP chromatography are frequently used to clean samples before MS analysis, and the rapid extraction and purification of proteins can be performed by many commercially available solid phase microextractionsystems such as ZipTip, ZipPlate, Gelloader or MassPREP PROtarget (Wallman et al., 2004).
Commercially available capillary chromatography systems for proteomics applications usually include protein trapping pre-columns, where the sample is purified, desalted and pre-concentrated prior to injection onto a capillary column. In general, high-performance liquid chromatography (HPLC) is an important separation technique for the analysis of proteins and peptides because it can easily be coupled to a mass spectrometer. Moreover, the compatibility of solvents used in the RPLC separations with ESI makes this hyphenated technique most commonly used in the final stage of proteomics analysis.
A gel-free analysis of extracted proteins can be performed using bottom-up or top-down MS-based proteomics approaches. For bottom-up analyses, a mixture of proteins is digested into peptides, which are then separated, ionized and analyzed by tandem MS to obtain amino acid sequence information. The top- down approach relies on the separation of extracted proteins, and the critical component is the measurement of their high-resolution, or accurate, molecular masses and partial sequences.
Other LC systems, including size exclusion, ion exchange and affinity separation columns, are commonly used during consecutive chromatographic steps of sample preparation, clean-up, enrichment and pre-fractionation. Most chromatographic approaches are tolerant to moderate concentrations of contaminants such as weak buffers. It should be noted that liquid samples injected into LC columns cannot contain insoluble particles or dispersed molecules that may cause column clogging and malfunction. Such contaminants are usually removed by centrifugation and/or sample filtration using spin-filters. In addition, samples should not contain buffers that deleteriously affect LC separation. That is, samples injected onto a column should not be dissolved in a buffer with a higher eluting strength than that of the mobile phase. High concentrations of detergents should be avoided in the case of RPLC separations, whereas samples injected onto an ion exchange column should not contain a high concentration of background salts and other ionic contaminants that may disturb the ionic equilibrium. Volatile buffers such as ammonium acetate or ammonium bicarbonate are recommended in this case.
14.3 Sample ionization and introduction for mass spectrometry (MS) analysis
Two methods of protein ionization and MS introduction utilize electrospray ionization (ESI) or MALDI. These techniques convert neutral protein/peptide samples into ionized species. Methods used to process whole bacteria into proteins will be presented with subsequent descriptions of the ionization methods.
Recent advances in sample preparation for ESI include the use of chips and microfluidic devices which may integrate the successive preparation steps. Forinstance, in the case of protein analysis, digestion followed by separation of peptides by 1D-LC, 2D-LC or capillary electrophoresis (CE) are used as sample separation devices, which are directly coupled onto a nano-ESI introduction technique for tandem MS analysis (Ramsey and Ramsey, 1997). Small volume samples may be handled and sensitive analyses are possible. Peterson et al. (2003) have introduced an integrated device which has a 40 nl microcolumn with immobilized trypsin for protein digestion and a solid phase extraction (SPE) microcartridge for desalting/concentration of digested peptides. Volumes in the nl range are manipulated, and digestions are produced in 1 min.
14.3.1 Electrospray ionization (ESI)
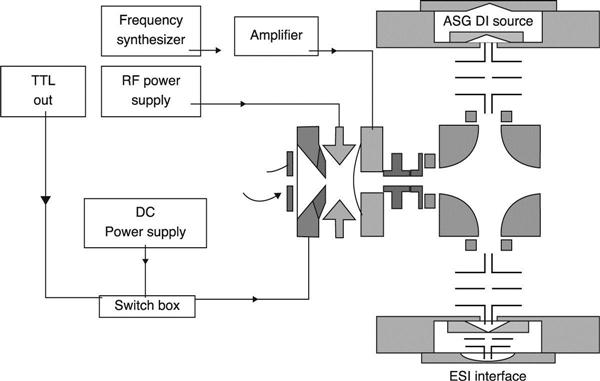
ESI takes place by introducing a very fine spray of a liquid solution of analytes into a strong electric field (2–4 kV) imposed between the capillary tube and the counter electrode of the mass spectrometer inlet (Fig. 14.2). Clusters of charged droplets are produced that consist of analyte with many solvent molecules. Protons are the charge carriers for the analyte-solvent clusters when ESI is performed in the positive ion mode. The initial droplet size may vary from a few to 50–60 μm in diameter, depending on the diameter of the electrospray nozzle and the liquid flow rate. The droplets decrease in size due to the evaporation of solvent molecules, and, as the droplet diameter decreases, the charge density increases and repulsive forces promote electrohydrodynamic disintegration into many smaller droplets. The asymmetry in the charge distribution at the droplet surface induces coulombic explosion of the droplet, whereby the repulsive forces among like charges overcome the cohesive forces of the solvent. In negative ion ESI, ion emission is accompanied by electron emission from the emitter or counter electrode. In order to avoid the loss of analyte due to the relatively large droplet size, an assisted spray version is used in which a sheath gas is introduced from the high-pressureside of the mass spectrometer sample introduction area around the electrospray needle. The sheath gas, usually nitrogen, serves as a drying stream in order to enhance evaporation and efficient removal of the solvent/water clusters from the charged analyte. The resulting analyte ions enter the mass spectrometer through electrostatic lenses. One of the most useful attributes of ESI is its ability to interface MS with popular separation techniques such as HPLC and CE, thus providing an efficient and highly sensitive platform for analysis of biomolecules in complex matrices.

The most extensively used mass analyzers for ESI are quadrupoles, TOF analyzers and ion traps.
14.3.2 Nano-ESI source
The ionization efficiency of ESI depends on the presence of salts, buffers and other additives or matrix components. Therefore, separation techniques are usually used prior to ESI-MS analysis (Bothner et al., 1998). However, many other approaches were addressed to increase the sensitivity of ESI-MS (Wilm et al., 1994; Gale et al., 1993; Wilm et al., 1996). The common feature of these studies was the use of narrow spray capillaries with nozzle diameters in the micrometer range. Such nano-ESI sources are used with flow rates below 1 μl/min and produce nano-droplets on the order of 100 nm in diameter. This approach offers several advantages in comparison with classical sources (Gabelica et al., 2002), such as negligible consumption of solvents and high sensitivity (Schneider et al., 2003; Valaskovic et al., 2006; Liu et al., 2004).
14.3.3 Applications of ESI-MS/MS
ESI has inherent analytical advantages that allow it to be utilized for different biological problems. Since the limitation of molecular mass is minimal, relatively large biomolecules have been successfully mass analyzed using ESI techniques that include even intact viruses or their chromosomes (e.g. coliphage T4 DNA with a nominal molecular mass of 1.1 × 10⁸ Da, Chen et al., 1995; Smith et al., 1994). Moreover, microbial carbohydrates, lipids, single-stranded DNA, RNA, proteins and peptides were studied through ESI-MS and have been used for the detection, identification and classification of microbes (Smith et al., 1995; Wickman et al., 1998; Chenna et al., 1993; Habibi-Goudarzi and McLuckey, 1995; Dworzanski et al., 2006; Zhou et al., 2001; Arnold et al., 1999; Chen et al., 2001) and their toxins (Hua et al., 1993).
14.3.4 Applications of MALDI-MS
MALDI is a method allowing the ionization and transfer of a sample from the solid phase into the gas phase that was introduced by Karas and Hillenkamp (1988). This type of laser desorption is a soft ionization process achieved by bombarding a mixture of analytes and matrix with laser beam photons, which induce sample desorption and ionization. MALDI is a popular ionization technique that is most frequently used in combination with TOF-MS (Fig. 14.3).

The desorption and ionization processes are usually performed in the vacuum chamber for a TOF instrument (vide infra); however, many other types of analyzers can be used for this purpose. The main advantage of the method is that it directly measures molecular masses at a very high speed (about 100 μs) and usually requires minimal sample preparation. MALDI usually produces singly charged molecules and thus resembles mass spectra produced by chemical ionization for low molecular compounds and is extensively used as a powerful analytical tool for analysis of carbohydrates, lipids and other thermally labile biomolecules such as peptides, proteins or nucleic acids (Cotter, 1992; Chait and Kent, 1992; Hillenkamp et al., 1991).
14.3.5 Matrices used in MALDI-MS
Matrix and sample solutions are mixed prior to laser exposure, spotted on a solid metallic surface, and allowed to dry before submitting them to MALDI. The most commonly used matrices are: (a) α-cyano-4-hydroxycinnamic acid, (b) 2,5-dihydroxybenzoic acid, (c) sinapinic acid and (d) 3-amino-4-hydroxybenzoic acid. These matrices are characterized by high absorptivity of the laser radiationand the capability of forming fine crystalline solids during sample/matrix drying. In general, the more fine-grained and homogeneous the morphology of crystals formed with the analyte/matrix mixture, the more intense is the MALDI mass spectrum of the analyte.
It is essential for successful analysis by MALDI-MS to have suitable sample preparation conditions (Cohen and Chait, 1997; Vorm and Roepstorff, 1994) because the quality of the crystal formation depends on the matrix and solvent and affects the sensitivity of analysis (Zhang et al., 1999). Although MALDI is more tolerant to the presence of buffers and salts than ESI, higher concentrations of these additives may adversely suppress the ionization by affecting the matrix crystal formation and the important interactions of the sample molecules with matrix crystals.
14.3.6 Mass analyzers
Ionization of molecules produces molecular and fragment ions which are formed in the source region of a mass spectrometer and moved into a mass analyzer by an electric field. The mass analyzer separates these ions according to mass-to-charge ratios (m/z values), and the detected ions are used to generate a mass spectrum providing molecular mass and structural information. The selection of a mass analyzer depends upon the resolution, mass range, scan rate and detection limits required for a given application. Each analyzer has very different operating characteristics, and the selection of an instrument involves important tradeoffs.
Analyzers are typically described as either continuous or pulsed. Continuous analyzers include quadrupole filters and magnetic sectors. These analyzers are similar to a filter or monochromator used for optical spectroscopy. They transmit only ions with a single or selected set of m/z values to a detector, and the mass spectrum is obtained by scanning the mass range so that different ions are detected. Even though a certain m/z is selected, all ions at other m/z ratios are lost during the very brief time of detecting that particular m/z, thus decreasing the signal to noise ratio (S/N) for continuous analyzers. Single ion monitoring (SIM) enhances the S/N by setting the mass spectrometer at the m/z for a single ion (or a few ions) of interest. Since the instrument is not scanned, the S/N improves, but information about other ions is lost.
Time-of-flight (TOF)
TOF mass analyzers have in principle an unlimited mass range and high sensitivity because all ions can be recorded without scanning. A TOF mass analyzer consists of an ion source, a field-free drift chamber held under high vacuum and a detector (Fig. 14.3). Although ions generated in the source have different masses, they nevertheless are accelerated to the same kinetic energy (KE), and as a result they drift with different velocities and reach the detector at different times. In short, ions arrive at the detector with the KE obtained from the potential energy of the electric field in the source. Since the KE of ions with mass m is equivalent to the potential energy of the electric field = mv2/2, ions travel with velocities v that are equal to (2KE/m)1/2. Therefore ions with the same KE and different masses traverse the analyzer within a time that depends on their m/z values. A detector positioned at the end of the analyzer drift tube measures the arrival time of ions, which enables calculating their masses. In short, ions with lighter m/z will have greater velocity than ions of heavier m/z (Fig. 14.3) (Guilhaus, 1995; Skoog et al., 1992). Although the resolving power of simple TOF instruments is low, they provide the opportunity to measure masses of biomolecular complexes that include even whole viruses.
Two approaches have been developed to increase mass resolution and accuracy of TOF analyzers. The first is referred to as delayed extraction, in which a time delay is introduced between ionization and the extraction potential. However, optimal focusing can only be achieved for a narrow m/z range. The second approach is the introduction of a series of evenly spaced electrodes, a reflectron, at the end of the linear flight tube (Mamyrin, 2001). The electrodes allow the more energetic and less energetic ions of the same mass and charge to arrive at the detector at the same time. This allows much sharper mass peaks with relatively better signal-to-noise ratios.
Ion traps
There are two principal ion-trapping mass analyzers: quadrupole ion trap (QIT, dynamic trap) and ion cyclotron resonance (ICR) mass spectrometers (static trap). Both operate by storing ions and manipulating them by using DC and radio frequency (RF) electric fields in a series of carefully timed events.
Quadrupole ion trap (QIT)
A QIT is a three-dimensional, dynamic ion storage device (Fig. 14.4). It consists of three electrodes: two end caps and a ring electrode. Analytical use of ion traps relies on storing ions and then ejecting them in a mass-selective manner. Spacecharge effects initially limited the inherent dynamic range of the ion trap. Therefore, the method of automatic gain control was introduced, which incorporated two ionization stages into a scan function. In short, an additional pre-scan is performed to determine the total ion signal, which is then used to calculate the optimum ionization time for the second, analytical ionization event. Overall, ion traps have experienced a broad range of applications, due to their high sensitivity and selectivity, ability to perform multi-stage MS experiments (MSn) and compact size. Ion traps have been successfully interfaced with many ionization sources, i.e. atmospheric pressure ionization, ESI and laser desorption (Barinaga et al., 1994; Doroshenko and Cotter, 1994 and 1996). Moreover, it isthe analyzer of choice in many hybrid MS configurations, i.e. QIT-TOF, magnetic sector-QIT, etc. (Jonscher and Yates, 1996; Fountain et al., 1994; Qian and Lubman, 1995; Zerega et al., 1994; Todd, 2005).
Linear ion trap (LIT)
Linear, or 2D, ion traps (LIT) are relatives of QIT mass filters that resemble quadrupoles, except that additional DC potentials allow trapping of ions along the long axis. LIT is a square array of four hyperbolic rods, in which opposite rods are connected electrically. Scanning is performed through a ramping protocol that ejects ions either radially (e.g. model LTQ, Thermo-Fisher, Fig. 14.5(a,b)) or axially (e.g. model Q-trap, ABI/MDX-Sciex, Fig. 14.6). A major advantage of the 2D traps is that they possess greater trapping volumes and can thus analyze more ions per cycle, with concomitant improvements in sensitivity and dynamic range.


2D linear ion trap
A 2D LIT in the LTQ is comprised of four parallel hyperbolic shaped rods, segmented into three sections. Ions are trapped radially in a RF electric field and axially in a static electric field using DC voltages (Fig. 14.5(a,b)). Application of appropriate voltages to all three segments generates a homogeneous fieldthroughout the trapping region. Mass analysis using the Finnigan LTQ involves ejecting the trapped ions in the radial direction through two parallel slots in the center section of the LIT. A detector is placed on either side of the trap to maximize ion detection sensitivity.
The voltage programming versatility of a 2D LIT allows many applications, such as tandem-in-time MS experiments (MSn), selected ion monitoring (SIM), selected reaction monitoring (SRM) or consecutive reaction monitoring by using MSn scan mode of operations.
FTICR-MS
A Fourier transform (FT)ICR mass spectrometer measures mass indirectly by oscillating ions in a strong magnetic field. While the ions are orbiting, an RF signal is used to excite them. Because these ions will oscillate as a function oftheir m/z, measuring the frequency of these oscillations allows inference of m/z by using an FT. These instruments provide the highest mass resolution of all mass spectrometers in combination with highest mass accuracy. However, they are limited to expert-only laboratories due to the need for a large superconducting magnet and the concomitant requirement for liquid helium and nitrogen.
Orbitrap
The Orbitrap also uses an FT-based strategy to measure the m/z of ions. However, the trapping is performed electrostatically (as opposed to magnetically) and the frequency oscillations are measured along the long axis of the trapping cell. Moreover, the Orbitrap is an effective mass spectrometer with mass resolution surpassed only by FTICR, and achieves it by using a much simpler, compact design. The potential advantages of the Orbitrap include: (a) a high mass resolving power (up to 200 000), (b) increased space-charge capacity at higher masses due to the independence of trapping potential and larger trapping volume (in contrast to FTICR and quadrupole traps), (c) high mass accuracy (1–2 ppm), and (d) high dynamic range (around 5000) (Makarov et al., 2006a, b).
14.4 Mass spectral proteomic methods
Proteomics mass spectrometry (MS) characterization of a microorganism largely consists of the top-down and bottom-up methods of creating charged peptides from proteins that ultimately are used in the in silico analysis of the vast protein milieu in a microbial cell. Once they are detected, intensive bioinformatics and data analyses are performed in order to characterize the proteins themselves and/or to detect and identify the host microbe. In general, MALDI-TOF-MS methods usually rely on the top-down concept while the LC-ESI-MS/MS methods historically provide bacterial and protein structural analyses and identification information from bottom-up applications. These two methods are presented from the perspective of advantages and disadvantages as they relate to practical applications on microorganism proteins in isolation or in mixtures.
14.4.1 Top-down method
Advantages
Overall, this technique can be thought of relatively as a global interrogation method with respect to a particular protein. A tandem mass spectral analysis is produced by electron capture dissociation (ECD) or electron transfer dissociation (ETD). Thus, it is not necessary to use enzyme or chemical cleavage techniques for fragmentation of a protein or peptide. Even though ECD and ETD are the preferred methods to reduce a protein into peptides more amenable to mass spectral analysis, they are relatively low in collision-induced dissociation (CID) efficiency. Characteristics of a protein that can be gleaned from this method include structural elements, primary structure, post-translational modifications (PTM) status, PTM stoichiometry and protein isoforms. The method is especially suitable for large peptides and multiple phosphorylated sites on a protein that does not contain convenient amino acid residue sites for enzymatic cleavage. The mass of the intact protein can be directly obtained, and the amino acid residue sequence coverage is usually much better than with bottom-up techniques. The area of protein quantification is well suited to this technique. Top-down analysis is convenient for identification of protein(s) in a gel electrophoresis band and is very useful for molecular imaging.
This technique is somewhat unique in its database constitution, because it can use databases containing proteins and their PTM variations instead of just the peptide/protein sequences. Lee et al. (2009); Ning et al. (2011); Borchers et al. (2006); Chen (2008); Yates et al. (2009); and Kellie et al. (2010) provide details and example problems for the top-down analyses of proteins.
Disadvantages
There are quite a few limitations that are consistently present in a top-down analysis of a protein. High resolution, high mass accuracy, high sensitivity, andhighly purified protein preparations or very simple mixtures are required. Therefore, the complexity of a protein mixture must be kept low by suitable physical fractionation methods prior to ECD or ETD processes. Unfortunately, efficient methods of CID analysis that provide a worthwhile efficiency of protein fragmentation are not yet commercially available. Even though this method is useful for relatively higher molecular weight proteins than can be used for bottom-up analysis, 50 kDa molecular weight proteins appear to be a limiting mass at the present time.
As stated above, the typical top-down approach is limited to a single or a simple mixture of proteins, and another reason for this limitation is the multiple charging phenomenon of the precursor ion. Tandem MS/MS produces product ions of multiple charge states and populates the neutral species into low-intensity ions over multiple m/z states. The determination of product ion masses from multiply charged species is usually difficult because of the low mass resolution at the relatively high masses. Therefore, the requirements for relatively large amounts of sample and accurate mass resolution are apparent because of the relatively poor efficiency of the MS/MS process for the generation of large peptide and protein ions. Further, the process of multiply charged ion fragmentation is poorly understood for large peptides and proteins in general.
It is difficult to interface the top-down method with on-line separation techniques, and usually very expensive MS systems are required, such as the Orbitrap and FTICR MS systems. Another limitation is that bioinformatics data analysis methods are primitive compared with those of bottom-up methods. References by Lee et al. (2009); Chen (2008); Yates et al. (2009); Kellie et al. (2010) and Wehr (2006) expand on the disadvantages of the top-down analyses of proteins.
14.4.2 Bottom-up method
Advantages
In this technique, the main point is as complete as possible a sequential amino acid residue elucidation of the protein primary sequence of the product ions generated from the peptides formed by enzyme or chemical cleavage of the protein(s). This technique does very well with complex protein mixtures where hundreds of thousands to possibly a million peptides may be formed in a bacterial protein extract. Enzyme or chemical cleavage of the many proteins forms peptides, and they can be ionized in most cases with only one charge. Occasionally a doubly charged ion species forms, but, because of the relatively low molecular mass of the peptides, this phenomenon is usually minimal in a typical LC-MS/MS experiment with a complex protein mixture. Lower molecular weight peptide masses result in higher sensitivity for the bottom-up method. Relatively fewer purification steps are required for this method, because the removal of salts and detergents is relatively easier with small peptides than with larger peptides and protein species.
This method is amenable to high-throughput coverage of peptide sequences resulting from the proteins with MS/MS and ‘shotgun’ proteome concepts. This happens because processes and devices to separate peptides are more mature than those for the separation of proteins. This method is most commonly used for fragmenting and identifying proteins through their peptide generation.
Another important concept is that this mature, somewhat refined method is also amenable to bioinformatics data analysis techniques. The bottom-up method produces the type of peptide sequence data that has spawned many software packages for the handling of the complex LC-MS/MS peptide sequence data. It should be noted that the output of such an analysis is mainly the detection of protein(s) and their identification from a database. References by Lee et al, (2009); Borchers et al. (2006); Chen (2008); Yates et al. (2009); Wehr (2006) and http://www.genomeweb.com/proteomics/john-yates-top-down-versus-bottom-subtractive-proteomics provide further details on the bottom-up analysis of proteins.
Disadvantages
The bottom-up approach is not without its drawbacks. The method initially requires a biological consumable in the form of specific enzyme(s) and/or chemical compounds to cleave the protein or protein mixture. An amount of time is required, from minutes (immobilized enzyme on a column) to many hours (enzyme in solution which cleaves the proteins). These materials usually cleave the proteins at specific amino acid residue sites for a robust bioinformatics analysis. However, only a small percentage of the total sequences for a protein mixture are usually realized, and labile PTMs are usually lost in the cleavage processes. Proteins that originate from alternative splicing processes are difficult to detect and characterize. Compared with top-down methods, the mass range addressed is somewhat limited because of the relatively low molecular weight of the peptides generated from the enzyme and chemical processes. The actual mass of a protein is indirectly accessed by the in silico synthesis of the protein from the many overlapping peptides.
Several peptides are usually required to identify a particular protein from the protein database, because many proteins have common and/or identical peptide sequences. Narrow LC peak widths can limit the number of product ion spectra actually acquired. Another drawback is the time of an analysis, because LC separation techniques usually require hours for a comprehensive separation of the many peptides generated by cleavage reactions.
The protein database used may not reflect PTMs that are naturally present in the protein(s) from the bacterial mixture. When peptide mass fingerprinting (PMF) is used rather than residue coverage, a single or simple mixture of proteins is necessary. References by Chen (2008); Yates et al. (2009); Kellie et al. (2010); Wehr (2006) and http://www.genomeweb.com/proteomics/john-yates-top-down-versus-bottom-subtractive-proteomics expand on the disadvantages on the top-down analyses of proteins.
14.5 Computational and bioinformatics approaches for data mining and discrimination of microbes
In the MS analysis of microorganisms, huge amounts of data are acquired; therefore, specific algorithms are required to analyze, summarize and interpret the conventional and/or tandem MS data. Commonly used computational methods and algorithms are suitable for mining mass spectral data and inferring the presence, taxonomic position and identity of microbial agents. These algorithms are usually implemented in the form of diverse software tools, which are commercially available or were developed by research groups involved in the MS-based detection and identification of proteomes.
14.5.1 Bacteria classification using pattern recognition approaches
The most frequently used unsupervised pattern recognition methods include hierarchical cluster analysis (HCA) and principal components analysis (PCA), while supervised algorithms such as artificial neural networks and partial least squares (PLS)-discriminant analysis (PLS-DA) represent more recent approaches. During PLS-DA the PCs are rotated to generate latent variables (LVs), which maximize the discriminant power between different classes in comparison to the total mass spectral variance used in PCA. Therefore PLS-DA usually gives greatly improved class separation (Karp et al., 2005).
14.5.2 Multivariate linear least squares regression
A relatively simple approach for the processing of MALDI-TOF-MS spectra is represented by a Threat Identification and Detection System (TIDS) software, created by the Johns Hopkins University Applied Physics Laboratory (APL) to automatically detect and characterize mass spectral signature lines (Hayek et al., 1999). Algorithms of the TIDS software work on known, and partially unknown, mass spectral signatures. For known signatures, an intensity vector is formulated to estimate the similarity of the measured spectrum with a combination of stored library spectra of the biological species of interest. It was achieved by using a multivariate linear least squares regression analysis of the unknown spectrum to a spectra library. For partially unknown signatures, a Bayesian probabilistic approach was used to relate the variable signature of a bacterial threat to likelihoods of chemical composition of bacterial lipids capable of classifying agents on the basis of their chemical (i.e. phospholipid) content (Hayek et al., 1999).
Hierarchical cluster analysis (HCA)
In HCA, distances between sample data points are calculated and used to form a 2D plot that represents connectivity and clusters in the data set. This is accomplished by grouping together the samples that are closest in multidimensional space until all groups are finally merged into one tree-like structure known as a dendrogram.
HCA was used to generate bacterial grouping dendrograms on the basis of diverse molecular signatures. For example, Goodacre et al. (2004) used HCA to reveal bacterial groupings based on pyrolysis (Py)-MS data, while Wilkes et al. (2005a, 2005b) demonstrated that pattern recognition systems applied to Py-MS data of bacterial cells were able to distinguish strains that differed in serotype, antibiotic resistance phenotype and pulsed-field gel electrophoresis patterns. Many other researchers applied this simple technique to discover clustering of microorganisms based on signatures acquired during MALDI-TOF analyses of whole bacterial cells or through comparisons of genomic/proteomic sequences (Dworzanski et al., 2006; Ecker et al., 2006).
Teramoto et al. (2007) reported the successful classification of Pseudomonas putida strains by MALDI-MS of ribosomal proteins, followed by phylogenetic classification based on cluster analysis of a binary biomatching table constructed from mass spectra. Dworzanski et al. (2006) and Deshpande et al. (2011) used peptide sequences identified during proteomic experiments to generate a binary matrix of sequence-to-bacterium assignments (SBA). The resulting matrices were further processed to classify and potentially identify a bacterium using HCA and PCA methods to determine the taxonomic position of an unknown sample (Fig. 14.7).
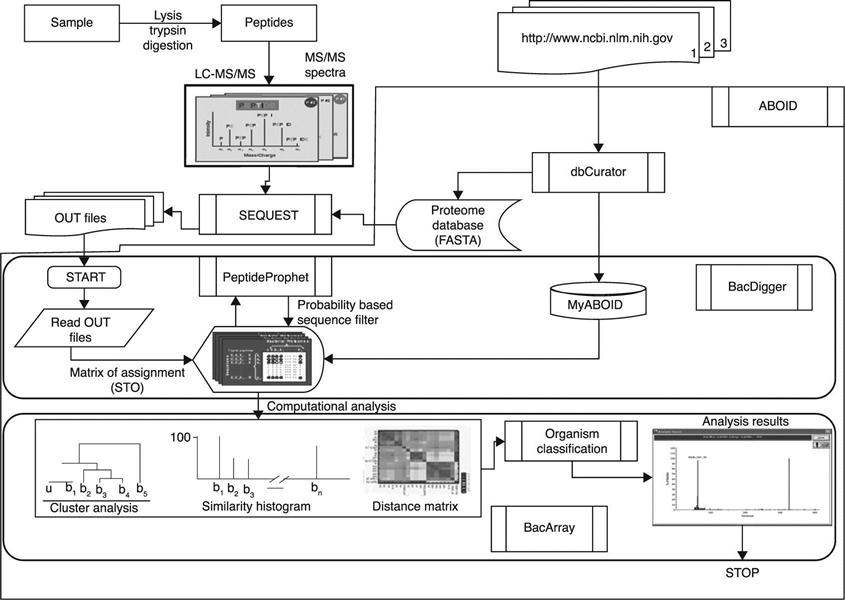
The logic of a data processing workflow example is shown in Fig. 14.7. During the analysis of an unknown bacterium, database searches with uninterpreted MS/MS spectra of peptide ions produce peptide sequences, which can be validated using probability criteria. Each column vector represents a peptide profile of a bacterium, while each row vector represents a phylogenetic profile of a peptide sequence. Thus, for each LC-MS/MS analysis, a matrix of SBAs is created with entries representing the presence or absence of a given peptide sequence in each bacterial theoretical proteome.
HCA can be performed using diverse linkage methods (e.g. single, complete, Ward’s) and similarity measures (e.g. squared Euclidean distances).
Principal components analysis (PCA)
The rationale of the PCA method is the linear transformation of the original variables into a set of vectors or PCs. They are uncorrelated with each other and may be represented as an orthogonal system of axes, denoted PC1, PC2 … PCn, that respectively correspond to a decreasing order of the amount of variance (information) in the data set. For instance, a spatial representation of inter-strainsimilarities or distances of analyzed bacteria in the data space of PC1 to PC3 (PC1-3) can be presented as a 3D plot. That data can provide evidence of distinct clusters of points representing bacteria for visual inspection.
PCA of a covariance matrix obtained from an SBA (assignment) matrix (Fig. 14.7) and projections of microorganisms into the data space of the three PCs with the highest eigenvalues were used to evaluate the observed groupings. This approach provided the final groupings of unknown bacteria to database microorganisms (Dworzanski et al., 2006).
14.5.3 Tools for rapid analysis of mass spectra acquired during bottom-up proteomics experiments
Recent advances in protein identification methodologies that are mainly based on assigning peptide sequences to mass spectra rely on the development of computational approaches that use sequences of known proteins found in publicly available databases. In these approaches, spectra of peptides obtained by proteolysis of microbial proteins are compared with theoretical spectra calculated from protein or DNA sequence databases. To correctly categorize the peptides leading to identification of proteins and their sources, i.e. bacteria, viruses or toxins, a huge database has to be processed. Therefore, robust computational capabilities are needed to reduce processing time. There exist a large number of suitable algorithms for matching spectra (Sadygov et al., 2004). In general, search engines operate by matching a specific pattern of peptide fragment ions in the experimental spectra obtained from unknown peptides with theoretically predicted spectra obtained from the protein sequence database. Therefore, the general principle is that these database search engines assign a score between a peptide and a product ion mass spectrum. In this way, virtually each spectrum gives a match to an amino acid sequence in the database. The central issue is how to reliably and automatically control the quality of these assignments to eliminate the false positives. Two aspects have to be dealt with: (a) a pre-filter has to be applied to remove potentially unidentifiable mass spectra, thereby reducing the computational overload, and (b) filtering of potentially false positive matches between an experimental and theoretical mass spectrum. Under these circumstances, a statistical framework is needed, which would estimate the efficiency and significance of the filtering expressed in terms of the error rate and sensitivity.
SEQUEST
The first algorithm/software application developed to identify proteins by matching MS/MS spectra to database sequences is SEQUEST (Eng et al., 1994) SEQUEST correlates uninterrupted tandem mass spectra of peptides with amino acid sequences from protein databases. SEQUEST connects each tandem massspectrum not only to a protein but also to an organism that synthesized that protein. It uses two scoring functions. The first one is used to rapidly determine a few hundred peptide candidates for each spectrum (preliminary score, Sp) while the second uses cross-correlation of the experimental and theoretical spectra (Xcorr). The preliminary score takes into account the sum of matched fragment ion intensities, the number of total and matched fragment ions, and the factor that rewards continuity of matching for each ion series (b and y ions). The final score is achieved by converting the expected masses of fragment ions predicted for any database peptide into a theoretical spectrum and by computing a cross-correlation between the theoretical spectrum and the experimental spectrum. In addition, SEQUEST exports the normalized difference between the best and the second- best scores (delta Cn), which is useful to determine match uniqueness relative to near misses for a given database.
MASCOT
MASCOT was developed by Matrix Science, UK (http://www.matrixscience.com) and was described by Perkins et al. (1999); nevertheless, the scoring used by this software application has never been published or patented. It is known that it involves the selection of two fragment ion types, where most fragment ion matches are observed, and a probability-based score computed by using these fragments. However, pre-processing of the experimental mass list is also a part of this algorithm, and the final score is the negative logarithm of a p-value. The probability-based scoring algorithm has a number of advantages because a simple rule can be used to judge whether a match result is significant or not. This is particularly useful in guarding against false positives. Furthermore, MASCOT scores can be compared with those from other search engines, and search parameters can be readily optimized by iteration.
14.5.4 Bioinformatics platform for identification and comparative analysis of microbial agents using peptide MS/MS: identification of agents of biological origin (ABOID)
Currently, the National Center for Biotechnology Information (NCBI) database displays more than 2652 bacteria that have been fully sequenced, and hundreds of sequencing projects are in progress. Completely sequenced genomes provide amino acid sequence information for every protein potentially expressed by a test organism. Hence, the combination of this resource with MS technologies capable of identifying amino acid sequences of proteins enables one to design new procedures for the classification and identification of bacteria based on querying proteomic sequences. Although the MS/MS-based sequencing of peptides by using database search engines or by de novo sequencing of peptides is a commonpractice (Aebersold et al., 2003), it is still a challenging task to translate the raw data generated from MS/MS experiments into a biologically meaningful and easy-to-interpret set of results suitable for identification and classification of microorganisms with high confidence.
Recently a suite of bioinformatics tools was developed by Deshpande et al. (2011) for the rapid classification and potential identification of bacteria based on the peptide sequence information generated from LC-ESI-MS/MS analyses of tryptic digests of bacterial proteins. This method consists of an integrated and automated software approach for rapid identification of agents of biological origin (ABOID). In short, this algorithm transforms results of searching product ion mass spectra of peptide ions against a custom protein database, performed by commercially available software (e.g. SEQUEST), into a taxonomically meaningful and easy-to-interpret summary output. To achieve this goal, a protein database was constructed in a FASTA format that consists of theoretical proteomes derived from all fully sequenced bacterial genomes. Each protein sequence in this database was supplemented with information on a source organism and the chromosomal position of its respective open reading frame (ORF), and linked to the microbial taxonomy database.
ABOID analyzes SEQUEST search results files and computes probabilities that peptide sequence assignments to product ion mass spectra (MS/MS) are correct (Fig. 14.8). In the next step, these probability scores are used to filter out low-confidence peptide assignments by selecting a suitable value for a ‘threshold cutoff’ parameter. Further, ABOID calculates assignment error for the accepted set of spectrum-to-sequence matches and uses these high-confidence assignments to generate an SBA binary matrix. These SBA matrices show validated peptide sequences, which are differentially present or absent in various strains being compared and could be visualized as bitmaps (Fig. 14.9(a)). The bacterial classification and identification algorithm uses assignments of organisms to taxonomic groups based on a scheme that begins at the phylum level (Fig. 14.9(b–d)) and follows through classes, orders, families and genera down to the strain level (vide infra). In addition, the number of peptide assignments to database organisms can be displayed as a similarity histogram (Fig. 14.9(e)).


In Fig. 14.9(a–e), a data analysis pathway used for the analysis of a bacterial mixture composed of E. coli and Bacillus cereus cells is presented. In this example, the SBA matrix (Fig. 9(b)) was analyzed by computing the merged proteomes of bacteria grouped into ‘super-proteomes’ of 13 phyla represented in the database. The results shown in Fig. 9(b) indicate that 98 unique sequences were assigned to the phylum Proteobacteria while 99 were assigned to Firmicutes. These results confirm the presence of a mixture of bacteria and allow the classification of these organisms to the lower taxonomic levels. The assignment sub-matrices were analyzed separately, and the results are shown in Fig. 9(c,d) as dendrograms representing results of cluster analyses.
The results of a data mining process applied to an analysis of a bacterial mixture composed of seven bacterial strains are displayed in Fig. 14.10. In this case all seven strains analyzed by LC-ESI-MS/MS and ABOID were correctly identified.

The ABOID algorithm was developed using MATLAB and Microsoft Visual Basic, while the phylogenetic classification module is incorporated into the data analysis and data warehousing software (Deshpande et al., 2011). In summary, ABOID examines a large number of peptide sequences from a single LC-ESI-MS/MS analysis of a bacterial protein digest for rapid classification and identification of pure bacterial cultures as well as microbial mixtures.
Protein databases
MS-based methods for protein identification depend on the availability of a protein database for the investigated organism, because the uninterpreted product ion mass spectra of peptide ions should be matched to database sequences of predicted proteins (Aebersold, 2003). Although the de novo interpretation ofproduct ion mass spectra of peptides can reveal amino acid sequences (Standing, 2003), they are also used as a query by database search programs based on sequence similarity (e.g., FASTA, BLAST and MS BLAST) (Wheeler et al., 2003; Habermann et al., 2004; Shevchenko et al., 2002; Zhong and Li, 2005). However, this approach also allows cross-species protein identification if sequences from homologous proteins of closely related organisms are included in a database (Liska and Shevchenko, 2003).
The availability of approximately 1928 fully sequenced microbial genomes (as of 20 March 2012), together with more than 5230 microbial genome sequencing projects in progress, provides an unprecedented resource for proteomics studies, because protein databases are derived from genomic sequences. In fact, aminoacid sequences in these databases represent a conceptual translation of nucleotide sequences in computationally determined ORFs that potentially encode proteins. For clarity, ORFs should be understood as a computationally predicted section of a DNA sequence that begins with an initiation codon and ends with a stop codon. Therefore, each ORF has the potential to encode a single polypeptide that may be expressed as a protein; however, many may not actually do so. Furthermore, a protein should be understood as one of many isoforms representing the expressed and matured gene product that may be substantially different from a polypeptide specified by a nucleotide sequence. Generally, these differences are not rare, and originate mainly from co-translational modification or PTM of a nascent polypeptide. Co-translational modification refers to the removal of N-terminal methionine by N-methionylaminopeptidase and affects the majority of bacterial proteins. PTMs comprise both the proteolytic processing of a polypeptide and covalent modification(s) of its amino acid(s) (Hesketh et al., 2002). Therefore, the available database searching algorithms, in fact, identify ORFs as not coding for mature proteins. Moreover, during analysis of an unknown bacterium, the confirmation of the full amino acid sequence or ‘100% coverage’ of a potential protein would be required for the identification of an ORF. Although this requirement may be relaxed under certain conditions, such as the proteomic analysis of a known bacterial strain with a fully sequenced genome, the true identification of proteins is rarely achievable during high-throughput analyses of bacterial proteomes.
Identification of proteins in high-throughput analyses
There are many reasons why true identification of proteins during high-throughput analyses rarely occurs, and they may be divided into two categories. The first includes factors associated with sample preparation, peptide ionization and MS fragmentation processes, while the second category includes biological factors such as PTMs. For example, most exported proteins are synthesized as precursors with an N-terminal signal peptide that is removed during the translocation process. Although a signal peptide sequence is present in a database ‘protein’, the theoretically expected tryptic peptides of such protein will not be produced from an analysis of the expressed proteins. Although this and other common proteolytic modifications do not change amino acid s equences in polypeptide products, there are numerous exceptions to this rule. For example, some bacterial proteins contain internal segments of amino acids (called inteins) that self-catalyze their excision and ligate the flanking fragments by a peptide bond. In this process, which is analogous to the excision of introns on the m-RNA level, two new proteins are formed: a mature host protein and the free intein (Amati et al., 2003). Furthermore, although introns were assumed absent in genes coding for bacterial proteins, such intervening sequences were reported recently in Clostridium difficile (Braun et al., 2000), Bacillus anthracis (Ko et al., 2002) and Actinobacillus actinomycetemcomitans (Tan et al., 2005).
Although PTMs of amino acids do not change their sequence, they ‘decorate’ proteins by specific covalent attachments that add extra mass. The most frequently occurring PTM appears to be phosphorylation, which is an important regulation mechanism controlled by phosphorylating and dephosphorylating enzymes (kinases and phosphatases, respectively). However, many other PTMs have been widely documented, including N-acetylation, methylation, thiomethylation, adenylation, glycosylation and myristoylation, which are common mechanisms for modulating structural and functional properties of bacterial proteins (Benz and Schmidt, 2002). In summary, it is not surprising that molecular weights and full amino acid sequences of proteins predicted from the annotated ORF are only in rare cases actually observed at the level of the expressed proteins (Wang et al., 2002a).
14.6 Peptide mass fingerprinting (PMF) and matrix-assisted laser desorption/ionization-tandem mass spectrometry (MALDI-MS/MS) of peptides
The full characterization of a protein primary structure may benefit from emerging technologies based on a top-down MS approach. In this approach, an accurate measurement of relative molecular weight value for an intact protein is combinedwith the direct dissociation of protein ions into fragment peptide ion information. These pieces of information are combined to yield data suitable for the identification of proteins (Kelleher, 2004; VerBerkmoes et al., 2004).
When proteins are over-expressed in a bacterial cell, a separation step may be eliminated and the basic PMF technique can be applied directly to the whole cell protein digest. This approach takes advantage of the preferential ionization of peptides from the MALDI target. For MALDI-MS mass mapping analyses, either the intact bacterial cell or the protein extract can be subjected to protease (usually trypsin) digestion and analyzed without purification and pre-separation steps. Halden et al. (2005) presented a study on the PMF of Gram-negative Sphingomonas wittichii strain RW1 that targeted a specific substrate-induced enzyme within the organism. Cells of S. wittichii were sonicated, and the centrifuged protein supernatants were treated with trypsin, followed by MALDI-MS analysis. PMF analysis was used to ascertain the presence of the targeted enzyme. In silico peptide mass tables of protein subunits were generated and were compared with experimental mass spectra. PMF analyses of the environmental cultures did not produce a match to the S. wittichii in silico database.
The PMF concept was augmented by Warscheid and Fenselau (2003) in an investigation of the family of small acid soluble proteins (SASP) of Bacillus species. The on-probe digestion of spores from Bacillus species with immobilized trypsin cleaved the proteins into peptides. These peptides were used for microsequencing using tandem MS techniques and standard database searches. This in turn produced a table of identified SASPs that are proteins in the 6600–9200 Da range. The relatively limited set of SASPs could provide distinguishing capabilities for B. cereus, B. thuringiensis, B. subtilis, B. globigii and B. anthracis Sterne. Mixtures of the Bacilli could be distinguished from the unambiguous sequencing of selected peptides.
This work was followed by the production of a custom-made database comparing the in silico trypsin digestion peptides from all SASPs contained in the on-line database of Bacilli and Clostridia organisms (English et al., 2003). Experimentally generated peptide sequences of extracted SASPs from bacterial samples were searched in the SASP database. Analysis of the p-values was used to test for false matches. B. cereus T, B. thuringiensis kurstaki and B. anthracis Sterne were shown to have distinguishing peptides, while B. globigii proved to have no discriminating peptides. This work used only a TOF-MS analysis. A QIT TOF system increased the resolving power of the precursor peptide masses (Warscheid et al., 2003) such that full on-line protein database searches provided distinguishing peptide features for all three bacteria in a mixture of B. thuringiensis kurstaki, B. globigii and B. subtilis as well as in a mixture of B. cereus, B. globigii and B. subtilis. The ion trap allows a greater density of peptides to be collected before the TOF analysis, and, as such, an increased number of different types of peptides emerged.
14.6.1 Bacterial mapping using MALDI-MS
MALDI-TOF-MS has been widely employed in the analysis of bacterial constituents, including proteins (Krishnamurthy et al., 1996; van Baar, 2000). The literature focuses on the use of MALDI-TOF-MS (Fig. 14.13) for near real-time discrimination between bacterial species (Fenselau and Demirev, 2001; Lay, 2001). Initial studies represented chemotaxonomic approaches to using patterns of masses deduced from MALDI spectra for bacterial strain identification. Such ‘mass fingerprints’ are dominated by singly ionized protein species; therefore, they were usually matched against reference libraries containing experimentally determined protein masses (Bright et al., 2002) or theoretical protein masses calculated from genomic sequences of microorganisms (Demirev et al., 2001). Although the latter approach represented an effort aimed at linking a genome and its corresponding proteome by MS, post-translational and sample -elated modifications may change the mass of genome-predicted polypeptides and therefore do not allow the reliable identification of proteins. However, strain- specific protein mass profiles revealed by MALDI-MS still provide an attractive way to generate phenotypic characteristics that are suitable for typing the investigated strains. Because these approaches typically involve training of an expert system on relatively small sets of organisms, it is difficult to predict the general applicability of the identified biomarkers.
The applications of MALDI-MS methods for profiling whole bacterial cell proteins are represented by bacterial sample processing methods for reproducibility and consistency issues, methods designed for mass spectral characterization and differentiation of bacteria, and whole cell characterization through MALDI- FTMS analysis of microbes (vide infra).
14.7 Analysis of MALDI-MS spectra
14.7.1 Visual fingerprint
Diverse data analysis methods are used to transform the MALDI mass spectral data into meaningful information. Initially, the simplest form of data analysis is a visual determination of replicate mass spectra of the same organism, with a comparison of spectra from different organisms. This necessarily requires that either a series of masses are unique for a given bacterium relative to a set of different bacterial mass spectra, or the intensity distribution is markedly different for the same set of masses between different bacterial mass spectra. For instance, Cain et al. (1994) showed the presence of similar masses but at significantly different intensities for different species of Pseudomonas. Holland et al. (1996) showed that the spectra of the putida, aeruginosa, and mendocina species of Pseudomonas have similar as well as different masses. Krishnamurthy et al. (1996) showed that protein extracts of Bacillus anthracis Sterne, B. thuringiensis and B. cereus displayed similar mass spectral masses and intensities. Haag et at. (1998) presented distinctly different MALDI mass spectra for four different Haemophilus species. Differentiation of each culture was feasible by visual analysis of the mass spectral fingerprints.
14.7.2 Spectral cross-correlation
Arnold and Reilly (1998) took the MALDI mass spectral analysis of bacteria one step further and essentially automated the manual, visual fingerprint approach. Mass spectra were evaluated in pairs by the standard cross-correlation method. However, the mass spectrum of a bacterium was divided into mass intervals, and each interval was cross-correlated with that of a different bacterial spectrum. A spectrum from m/z 3500 to 10 000 was divided into 13 intervals consisting of 500 Da in each interval. The product of the 13 cross-correlation values between a pair of spectra defined the final composite correlation index. Visually similar spectra were differentiated using the cross-correlation technique for strains of E. coli. A fundamental tenet of microbiological taxonomy states that many strains of a bacterial species should be investigated for a satisfactory differentiation of a particular species with other species in that genus (Dickinson et al., 2004; Fox, 2006). With this in mind, 25 strains of E. coli were examined and showed distinct differences when cross-correlated with four select E. coli strains. Same-strain correlation provided high similarity coefficients, and that of different strains yielded relatively low similarity coefficients. The cross-correlation technique was used to monitor the general change in mass spectra during the growth and stationary phase of a bacterial culture (Arnold et al., 1999). Successive spectra provided high or low correlation values. A single plot of the correlation values provided a dynamic impression of the mass spectral changes over a 50 h growth period for E. coli cultures.
14.7.3 MALDI-MS and molecular biology techniques
The general concept of analyzing many strains of a particular bacterium for classification and identification purposes was continued for a very different application. Twenty-three isolates of B. pumilus were examined from different locations in spacecraft assembly areas in the Mars Odyssey spacecraft and the International Space Station by Dickinson et al. (2004). In addition, MALDI mass spectral data were compared with the results of 16S ribosomal DNA (rDNA) sequence analysis, DNA-DNA hybridization and Biolog bacterial enzyme analyses. Cross-correlation was performed on the B. pumilus isolates and ten other Bacillus species to test for their differentiation. Twenty replicate mass spectra were obtained for each organism. The 18 B. pumilus strains produced relatively high correlation values with the B. pumilus ATCC 7061T isolate: all but two isolates achieved > 0.62 correlation values. Correlation values of 0–0.48 were obtained for B. pumilus isolates and the ten other Bacillus species. The Biologmetabolic fingerprinting assays produced a relatively low identification analysis for the B. pumilus isolates, and the 16S rDNA tests did not perform as well as the DNA-DNA hybridization method. MALDI-MS provided similar information with respect to the DNA-DNA hybridization tests. Both methods segregated the B. pumilus isolates into two separate groups, and the linear correlation of the mass spectra correctly classified 14 of the 16 B. pumilus isolates.
14.7.4 Automated select mass extraction
Automated extraction of selected masses was a central goal as reported by the Wahl group (Jarman et al., 1999; Wahl et al., 2002; Valentine et al., 2005). Sixty MALDI mass spectra, obtained over different days from the same sample, provided stability in the choice of masses selected to represent a bacterial genus, species and strain in the database library. Further, the database was represented by mass and intensity with respective standard deviation values to compare against unknown or submitted spectra. This technique was successfully extended to 50 mixtures consisting of two to four bacteria (Wahl et al., 2002) in doubleblind experiments performed on different days. Five replicate spectra were obtained for each sample mixture.
Cluster analysis results presented as dendrograms have been used to distinguish MALDI mass spectra for many different bacteria. These include studies of Helicobacter strains (Owen et al., 1999), 11 E. coli strains (Conway et al., 2001), 28 isolates of Staphylococcus (Walker et al., 2002), a host of Gram-positive and Gram-negative bacteria (Wahl et al., 2002), eight cultures of Mycobacteria (Hettick, et at., 2004) and the separation of smooth and rough cell surface Peptostreptococcus micros (Brookhouse et al., 1999) preparations.
14.7.5 Comparison of experimental masses with on-line database
The Fenselau group published a number of papers on the data analysis of bacteria in a systematic, refined fashion. Initially, MALDI mass spectral masses were compared with on-line bacterial protein databases without application of filter or weighting factors (Demirev et al., 1999). One strain of B. subtilis and E. coli were initially investigated with successful matching results. However, since their sheer numbers of masses in on-line databases are greater than those of most other bacteria, the statistics were skewed to the more densely populated bacterial protein databases such as B. subtilis and E. coli. This method of bacterial matching, however, may be independent of reproducibility issues, since an experimental set of masses may be found in a comprehensive protein mass database (Demirev et al., 1999). This work was refined by Pineda et al. (2000); the density of masses per unit mass interval was considered and investigations concentrated on the E. coli and B. subtilis organism databases. Analyses using the p-value estimatedthe probability of bacterial misidentification due to an accidental match between a set of experimental mass peaks and database proteins of an unrelated microorganism. The lower the p-value, the less likely the bacterial match occurred by chance. In this type of analysis, the possibility existed that the relatively low number of peaks compared with the hundreds of masses in a bacterial database may not yield robust statistics (Pineda et al., 2003).
14.7.6 Positive and negative mode MALDI-MS mass spectra
Pineda et al. (2003) crafted the experimental conditions in such a way that samples were enriched in the ribosomal proteins, which were predominately extracted and observed in the MALDI mass spectrum as intact masses. The p-values were used to test the significance of matching experimental spectra to on-line bacterial protein databases. Positive and negative mode MALDI analyses were investigated for B. subtilis, E. coli, Pseudomonas aeruginosa, Haemophilus influenzae and B. stearothermophilus. Essentially 100% correct identification of these organisms was produced in the interrogation of protein databases consisting of 38 organisms when at least 20 experimental masses per organism were obtained and searched. Model statistical considerations predicted a high rate of correct identification of the five organisms when compared with 1000 bacterial databases in the library.
14.7.7 Accurate mass assignment
Mass density considerations coupled with accurate mass assignments (Demirev et al., 2001) were shown to provide a significant and impressive identification of Helicobacter pylori when searched against bacterial protein databases. The H. pylori 26995 sample had a significance value of 0.036 (low probability of a chance match), while the J99 strain had the next best match at a value of 0.065. Note that H. pylori 26995 and J99 only have 443 and 291 masses, respectively, listed in their on-line protein databases. Most impressive were the relatively high probability misidentification values (parentheses) of B. subtilis (0.816), M. tuberculosis (0.990) and E. coli (0.998), which respectively contain 1420, 1058, and 2030 on-line protein database masses. These numbers of database masses are significantly greater than that of H. pylori, yet the algorithm parameters were able to target the correct H. pylori 26995 strain compared with the J99 strain database.
14.7.8 Experimental MALDI-MS mass database
Wang et al. (2002b) provided a fundamentally different treatise for MALDI mass spectral bacterial characterization, in that an in-house-generated database was shown to provide better matching statistics than on-line databases. Manyexperimental masses of bacteria usually are not found in the respective on-line database. E. coli, B. megaterium and Citrobacter freundii were used to test this hypothesis, and there were 2997, 55, and 47 protein mass entries, respectively, in the 2–20 kDa range in the public on-line databases. As expected, the experimental MALDI masses from all three bacteria produced E. coli as the top match when interrogated with on-line protein databases. In-house-derived experimental mass tables provided significantly better mass matching performance with bacterial MALDI mass spectra than that of on-line databases. This is especially true for on-line bacterial databases containing low numbers of mass entries. A benefit of in-house-generated databases is that they include masses that constitute PTM moieties on the proteins. This is inherent in in-house databases, while it is essentially absent from public proteome databases. Another benefit is that experimental, in-house databases include protein masses that are actually expressed at levels detected by MS, as opposed to on-line mass entries of proteins that are expressed in undetectable, very low, moderate and very high numbers of copies in a bacterial cell.
14.7.9 Microorganism differentiation
Mycobacterium tuberculosis is a pathogen, but there are a significant number of non-pathogenic Mycobacterium species. Six species, including M. tuberculosis, were investigated by MALDI-MS, and their eight replicate spectra were transformed into multivariate dataspace (Hettick et al., 2004). Discriminant and canonical variate data analyses were performed in order to differentiate among the six Mycobacterial species. Upon sample optimization, a plot of the first three canonical variate dimensions described 85% of the total variance in the data set, and all six species were easily differentiated despite the complexity of the raw spectral data. Seventy-seven masses were used as input to the canonical variate analysis. From this analysis, certain masses appeared to act as biomarker ions for five of the six Mycobacterial species. Mycobacterium species fortuitum, kansasii, intracellulare, tuberculosis and avium displayed unique ions, while M. bovis BCG provided no unique ions. However, the latter could be differentiated by the intensity distribution of the mass spectral ions.
Tao et al. (2004) provided an interesting method for the differentiation of microorganisms by using a database of biomarker masses. A database was constructed by MALDI-TOF-MS analysis of a bacterial culture between nine and twelve selected times during a growth period of 8–48 h. Ten different organisms were used to create a database. Masses were tabulated for each growth time, and it was noted when each mass appeared at each different growth time. Some masses appeared at every growth time in the exponential and stationary growth phases, and other masses appeared in only one or a few growth times. If an experimental mass was found in one or more of the database organisms, then the weight factor for that mass was annotated under each organism. All weight values for each massmatch were summed for each database organism, and the highest sum of the weight values determined the identity of the sample.
14.7.10 Different growth media effect on mass spectra
Although vegetative bacteria produce different proteins when they are cultured in different growth media, positive identification with MALDI-TOF-MS is still possible with the protocol established at the Pacific Northwest National Laboratory (Jarman et al., 2000). A core set of small proteins remained constant under at least four different culture media conditions, including blood agar plates, minimal medium M9, rich media, tryptic soy broth (TSB) and Luria-Bertani (LB) broth, such that analysis of the intact cells by MALDI-MS allowed consistent identification (Valentine et al., 2005).
14.7.11 Sources of mass appearance variability
MALDI-MS in combination with unsupervised pattern recognition algorithms, such as HCA or PCA, or supervised algorithms, such as artificial neural networks, has shown mixed degrees of success for analyzing microbial mass spectral data. Statistical studies of bacterial MALDI-MS experiments have provided some insights on the factors reducing the success of these approaches. While some mass spectral peaks are highly reproducible and appear consistently, other peaks appear much less reliably. Two main sources of variability can be identified in microbial MALDI-MS experiments. The first originates in changes in culture conditions that produce changes in protein expression levels that alter the intensity and/or occurrence of the observed mass spectral peaks. It is well known that culture conditions have to be kept as constant as possible to ensure reproducibility of the obtained MALDI fingerprints. In cases where culture conditions change, such as if different media batches are used, correction algorithms can be applied to transform the new set of fingerprints with varying degrees of success. A second source of variability originates in the intrinsic reproducibility of the MALDI processes, including variables such as the sample preparation protocol, the type and quality of matrix chosen, ionization suppression effects, mass scale drifts and the impact of automatic data acquisition algorithms. In an effort to standardize the conditions for MALDI bacterial fingerprinting, Valentine et al. (2005) studied the sources of bacterial MALDI mass spectral variability in a comprehensive interlaboratory study. Soft modeling methods that created optimal linear relationships among constructs specified by a conceptual model, such as PCA and PLS, successfully mitigated the detrimental effects of noisy and highly co-linear spectra. Because PCA relies on the generation of scores from orthogonal PCs, it attempts to capture the directions of maximum variance and not the ‘among- group’ and ‘within-group’ differences of the investigated objects. Soft modeling by PLS-DA is a more recent supervised pattern recognition approach that attemptsto overcome some of the drawbacks observed in PCA. During PLS-DA, the PCs are rotated to generate LVs, which maximize the discriminant power between different classes and not the total mass spectral variance as in PCA. As such, class separation is greatly improved. For example, Pierce et al. (2007) presented results on the identification of Coxiella burnetii cultures using PLS-DA of MALDI-TOF mass spectral peaks for whole cell. The combination of data smoothing, denoising and binarization with PLS-DA allowed differentiation of seven C. burnetii strains in a training set containing spectral data obtained on four different days within a period of 6 months. In addition, they performed a two-class discrimination of C. burnetii phase I strains versus phase II strains to assess the antigenicity of a given culture. All models were validated by classifying unknown C. burnetii samples run on a fifth day.
14.7.12 Experimental condition variability
The importance of keeping experimental conditions constant and their influence on the reproducibility and discriminative power of MALDI-MS methods were demonstrated with mass spectra of B. anthracis obtained with different solvents. A combination of 0.1% trifluoroacetic acid (TFA) and chloroform-methanol (1:1) (solvents I and II) resulted in the best signal for B. anthracis. Although many common peaks were present in the five spectra when different solvents were used, the peak numbers, the relative intensities of peaks and the m/z ranges were different. Similar effects on the spectra of those solvents were also observed when other bacterial samples were examined (Liu et al., 2007).
Liu et al. (2007) proposed a universal sample preparation method for MALDI- TOF-MS of bacteria. In order to test whether the same protocol was applicable to more bacterial species with different characteristics, S. aureus 658, B. cepacia 855 and E. coli JM109 were also analyzed. Of the five bacterial species tested, B. anthracis is a Gram-positive spore; S. aureus is Gram-positive and does not produce spores; E. coli, Y. pestis and B. cepacia are Gram-negative vegetative cells; and B. cepacia has high extracellular polysaccharide content. It was found that peaks with different m/z values could readily distinguish these five species from each other, and all of their mass spectra were represented by more than 20 m/z values with high sensitivity.
14.8 Analyses of double-blind bacterial mixtures
14.8.1 Classification and identification of bacteria using peptide sequence information
Microorganisms traditionally have been classified and identified by their physiological and biochemical properties or chemotaxonomic characteristics. However, recent advances in molecular biology suggest that the detection, classification and identification of microorganisms reflecting relationships encoded in amino acid sequences of proteins are very reliable. The classical approach for a global proteome analysis relies on protein separation by high- resolution 2D electrophoresis to obtain individual molecules for MS investigations (Tonella et al., 2001). In classical bottom-up methods, separated proteins are ingel trypsinized, and the released peptides are identified by mass mapping or by analyzing product ion mass spectra obtained through CID or PSD (Chalmers and Gaskel, 2000). Important technical advances related to 2D-PAGE and protein MS have increased the sensitivity, reproducibility and throughput of proteome analysis. However, there are important disadvantages of 2D-PAGE that include a bias against insoluble and high-mass proteins, and partial chemical degradation of basic proteins occurs in the process. This technology cannot be interfaced directly to an MS platform, which makes this method a very laborious and time-consuming approach for routine applications.
The more recently developed shotgun approach uses a bottom-up strategy relying on a global, proteome-wide digestion of microbial proteins with proteolytic enzymes, followed by mass fingerprinting or microsequencing of peptides released from dominating proteins using MALDI-MS/MS technology (vide supra). However, substantial improvements in the scope of sequence coverage and reliability can be achieved through separation of peptides by LC prior to ESI-MS/MS analysis (vide infra) (Wolters et al., 2001a; Aebersold and Goodlett, 2001). The application of this approach to microbial analysis has been substantially improved through the development of a novel method for analysis of SBAs developed by Dworzanski et al. (2004) and VerBerkmoes et al. (2004).
The full characterization of a protein primary structure might benefit from emerging technologies based on a top-down MS approach. In this approach, an accurate measurement of the relative molecular weight value for an intact protein is combined with its direct dissociation into fragment peptide ions for amino acid sequence information. These pieces of information are combined to yield data suitable for the identification of proteins (Kelleher, 2004; VerBerkmoes et al., 2004).
14.8.2 LC-ESI-MS/MS
In general, the complexity of peptide mixtures created during the shotgun digestion of proteins extracted from bacterial cells dictates the use of strategies intended to diminish the complexity of peptide ions introduced into a mass spectrometer (VerBerkmoes et al., 2004). The most popular of these approaches, called multi-dimensional protein identification (MudPit) technology, uses an LC column containing two different separation materials and multiple steps of chromatography for the separation of peptides (Wolters et al., 2001b). However, this method is not optimal for peptide separation due to the elution of peptides with a solvent step gradient during ion exchange chromatography. Therefore, off-line techniques based on a continuous gradient ion exchange separation of peptides that are subsequently analyzed by RPLC-ESI-MS/MS represent a better choice for the comprehensive analysis of the bacterial proteome. Using this approach, Jaffe et al. (2004) found almost 10 000 unique tryptic peptides corresponding to 81% of the predicted ORF for Mycoplasma pneumoniae.
The sequencing of only a few peptides derived from a given ORF of a known organism is usually sufficient for protein identification. Therefore, methods based on the targeted fractionation of peptides, such as the presence of a particular amino acid or chemical group (e.g. sulfhydryls of cysteinyl residues), are also capable of substantially reducing peptide complexity in a mixture. However, the purpose of these fractionation methods is to increase the probability that peptides from a broader range of proteins, including those from low copy number proteins, will be selected for sequencing. Hence, the simplest way to achieve this goal is the application of a gas phase fractionation (GPF) procedure. GPF takes advantage of a mass spectrometer capability to select ions for CID-based sequencing in a narrow mass range. Focusing on a narrow mass range during multiple injections of sample aliquots allows a greater number of peptide ions to be analyzed and substantially increases the coverage of an investigated bacterial proteome (Kolker et al., 2003, 2005; Jabbour et al., 2005).
Thus, gel-free proteomics procedures based on the LC-ESI-MS/MS of peptides generated from cellular proteins is an attractive platform for large-scale analyses of bacterial proteomes (Corbin et al., 2003; Taoka et al., 2004) and can be utilized for the identification and classification of microorganisms (Dickinson et al., 2005; Dworzanski et al., 2006; Jabbour et al., 2010a).
14.8.3 Classification and identification of bacteria based on the distribution of phylogenetic profiles of amino acid sequences among taxa
With currently available commercial mass spectrometers, ca. 6–30 amino acids long peptide segments of proteins can be fragmented and mass analyzed in approximately 200 ms. Database searches with the acquired product ion mass spectra provide amino acid sequences of peptides that represent genomic information translated from matching ORF segments in all database bacteria. However, it is still a challenging task to translate the raw data generated from high-throughput MS experiments into biologically meaningful and easy-to- interpret results.
Although the identification of proteins is helpful in establishing the identity of an analyzed bacterium, the sequence coverage of so-called ‘identified proteins’ is rarely complete during shotgun sequencing. This is caused by factors related to sample preparation, the mass spectral acquisition mode, and for biological reasons (vide supra). Moreover, even full sequence coverage of a protein merely indicatesthat sequence is the same for only one of many of gene products. Thus, a more reliable method to determine the overall genomic similarities between a test sample and database bacteria would be from a set of confidently identified peptide sequences mapped to diverse chromosomal locations.
To achieve such a goal, peptide sequences were identified from product ion mass spectra during analysis of an unknown sample and were assigned to database bacteria (Dworzanski et al., 2004, 2006). Histograms were constructed for the peptides matching each bacterium and were used to reveal the closest bacterial database relatives. The highest number of confidently identified peptides and comparative analysis of peptide-to-bacterium assignments were used to identify the test sample. To simplify the identification process, other researchers (VerBerkmoes et al., 2005) used only those sequences that were uniquely identified only in one database species. In many cases these data processing methods allowed unequivocal identification of investigated bacteria; however, both approaches are not generally applicable.
The general strategy used for the identification of bacteria is schematically represented in Fig. 14.7 (Dworzanski et al., 2005b). First, the preparation of tryptic peptides is performed using well-established protocols that rely on cell lysis (e.g. sonication) followed by denaturation of proteins and the optional reduction of the cysteine disulfide bonds in the protein chains by carboxylamidomethylation. Peptides are obtained by trypsin proteolysis with subsequent LC-ESI-MS/MS analysis. During standard 1D- or 2D-LC-ESI-MS/MS analyses, separated peptides are electrosprayed into a mass spectrometer. The most abundant ions in the precursor scan are automatically selected for fragmentation via CID. The recorded tandem mass spectra are processed to identify the amino acid sequences of the precursor peptide ions.
There are many commercially available algorithms, including SEQUEST, for database searching using tandem mass spectra (Sadygov et al., 2004). The SEQUEST algorithm is chosen that matches uninterpreted product ion mass spectra from peptide analyses with theoretical fragmentation patterns predicted for all tryptic peptide sequences in a protein database to determine the best fit. Therefore, the search results depend significantly on the composition and quality of the database. Different laboratories have used protein databases comprised of diverse sub-sets of protein sequences available in public databases (Warscheid and Fenselau, 2004; Dworzanski et al., 2004; VerBerkmoes et al., 2005; Harris and Reilly, 2002; Jabbour et al., 2010a). However, a curated database comprising only sequences from ORFs annotated during complete sequencing projects of bacterial genomes seems the most appropriate to infer identities and for comparative analyses of an unknown bacterium in a systematic manner. Hence, the database (Fig. 14.7) was constructed from computationally predicted proteomes of all bacteria with fully sequenced genomes that are available from the National Institutes of Health NCBI Internet ftp site (ftp://ftp.ncbi.nih.gov/genomes/Bacteria).
To increase the speed of database sequence searches, proteins are usually digested in silico following the cleavage rules of the protease applied for sample processing. Tryptic peptide sequences stored in the database can be viewed as a virtual array of peptide ‘probes’ composed of tens of millions of elements that are interrogated by SEQUEST to determine matches between experimental peptide sequences derived from the investigated proteome and the database peptides. Currently, 1804 eubacterial and 124 archaeal genomes and many of their plasmids are fully sequenced and available (as of 20 March 2012) on the NCBI website. For instance, fully assembled genomes of Eubacteria represent >1533 strains from 392 species, 182 genera, 116 families, 69 orders, 33 classes and 16 phyla classified in accordance with the accepted taxonomy for each strain. Therefore, each database protein sequence may be supplemented with taxonomic information on a source microorganism and the chromosomal position of each respective ORF.
A database search algorithm such as SEQUEST attempts to match every experimental spectrum to theoretical spectra of database peptides; however, there is a need to use well-defined criteria to determine the validity of each automated assignment. The simplest way to express the accuracy of such assignments is to calculate the probability that a given match is correct. Although there are many computational methods to determine such probabilities (Sadygov et al., 2004), the PeptideProphet algorithm developed at the Institute of Systems Biology (Keller et al., 2002) has extensive documentation in the literature (Jabbour et al., 2010a, 2010b; Deshpande et al., 2011). This program determines the probability of a correct peptide assignment to a database sequence, and only peptides identified with high confidence are selected for further comparative analyses. These peptides represent the peptide profile of a tested microorganism.
However, each peptide sequence may be found in one or more proteomes/genomes of a bacterial database, and such assignments form a phylogenetic profile of a peptide. These profiles form a matrix of peptide-to-bacterium assignments that can be visualized as a bitmap and analyzed to determine relationships between a test sample and database microorganisms. This step may be performed using a set of common statistical techniques for analysis of multivariate data.
14.8.4 Classification of a bacterial test sample: a case study
A case study (vide infra) is presented of an MS-based classification of bacterial samples by using peptide sequencing information revealed by high-throughput database searches. To illustrate this process, a bacterial strain isolated from a rice dish and identified as B. cereus serotype H10 was chosen as a test sample and analyzed using LC-ESI-MS/MS technology (Dworzanski et al., 2007). This strain was previously characterized (La Duc et al., 2004) and showed a high nucleotide sequence similarity of its 16S rDNA gene to Bacillus cereus and Bacillus anthracis type strains of 99.3 and 99.7%, respectively. However, a substantially higherpercentage of the DNA-DNA hybridization was observed with B. cereus (72%) than with B. anthracis (50%). In addition, the sequencing of a gyrB gene indicated 99.1% and 90.9% similarity to B. cereus and B. anthracis, respectively, and the experimental B. cereus strain displayed a lack of genes encoding the protective antigen (pag) and capsular antigen (cap) that are virulence determinants for B. anthracis (La Duc et al., 2004).
14.8.5 ABOID deconvolution of a double-blind mixture of bacteria
The capabilities, and possible limitations, of the proteomics approach with regard to identification of biological agents were evaluated using blind biological samples (Jabbour et al., 2010a). Twenty-one blind microbial samples were provided and analyzed by the LC-ESI-MS/MS proteomics approach. The composition of the blind samples varied, with some samples having only one bacterium and others having as many as five different bacterial species or strains.
The ABOID histogram analysis of sample #18 is shown in Fig. 14.11. ABOID eliminated all the unwanted and degenerate peptides, and only the unique peptides that represented a 99% confidence level and above were retained for each organism. In this case, the number of unique peptides varied for the different bacterial candidates. E. faecalis had the highest number of unique peptides, followed by B. thuringiensis, and Burkholderia thailandensis had the least number of unique peptides. Interestingly, it was revealed that after the tests the blind samples had approximately equivalent bacterial concentrations for each organism, yet the number of unique peptides differed. This variation in the number of unique peptides in the output of the ABOID could be due to the dynamic nature of the bacterial species during sample processing. Some bacteria could have a larger number of lysed proteins that were suspended in the extraction buffer than did other species in the sample. This difference in bacterial protein concentrations is shown in the histogram in Fig. 14.11, generated from the ABOID output, where the relative number of peptides for each species is compared with that of the other species. This feature in the ABOID algorithm could possibly be used as a pseudo- quantitative technique in the determination of lysed bacterial proteins in a biological sample and thus aid in evaluating sample processing modules. Also shown in Fig. 14.11 are six bacterial candidates near the cutoff threshold within the Staphylococcus genus. This pattern is due to the fact that the Staphylococcus aureus ATCC 3359 strain present in the blind sample has not been sequenced, not reported in the public domains, and thus was not part of the constructed proteome database. However, ABOID was capable of providing a nearest neighbor match to the species level (aureus) and thus identified the bacterium correctly as S. aureus subsp. aureus. It is noteworthy that this bacterial strain, which was not genomically sequenced, could only be identified to the species level. The rapid increase in the number of sequenced bacteria will benefit this proteomics approach and enhanceits robustness in the identification process of biological samples. However, a significant advantage of the approach is that if a particular strain has not been sequenced, and yet the species is represented in the database, it is highly likely that the unsequenced sample strain will be identified to that species level. The appearance of the histogram from an ABOID analysis indicates the degree of accuracy of the identification process. Strain-level experimental identification is indicated by a single line (Fig. 14.11) in the histogram (Enterococcus faecalis V538) or by a grouping of lines where one line clearly dominates (e.g. B. thailandensis E264 and Pseudomonas aeruginosa PAO1) with respect to the number of unique peptides. B. thuringiensis has two strains resident in the database, and both provide a similar set of peptides. This occurs because the two strains do not display peptides that clearly distinguish themselves. The fifth bacterium in the sample #18 mixture was S. aureus strain ATCC 3359, and this organism does not have its genome sequenced. However, species level identification (aureus) of this strain is indicated by a grouping of lines (Fig. 14.11) that does not display a significant difference in number of unique peptides. Thisblind sample was correctly identified as a mixture of five bacteria: B. thuringiensis, S. aureus subsp. aureus, E. faecalis V583, B. thailandensis E264 and P. aeruginosa PA01, where S. aureus and B. thuringiensis were identified to the species level and the other three were identified to the strain level.

The in-house database originated from 881 genomically sequenced bacterial strains. The blind sample suspensions consisted of bacteria in single and mixture forms, and their genomes were either sequenced or not sequenced. The bacterial strains found in experimental samples that do not have a sequenced genome, therefore, cannot be found in available public databases or the in-house database. Figure 14.12(a) shows the classification map of the 21 experimentally processed blind samples, and Fig. 14.12(b) shows that of the bacterial strain sample identities (sample key). In Fig. 14.12(a), the bacteria on the abscissa reflect every bacterium found at least once in the 21 experimentally determined samples. The bacteria listed in Fig. 14.12(a) were not disclosed in advance; rather, all 21 experiments produced the bacterial identities from the ABOID algorithm (Jabbour et al., 2010a). Figure 14.12(b) represents the sample key or actual bacterial species and strains in the blind samples. This information was not released to the investigators until the Fig. 14.12(a) results were turned in for experimental performance verification. A comparison of Fig. 14.12(a) and (b) shows that bacterial discrimination was achieved by relying on the unique peptides corresponding to the bacteria in the blind samples. An identification was based on the matching probability of the unique peptides from a blind sample with a bacterial entry in the bacterial proteome database at more than a p=0.95 confidence level. The strain level identification, indicated by the filled blackened boxes in Fig. 14.12(a), was assigned due to a close match with the analyzed microorganisms’ unique peptides and their nearest neighbor strains.


Figure 14.11 shows the analysis of sample #18 and provides an example of identification to the strain level as well as classification to the species level (vide supra) for Staphylococcus aureus strain ATCC 3359, which is not currently sequenced. A correct species level of identification was experienced with all bacteria in the blind samples that are unsequenced, indicated by a vertical hashed box in Fig. 14.12(a). Thus, the classification probability was statistically high enough, based on a comparison of the virtual proteome of a database strain and the experimental unique proteins of the genome-unsequenced bacterial sample. Therefore, identification was reported at the species level. Blind sample #20 (data not shown) was identified as B. subtilis; however, the sample key reported it as B. atrophaeus. This difference is due to the lack of a proteome for B. atrophaeus, which is taxonomically considered as B. subtilis. Our data supports the proposition that B. atrophaeus be reclassified as a strain of B. subtilis (Burke et al., 2004).
Blind sample #17 was investigated for ABOID characterization (Jabbour et al., 2010a). The experimental set of peptides could only provide results to the Clostridium genus level, because all nine Clostridia bacteria (species-strains) resident in the database produced a histogram (data not shown) similar to that ofStaphylococcus aureus in Fig. 14.11. The experimental peptides matched that portion of the virtual proteome common to all Clostridia. Therefore, the complete experimentally derived tryptic peptide information record was stored as a separate bacterial line item as ‘Clostridium species 1’ in the database of 881 bacteria. Another aliquot of the blind sample was processed with data reduction and searching in the new hybrid database. The highest match was with the Clostridium species 1 entry. After the results were submitted, the identity of sample #17 was revealed to be Clostridium phytofermentans ISDg. This strain does not have itsgenome sequenced, yet ABOID was able to match the virtual proteins that are similar to the Clostridium genus to the experimentally observed peptides. Thus, ABOID was able to characterize sample #17 as Clostridium without choosing one of the nine Clostridia strains resident in the database or other bacterial genera. ABOID instead matched Clostridia species 1 to the experimental peptides, which indicated that there is sufficient information in the experimental peptides to differentiate Clostridium phytofermentans ISDg from the nine database Clostridia strains. It is tempting to consider that this approach, when combined with the accurate mass tag approach of Lipton et al. (2002), has the potential to diminish the impact of genome sequencing deficiencies for some bacterial strains. The rapid advancement in genome sequencing projects will enhance the robustness of this approach through the expansion of the proteome database. This expansion in the proteome database is anticipated to include the cellular proteins that can be utilized for strain-level differentiation.
The results showed that the method (Fig. 14.12(a,b)) was effective in identifying bacteria whether the sample was composed of one organism or a mixture, or even if the sample is not resident in the database. No false positives were observed for any of the blind samples that were analyzed, including blank sample #21. The proteomic MS approach reported herein is not meant as a replacement for DNA-based identification methods. It is envisioned that this approach can be a second, confirmatory approach to pathogen identification. Additionally, there are some major advantages to the proteomic method over other molecular biology methods such as the DNA-based methods, in that (a) no prior information about the sample is required for analysis; (b) no specific reagents are needed in the analysis process; (c) proteomics MS is capable of identifying an organism when a primer/probe set is not available; (d) proteomics MS requires less rigorous sample preparation than PCR; and (e) proteomics MS can provide a presumptive identification of a true unknown organism by mapping its phylogenetic relationship with other, known pathogens. The proteomics method could also be applied to identify viruses and toxins, because viruses and toxins are included in the proteome database.
14.8.6 Bioinformatics analyses between outer membrane proteins vs. whole cell analysis by bacterial strain
The question was asked whether OMP and whole cell protein extracts, independently, can distinguish between strains of the same species and nearest neighbor(s) (Jabbour et al., 2010b). High-throughput proteomics was applied as a means for characterizing cellular proteins and producing amino acid sequence information for peptides derived from these proteins for pathogenic and non- pathogenic E. coli and Yersinia pestis. Whole cell protein and cell membrane OMP extracts were compared and contrasted with the ABOID bioinformatics modeling tools (Dworzanski et al., 2006) for species and strain-level discrimination.
Whole cell protein extracts of E. coli strain O157:H7 were prepared and analyzed by proteomics MS. A nearest neighbor analysis, using the Euclidean single linkage approach, was used to arrive at a set of proteins for species and strain matching to the database. Figure 14.13(a) shows the correct identification of the experimental sample as E. coli O157:H7. However, this identification is also shared with E. coli UTI89, which is the causative agent of human urinary tract infections. Although E. coli UTI89 is related to E. coli O157:H7, it is missing certain proteins such as the BAA35715 outer membrane and flagella-related proteins that are distinctly expressed in E. coli O157:H7 (vide infra). Five unique proteins distilled from the bioinformatics analysis of the peptide product ion mass spectra are the reason for the discrimination (Jabbour et al., 2010b).
Figure 14.13(b) shows the nearest neighbor similarity linkage results for the OMP extract of E. coli O157:H7. The dendrogram shows a correct match of the sample to the database E. coli O157:H7 organism. Note that the next nearest neighbor, which is E. coli UT189, is relatively distant, at approximately 2.2 linkage units, unlike in the case of the whole cell protein extract (Fig.14.13(a)).
Jabbour et al. (2010b) present the eight unique proteins found in the proteomics analysis of the E. coli strain for the OMP analysis. The total number of proteins identified between the two extraction techniques was such that the whole cell preparation had a significantly higher average number of proteins (162) than that of OMP extract (89). However, the average number of unique proteins that were identified from the OMP extract (eight proteins) was greater than that from the whole cell protein extract (five proteins). The OMP extract, unlike the whole cell protein extract, did produce the outer membrane and flagella-related proteins (Jabbour et al., 2010b), which are distinguishing characteristics of E. coli O157:H7 compared with the UT189 strains. The presence of the two proteins in the OMP extract contributed significantly to the correct identification of the experimental sample to the database E. coli O157:H7 entry without ‘statistical’ confusion from the E. coli UT189 strain.
It appears that significant information and discrimination power resides within the OMP extract procedure (Fig. 14.13(b)). The OMP procedure captures a greater amount of unique proteins that provided for strain-level discrimination. The whole cell protein extract did not provide the same strain discrimination as that of the OMP extract; however, this does not imply an absence of the additional OMPs in the whole cell extract. Rather, it may be that a higher abundance of non-OMPs (or remaining protein in the cell) suppressed the detection of the OMPs in the whole cell protein extracts. Mass spectral analysis can suffer from ionization suppression due to the presence of large numbers of ionizable species. Generally, a whole cell extract has a significantly larger number of ionizable peptides with a greater abundance of non-outer membrane tryptic peptides compared with that of an OMP extract. Therefore, whole cell protein extract analysis likely experiences a degree of ionization suppression during mass spectral analysis.
A comparison of the proteins present in whole cell protein and OMP extracts of Y. pestis CO92 was performed. Figure 14.14(a) shows the identification results of the whole cell protein extract for Y. pestis CO92. The dendrogram indicates an ambiguous strain-level identification from matching between the experimental sample and the database CO92 entry. The bioinformatics analysis of the whole cell extracts results in five matches to the experimental sample from the six totalYersinia strains in the database. The CO92 experimental strain was matched to the only non-pathogenic strain (91001) in the database as well as to the pathogenic Antiqua, CO92, Nepal 516 and IP32953 strains. The Kim strain next nearest neighbor resides two linkage units distant from the sample and the remaining five Y. pestis strains. The set of unique proteins for whole cell protein extracts of Y. pestis CO92 shows only four biomarkers associated with virulence factors (Jabbour et al., 2010b).

Figure 14.14(b) shows the identification results for the OMP extracts of the Y. pestis CO92 sample. The dendrogram indicates an unambiguous, and correct, strain-level identification from database matching. The sample and CO92 strains are one linkage distance unit from the next nearest neighbor group consisting of the 91001/Antiqua/Nepal 516 strains. The set of unique proteins for virulent Y. pestis CO92 provides the presence of known biomarkers associated with virulence factors (Jabbour et al., 2010b). For example, virulence plasmids in Y. pestis, such as pPCP1 that encodes for plasminogen activator proteaseprecursor, pCD1 that encodes for low-calcium response protein, pMT1 that encodes for toxin protein and the structural gene for fraction 1 protein capsule (chaperonin protein) were found in the mass spectral analyses. The outer membrane toxin protein was present in higher abundance than the other protein biomarkers (Jabbour et al., 2010b).
From analyses of both protein extracts, a comparison of the total, experimentally determined numbers of proteins showed a difference between the two protein extraction methods as applied to the Y. pestis sample. The whole cell protein and OMP approaches had 182 and 136, respectively, total identified proteins. Upon removing the highly conserved, housekeeping and energy transfer proteins from both strains, the numbers of strain-unique proteins (Jabbour et al., 2010b) for the whole cell protein and OMP approaches were four and 13, respectively. The significant number of unique proteins from the OMP extract likely caused the unambiguous differentiation compared with the whole cell protein extract.
14.9 Conclusions
MS has emerged as an indispensable tool for the biological sciences as a result of developments that took place during the last three decades. They include the emergence of novel ionization methods, mass analyzers and sensitive ion detection methods. These achievements allow detection, quantification and in-depth structural analysis of the proteome for sensitive and highly specific detection and identification of microbial agents. Furthermore, in many cases only a limited sample pre-processing is required before submitting a sample for MS analysis.
Profiling of bacterial proteins using MALDI or ESI with MS/MS provides descriptive characteristics suitable for discrimination and typing of microorganisms. Reliable detection and identification will benefit from technologies that provide preferably genome-based data for the classification and identification of pathogenic and non-pathogenic strains. For instance, molecular approaches use peptide ions derived from microbial proteins, which are fragmented by CID or during TOF PSD, to reveal amino acid sequence information. This information can be used for the detection and confirmatory identification of a single or mixture of bacteria by searching protein databases. Currently, it seems that ‘shotgun’ digestion of a proteome combined with LC-MS/MS analysis of the generated peptides may provide sequence information that is sufficient and suitable for phylogenetic classification of a microbe. For example, assignments of identified experimental peptide sequences to database proteomes/genomes in the database create phylogenetic profiles of the peptides. These profiles may be analyzed using numerical taxonomy methods to reveal groupings of an investigated strain with database bacteria that are suitable to infer a taxonomic position and confirm identity of the microorganism.
MS-based proteomic methods can be used for pathogen detection, classification and identification through approaches that complement DNA-based assays andprovide orthogonal detection capabilities to prevent system-wide false positives or negatives. Moreover, because protein sequences are more conserved than DNA sequences, the investigation of proteomes can provide a clearer picture of functional relatedness by eliminating interclonal DNA divergence that is nonessential from the functional or pathogenic perspective. In addition, proteomicsbased methods may facilitate the detection of virulence proteins and those virulence proteins that were expressed from deliberately modified genes. The latter can include, for example, production of alternative codons for some amino acids to avoid nucleotide detection.
During the next five years, the number of fully sequenced bacterial genomes will approach and likely exceed the number of known bacterial genera (1921) because currently more than 5200 genome sequencing projects are in progress. Although some genera and species will still be under-represented in the database, it is clear that the most important taxa from the pathological and environmental standpoint will be represented by many strains, thus assuring a solid foundation for a growing use of proteomics methods for detection and identification. The combination of these unprecedented resources with the expected progress in (a) automated sample preparation, (b) peptide separation techniques utilizing microfluidic devices, (c) novel MS instrumentation and (d) bioinformatics methods may allow the development of a robust platform for fast, efficient, comprehensive and comparative proteogenomic analysis of bacteria during a time frame of a few minutes. Thus, the expected progress in experimental and computational approaches combined with a sufficient knowledge base will create an environment to perform a successful identification process for a majority of cultivable bacteria. This progress should also provide information suitable to predict important biological properties, such as pathological potential or disease outcomes, from human and animal pathogens.