
Lidar (Light Detection And Ranging) for biodetection
H.S. Lee, C.R. Prasad and R.M. Serino, Science & Engineering Services, Inc. (SESI), USA
Abstract:
Weapons of Mass Destruction may have serious consequences when unrealized exposure can cause significant loss of life and property. In response, early warning devices such as Lidar can enable contamination avoidance and early/rapid use of protective measures, preferably pre-exposure. In this chapter, we provide an overview of the value of early warning, describe the essential elements of Lidar, outline key aspects for successful use, look at the value of Lidar for biodetection as well as coincidental value in other areas, review some key challenges in meeting higher-level goals, and close with some thoughts on what we see as achievable full potential.
Key words
WMD; Lidar; detection; track; map; ultraviolet; infrared; algorithm; laser; contamination; avoidance
12.1 Introduction
‘Knowing that forewarned is forearmed.’
Abraham Tucker in The Light of Nature Pursued, 1768
… From the Latin military proverb ‘Praemonitus, praemunitus’ or ‘Forewarned, forearmed.’
The employment of Weapons of Mass Destruction certainly presents potentially serious consequences to military and civilian populations, in that unrealized exposure can cause the loss of thousands of lives and billions in property, in addition to any psychological impact. Thus, the establishment of WMD early warning protective measures have been a focus for many, because useful approaches can enable risk mitigation through contamination avoidance and early use of protective measures, preferably pre-exposure.1,2
The purpose of this chapter is to examine the value-added contribution of Lidar (LIght Detection And Ranging) for the biodetection aspect of WMD defense and biosurveillance. We will attempt to provide a useful overview of the value of early warning, describe the essential elements of Bio-Lidar with a general discussion of useful approaches and how they can fit together, outline key aspects and expectations for successful use, look at the value of Lidar for biodetection early warning as well as coincidental value in other areas, review some key challenges in meeting higher-level goals, describe how integrating disparate information can add more value than the individual sum of the parts, and close with some thoughts on what we see as achievable full potential.
12.2 The value of early warning
Our culture values an early warning of what lies ahead or around, and craves supporting information that helps us to determine situational awareness. In the simplest embodiment, whether they are waking up, going to sleep or preparing for travel, many people will seek information about rain, snow or the general weather conditions that lie ahead in order to be prepared. We may listen to our local weatherman, read a newspaper, or go to the Internet for a look at WeatherBug® in order to avoid any surprises.
As shown in Plate II (see the color section between pages 256 and 257), one can readily see that, if we are traveling from Washington to New York, there is little likelihood of precipitation along the way. In contrast, a trip from Washington to Pittsburgh would likely encounter some snow. Thus, presentation of a Doppler Radar sweep, as shown in the plate, provides early warning of the presence of possible snowy conditions in some areas as well as the absence of snowy conditions in other areas. To put it another way, if we want to avoid snow, we now know where not to go, before we get there.
The same indication and early warning are possible for real-time detection of bioaerosols in the air, but successful execution requires a slightly different approach due to the relatively smaller size of biological aerosols; millimeter-sized rain and snow particles are readily tracked by radar, but this is not as easy for biological particles with size measured in microns. In cases where particles are significantly smaller than millimeter-size, shifting from longer radio wave-based detection to shorter light wave-based detection (Radar→Lidar) helps us to detect and bring smaller biological particles into focus.
RADAR=RAdio Detection And Ranging;
LIDAR=LIght Detection And Ranging.
Just as a Doppler Radar sweep of an area can detect, map and track the movement of precipitation in real time, so too can a Lidar sweep detect, map and track the movement of bioaerosols in real time (see Plate III in the color section between pages 256 and 257). In this example, Sweep 1 shows no cloud, Sweep 2 shows appearance of a cloud at approximately 3 kilometers and centered at 105 degrees, Sweep 3 shows the cloud expanding and closing, and Sweep 4 shows further expansion and further closure at a distance of 2.5 kilometers. At a wind speed of 9 miles per hour (15 kilometers per hour), we can anticipate closure in approximately 10 min from Sweep 4. Thus, situational awareness such as the information shown in Plate III provides early warning that can be used for risk mitigation, contamination avoidance and/or early use of protective measures, preferably pre-exposure.3
12.3 The essentials of Bio-Lidar
Fundamental scientific and technological innovations over the last 30 years have enabled detection and discrimination of bioaerosol hazards using low-power, eye-safe Lidar systems based on commercial IR and UV lasers, advanced technology detectors, and customized control software, algorithms and user interface. In the simplest embodiment, laser beams emitted from the Lidar are coupled with biological particles in the atmosphere such that signals are modified and returned to the Lidar for analysis in real time to help determine key information such as cloud distance, azimuth, density and contents.
As outlined in Plate IV (see color section between pages 256 and 257), laser beam(s) are emitted from a Lidar and projected from close range to 5+ kilometers to interact with biological particles within a cloud. Depending on wavelength and constituents of the cloud, light is then reflected back to the Lidar, where the properties of the returning light are analyzed within Lidar in near real time.4 Based on user needs, the information is then presented on a computer screen and/or retransmitted within a network.
Lidar are relatively straightforward devices in concept. However, their reliable use in a field environment requires very careful attention to detail in determining requirements, specifications, application and design, as well as implementation of solid engineering practices. These practices are applied to the four key Lidar elements or sub-systems: transmitter, receiver, life support and computer:
• The transmitter contains lasers with supporting optics and electronics.
• The receiver contains detectors with supporting optics and electronics.
• Life support embodies power bus, power supply and environmental heating/ cooling.
• The computer embodies Lidar control software, data storage and control, algorithms and user screen(s).
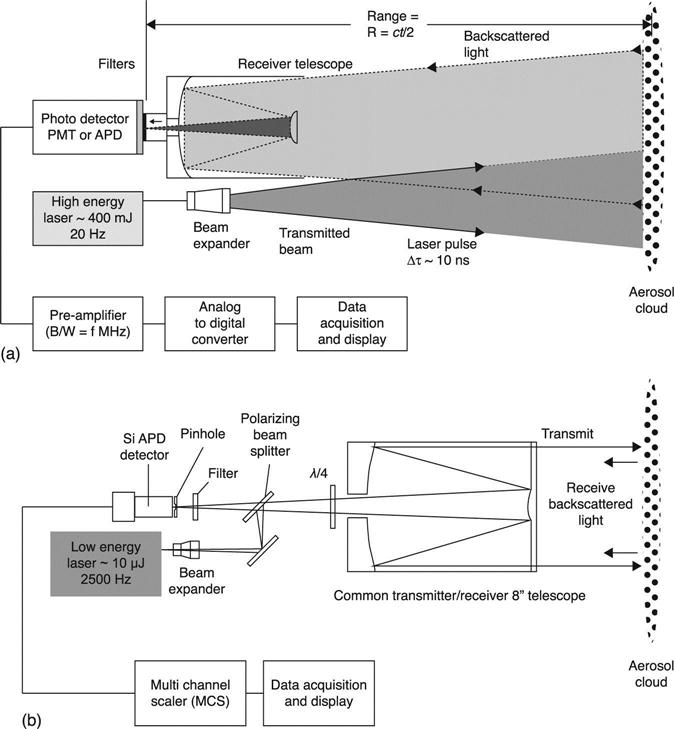
Shown in Fig. 12.1 are two examples of Lidar on opposite ends of the use spectrum. The Lidar shown in Fig. 12.1(a) is a purely experimental device and the Lidar in Fig. 12.1(b) is a device that has completed a full range of performance testing and is currently in use with the US Department of Defense (DOD-approved photo).

The general technical architecture of both devices shown in Fig. 12.1 is captured in Fig. 12.2(b). Tracing from the laser components, light is coupled through an optical train to a set of output mirrors for enabling the laser’s output down-range. In a similar vein, light is returned from down-range through the same set of mirrors and separate optical train to the detectors. While some Lidar constructors use a separate structure for the transmitter and receiver sub-systems, as shown in Fig. 12.2(a), we use what is described as an integrated transmitter/receiver because of the inherent ruggedness and ‘set-and-forget’ capabilities that this general technical architecture enables (Fig. 12.2(b)). The configuration in (b) also supports essential eye-safe qualities.5–7
12.4 How Bio-Lidar is used
Bio-Lidar is generally intended for surveillance of a predetermined area, usually in a static mode so as to minimize complexity of the sweep and allow trouble-free optical scanning. Area coverage can be wide or narrow, with long range considered as perhaps 10 kilometers and short range considered within a city block or Metro station. In all cases, the sensor is emplaced, aligned and operated so as to present an accurate sweep of the area.
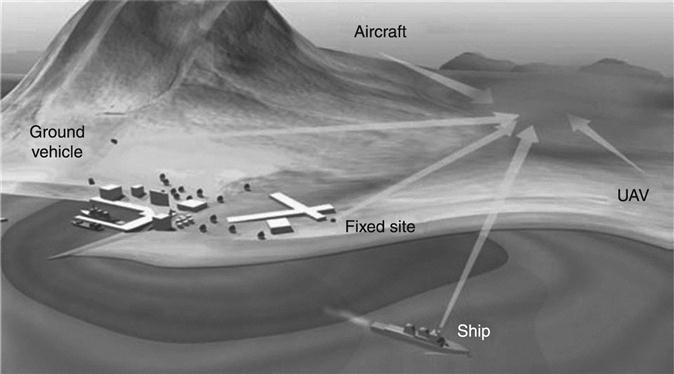
Figure 12.3, as extracted from a 2010 NATO report (ISBN 978-92-837-00869), graphically depicts the various means for bio-cloud surveillance at distance from both fixed and mobile platforms.8 Depending on mission requirements, Bio-Lidar can be used in one of two modes: static or mobile. In static mode, the sensor lies within a fixed emplacement for repetitive use without changing operating conditions such as physical location, field of regard, optical alignment, and life support such as environmental controls and power. In mobile mode, the Lidar may be moved from time to time in order to optimize placement for specified needs. Here, the support system must also be mobile, and each application may require a new set-up/alignment. The notable point and critical attributes of Fig. 12.3 are that a large cloud is at least 3 kilometers away from the depicted fixed site, and that the cloud can be detected, mapped and tracked before the fixed site inhabitants are exposed to any hazard. Moreover, the inhabitants have perhaps 10–15 minutes of warning – with moderate winds – to prepare and/or don protective equipment, pre- exposure.
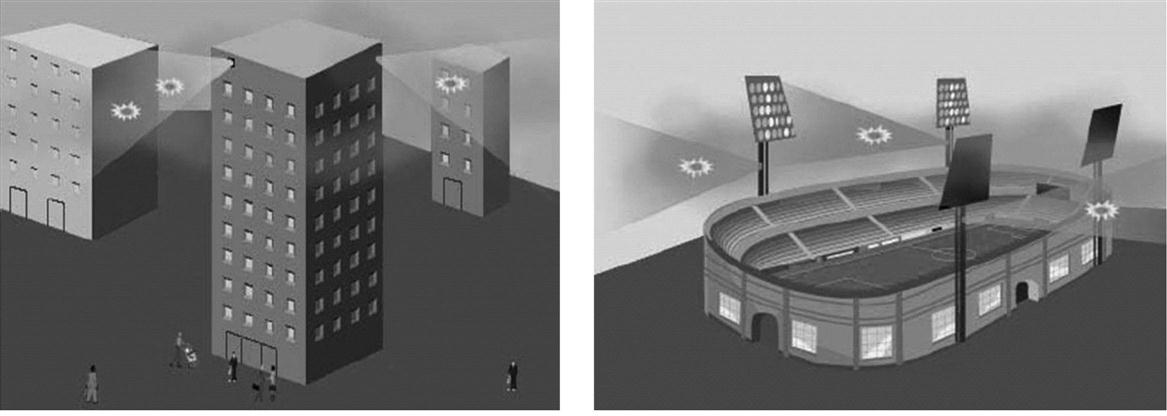
An early warning of bio-clouds can be accomplished in open areas as shown in Fig. 12.3, Fig. 12.4 graphically depicts bio-cloud surveillance at relatively short ranges in urban areas. Due to the complexity of the urban environment, fixed sites are generally preferred. This is because changing operating conditions such as physical location within a complex urban environment can greatly impact field of regard and supporting set-up time. For high-priority areas within urban environments, complementary capability is achievable by combining ground-level short-range Bio-Lidar and roof-top long-range Bio-Lidar.
12.5 Bio-Lidar value-added
Early warning through proven means can enable effective and timely support of a bio-surveillance decision cycle. As outlined in Fig. 12.5, a key value-added by Bio-Lidar is enabling early preventative actions that reduce exposure of people and infrastructure to aerosol hazards. Thus, early support of the bio-surveillance decision cycle can reduce risk and avert consequent entry into a curative cycle of mitigation, treatment and loss of effectiveness. To paraphrase, minutes of prevention can be worth hours of cure.

In terms of a relevant scenario and flow, we can think of the scene in Fig. 12.3 integrated with the timeline in Fig. 12.5, as shown in Fig. 12.6. Post-boom, as the cloud passes from the release point and moves toward the fixed site, time of travel will be based on wind speed and direction. If the distance from the fixed site at first detection/map/track is 3 kilometers and the winds are tracking towards the fixed site at a speed of 12 kilometers per hour, the time of arrival will be 15 minutes. In the 15 minutes of warning, there is minimum though sufficient time to don protection as well as button up buildings and vehicles. In the absence of the same 15 minutes of warning and immediate action, the inhabitants at the fixed site become contaminated medical patients and the internal parts of buildings, aircraft and vehicles are also contaminated.

When we earlier reviewed the elements of real-time detection of bioaerosol particles in the air, we also noted that successful execution requires light wave-based detection to detect and bring smaller biological particles into focus. These micron-sized particles are readily detected at relevant concentrations in the air by backscatter, and, similarly, so too are non-biological micron-sized particles. Inother words, a Bio-Lidar that detects, maps and tracks micron-sized biological particles can also detect, map and track non-biological micron-sized particles such as chemicals and radiologicals. Plate III (see color section between pages 256 and 257) shows four sequential Lidar sweeps that detect, map and track the movement of an incoming aerosol cloud in real time. Though a bio-aerosol is depicted here, by its very nature Bio-Lidar also has the potential to do the same for other aerosols such as chemicals and radiologicals.
Some have argued that indication and early warning of bio-aerosol hazards is not needed due to wide availability of antibiotics and/or vaccines. True or false, that theoretical position remains predicated on the logistic availability of pre- or post-exposure treatments, and that the presumed treatments are fully effective against a (potentially unknown) hazard with no debilitating side-effects to those exposed on the line; i.e., lack of pre-exposure early warning could present some risk for a biological Maginot Line.
12.6 Areas for improvement
Lidar-based early warning sensors have distinct advantages and requirements when compared with point sensors. The standoff sensor has the unique ability to provide the ‘unblinking eye’ for very large areas, adding precious minutes of warning for incoming hazards, and at the same time afford a relatively small ‘logistics tail’. Clearly there is value-added and, up to this point, we haveconsidered early warning in regard to Bio-Lidar detecting, mapping and tracking aerosols for eye-safe, 24/7 operation. The main challenge is constant exposure to solar and ambient lighting, and for this application the optical metrics for detection are not overly stringent. However, going to the next level of remote discrimination/identification has challenges that are significantly greater with regard to deconvolution and analysis of bio-aerosol return signals for gaining additional data in discriminating and/or remotely identifying a distant cloud. Here again, solar and ambient lighting add significant complexity, such that the results to date for remote discrimination/identification are somewhat mixed.
Beyond the solar challenges cited above, target clouds can present confusing signatures because background (environmental contaminant) aerosols can make resolution of target materials and remote analysis of mixtures extremely challenging. This is because the distinction between innocuous biological materials and hazardous biological materials is subtle in molecular and spectral make-up. Further, subtle changes are such a small percentage that only a slight effect on their optical signatures is observed, which makes high-confidence discrimination difficult. Additionally, variations in growth media and contaminants associated with biological processing can affect optical signatures, further complicating the task of analyzing and successfully discriminating the target cloud.9–11
In attempts to achieve a breakthrough, there have been extensive investments and studies by multiple organizations over the last 5–10 years looking at how best to remotely discriminate and/or identify bio-aerosol clouds. Thus far, three key approaches are at the forefront: Ultraviolet Laser Induced Fluorescence (UV-LIF), Infrared Backscatter Depolarization and Long-Wave Infrared (LWIR) Differential Scattering (DISC). For background on these technologies, the reader is invited to see a very useful February 2010 NATO Report that provides open source, ITAR-free information titled ‘Laser Based Stand-Off Detection of Biological Agents’ (ISBN 978-92-837-0086-9).8 While there is good reason to believe that remote discrimination is technically achievable for eye-safe 24/7 operations, an executable solution may require a hybridized approach using orthogonal metrics via a combination of Infrared Depolarization, UV-LIF and/or LWIR DISC.
12.6.1 Infrared Elastic Backscatter and Depolarization Lidar
Depending on shape, light scattered by aerosol particles is depolarized to different extents.12 Thus, measuring light backscattered from a polarized transmitted beam in two orthogonal polarizations can be used to infer the shape of the particles. The depolarization ratio, defined as the ratio of light scattered in cross-polarization to that in co-polarization, varies from zero for spherical particles to as much as 50% for rod-Jike particles; e.g., spores of anthrax and the simulant Bacillus globigii have a rod-like shape. Several elastic depolarization Lidars have been developed and used for the discrimination of biological aerosols.13,14 However, it must benoted that depolarization Lidar has two important limitations when used alone: many naturally occurring aerosols also have irregular shapes and hence may produce false positives, and biological aerosols disseminated as a liquid spray start out with a very low depolarization ratio that may change with aerosol drying. Hence, the depolarization method is perhaps best employed in combination with other techniques such as fluorescence and/or multi-wavelength differential scattering to improve its discrimination.
12.6.2 Fluorescence Lidar
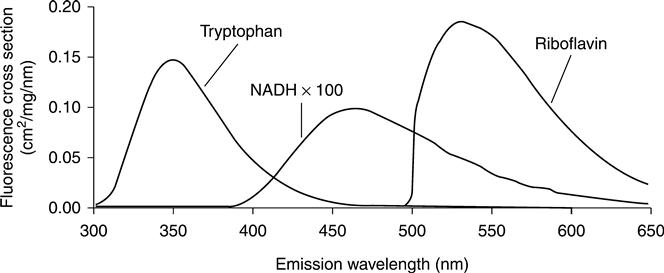
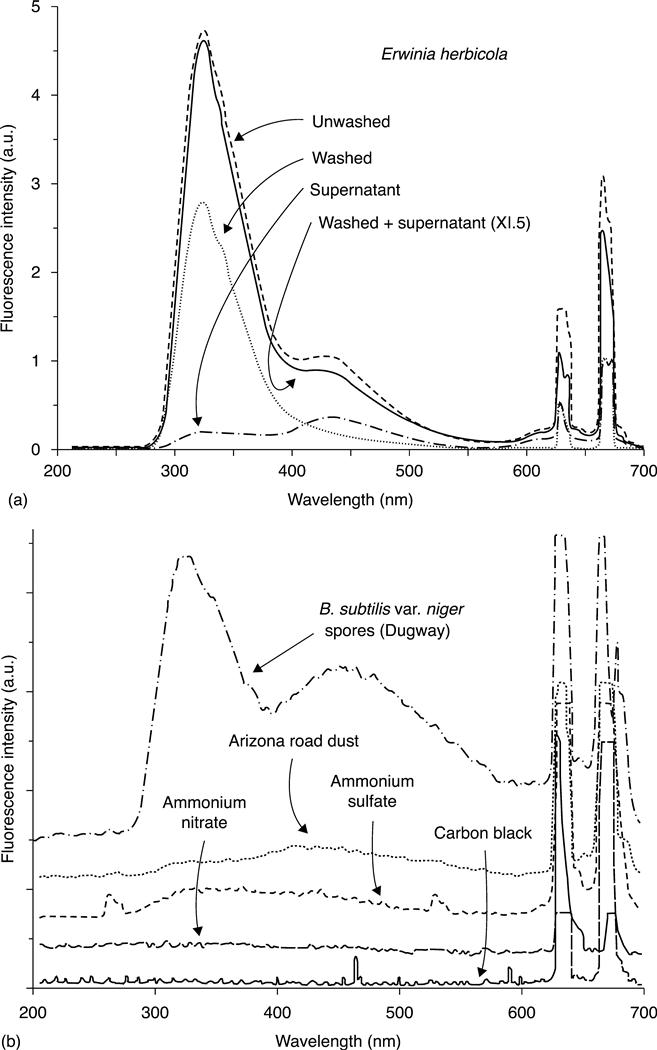
UV-LIF is the most commonly used technique for discrimination. When subjected to UV illumination, nearly all biological materials produce auto-fluorescence, as shown in Fig. 12.7. Bio-fluorescence Lidars transmit UV light and detect wavelength- shifted UV fluorescence. But auto-fluorescence emission is much weaker (by several orders of magnitude) compared with the elastic backscattered light from aerosol particulates, and generally requires higher laser power and high-sensitivity detection systems to achieve good performance.15–17
Many Lidar developers have employed spectrometers to obtain a complete spectrum of 355 nm LIF in the visible wavelength (355–700 nm). This is because discrimination algorithms based on the spectrally resolved fluorescence signature of simulants and interferents (rather than a single broadband fluorescence signal) can result in improved discrimination performance.8,18,19 However, there are several problems with the use of the spectrometer for multi-spectral LIF. Since the spectrometer spreads the total fluorescence collected into a large number (several hundred in most cases) of narrow-band spectral channels, the signal/spectral channel is much smaller than that collected by a wide bandpass filter channel. In response, scientists have employed a combination of an intensified charge-coupleddevice (ICCD) array, a laser with an output of tens of mJ/pulse for nighttime use or several hundred mJ/pulse for daytime use, and signal averaging for measuring the spectrometer signals with sufficient signal to noise ratio (SNR). Classification of derived spectra from the spectrometer then require a library of spectral distributions of simulants and interferents, such as the one shown in Plate V (see color section between pages 256 and 257), and classification of the spectra can be done with chemometric techniques such as PCA (principal component analysis) and variants, as well as Support Vector Machines (SVM) and variants.18,20 A challenge to overcome is that the spectral signature is not very stable and can be modified considerably because of substantial variability –over time – of biological materials, the atmosphere through which the laser pulse and the LIF travel, and noise in the signal received by the spectrometer and the ICCD detector. An example of this variability is Plate VI (see color section), which shows the spectra obtained with the Stand-Off Integrated Bioaerosol Active Hyperspectral Detection (SINBAHD) system during trials conducted in 2007.8
Daytime operation of fluorescence Lidars using 355 nm UV lasers for excitation poses problems because of strong solar background present along with the fluorescence signal in the 400 to 500 nm wavelength region. High-energy laser pulses are required to obtain fluorescence signal above the solar background to achieve adequate SNR for the detection. Since such high-energy pulses are not eye-safe, this also requires a mechanism to detect the presence of any intrusion in the beam path to rapidly turn off the laser beam. An alternative approach for daytime measurement of fluorescence is the use of the solar blind region at wavelengths shorter than 295 nm. In this region the solar background light present at ground level is virtually zero because of the strong absorption by atmospheric ozone. Figure 12.8 shows fluorescence in the solar blind region generated by biological materials by excitation with a 266 nm laser source.21 We have built a compact short-range Lidar system equipped with solar blind fluorescence detection and demonstrated daytime operations.22,23
12.6.3 IR Differential Scattering Lidar
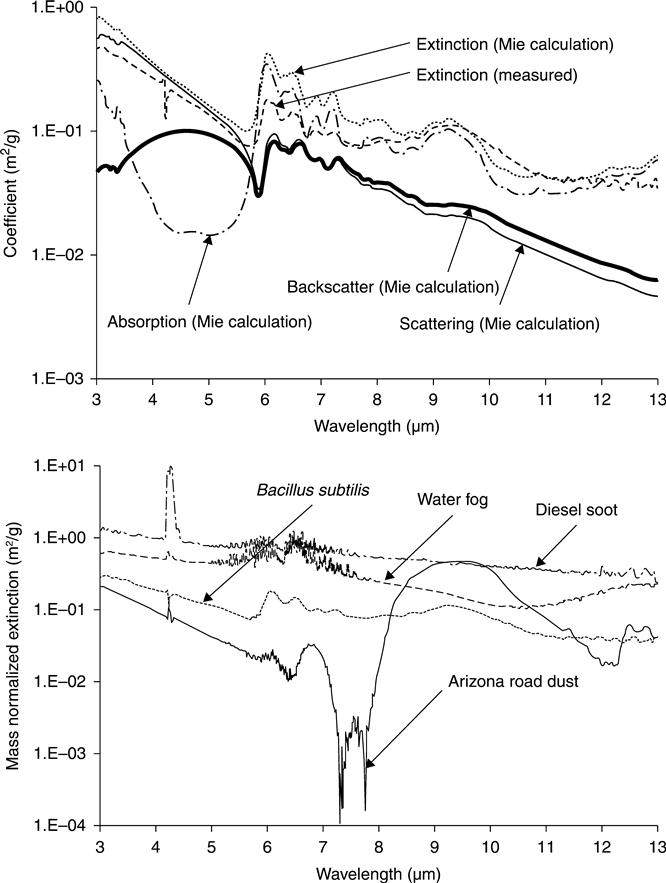
Biological materials have strong absorption in the long-wave IR region, and hence this optical property can be used for their detection. Figure 12.9 shows the measured extinction and scattering coefficients for aerosolized BG simulant and three common interferents – Arizona road dust, water fog and diesel smoke. From this it is seen that there is a strong potential for using multi-wavelength IR differential scattering for detection and discrimination of biological aerosols. Scientists in Edgewood, Maryland have employed a transversely excited CO2 frequency agile laser (FAL) to detect and discriminate between biological simulant and interferent aerosols.24,25 This FAL system was developed earlier for standoff detection of chemical materials, and can be rapidly tuned to many discrete wavelengths in the 9–11 μm region (see Plate VII in the color section between pages 256 and 257).26
However, there are several challenges to overcome for the long-wave IR differential scattering method. These include CO2 laser pulses having a longduration and a long tail, thus reducing spatial resolution and requiring deconvolution, reduced elastic backscattering cross-section with longer wavelengths, broad absorption features common to all large biomolecules making it harder to distinguish between interferents and agents, and variation or inhomogeneity in atmospheric humidity complicating a remote analysis.
As mentioned earlier, a key goal of the Bio-Lidar community has been to minimize false alarms, and there is some potential for this to be accomplished by combining several independent, orthogonal and measurable parameters. For example, adding a near-infrared depolarization measurement capability to a more conventional near-IR elastic scatter+UV fluorescence Lidar may be possible because implementation can be achieved with relatively minor modifications to the Lidar. Specifically, integration of a depolarization ratio feature has the potential to provide a third orthogonal discrimination parameter, as shown in the notional construct portrayed in Plate VIII (see color section).
This approach shows three dimensions of discrimination via three parameters: size parameter (obtained from the differential IR:UV elastic backscatter), fluorescence parameter and depolarization ratio. Based on modeling several simulant materials with interferents, the simulants were seen to congregate within the discrimination region while the interferents were outside. As more discrimination parameters are added, an algorithm could perhaps be extended to n-dimensions, with the rate of false alarms expected to reduce with each addition.14
12.6.4 Lidar system consideration and atmospheric transmission
An important consideration for the effectiveness of any optical remote sensing system such as Bio-Lidar is how the atmosphere modifies the transmitted laser beam and the return signal. Thus, the choice of the best wavelength depends on the required range and how sensitive it is to the atmospheric constituents – especially water vapor and ozone, which can attenuate the transmitted laser beam and the return signal. Plate IX (see color section between pages 256 and 257) shows that the strong atmospheric extinction by ozone and Rayleigh scattering limits the short-wave UV system to about 3 km, which is sufficient for most discriminations. The transmittances are calculated using the MODTRAN program (available from Ontar Corp.). While 355 nm UV has good atmospheric transmission and good eye-safety, the high solar background limits its utility in daytime.
As shown in Plate X (see color section), near-IR wavelengths are very good for atmospheric transmission and detection of aerosol clouds at ranges well beyond 15 km. This can be done by compact eye-safe micro-pulse Lidars operating at near 1 micron wavelength using photon counting detection, as demonstrated by us.27 The high pulse-energy analog detection Lidar systems can also achieve similar range capability, but may not be eye-safe at a 1 micron wavelength. Hence, use with analog systems is generally limited to wavelengths longer than 1.5 microns, wherethe eye-safe energy is three orders of magnitude higher than that for the 1 micron wavelength. The atmospheric window in long-wave IR between 9 and 11 microns allows Lidar measurements with the CO2 laser, although as the humidity increases the broadband water vapor continuum absorption increases dramatically and rapidly decreases the atmospheric transmittance.
Another key area for improvement is the need to reduce price. Today, the current price point is limiting use, and any volume production sensor will need to have a significantly reduced price in order to gain acceptance and wider use. For example, current UV-LIF, Infrared Depolarization and/or LWIR DISC sensors are largely specialized instruments that reside in the $0.75 million to $1.5 million range. This is three to six times the price of a mature bio-aerosol point sensor, and perhaps the equivalent of asking someone to spend $2000 on an iPhone; simply too high a cost for the perceived benefit. Thus, along with the technical work to be done, there also needs to be extensive work and/or rethinking to reduce the price point; which leads us into deriving value from integration.
12.7 The value of integration
We know that the whole is equal to the sum of the parts, and that integrating components into a System of Systems construct can help to derive maximum capability at minimum cost. Moreover, the evolving world of networked sensing and unmanned systems is presenting some exciting opportunities that were not available several years ago. Recently, some have been suggesting that robotic and autonomous systems can hunt cloud targets with an ability to get close or inside the threat so as to provide a (point) sensing capability orthogonal to standoff detection. Accordingly, we see very good potential for Bio-Lidar sweeps being able to avert robotic wandering and help mobile sensors find their targets fast. Thus, a ‘sweep-to-cue’ approach may be a better way of thinking, because a networked Bio-Lidar ‘sweep-Jo-cue’ can leverage unmanned aerial vehicle (UAV)/unmanned ground vehicle (UGV)/point sensors for a true synergy, yielding fastest detection and identification for maximum benefit at minimum cost each (Fig. 12.10).
• In one embodiment, Bio-Lidar detection/mapping/tracking can be netted to fixed point sensors such that a Lidar sweep prompts specifically zoned point sensors to activate and wait on cloud arrival for identification and reporting.
• In a second embodiment, Bio-Lidar detection/mapping/tracking can be netted to UGV point sensors such that a Lidar sweep prompts specifically zoned UGV-based point sensors to activate and move towards a cloud target for identification and reporting.
• In a third embodiment, Bio-Lidar detection/mapping/tracking can be netted to UAV point sensors such that a Lidar sweep prompts specifically zoned UAV-based point sensors to activate and move towards a cloud target for identification and reporting. Based on prior experience, absence of Bio-Lidar sweeps can result in robotic wandering and time lost in mobile sensors finding their targets.

12.8 Conclusions and future trends
Early warning of pending threats can avert loss of life and property, with the value of early warning rising with the consequence of potential calamity. Clearly, Weapons of Mass Destruction present potentially serious consequences for military and civilian populations, and the establishment of WMD early warning protective measures has been a focus for many.
In this chapter, we examined the value-added contribution of Lidar (LIght Detection And Ranging) for the biodetection aspect of WMD defense and provided an overview that described the essential elements. We have attempted to show that the value of Lidar for early warning is clear, and the overall contribution can be more than the sum of parts when integrated within a system of systems network. A key hurdle, however, is providing useful capability at an improved price point. To this end, we believe an important focus area will be to drive down Lidar costs and effect wider value-adding contributions. Thus, we see good potential for a networked Bio-Lidar providing essential early warning via ‘sweeping-to-cue’ that then leverages UAV/UGV/point sensors for true synergy with fastest detection at minimum system of systems cost and risk.