
Integration solutions play a key role in many organizations' technology offerings. While much time and effort are typically spent on the actual implementation of these solutions, administration and maintenance tasks are often treated as second-class citizens. This reality can have costly consequences, as downtime of integration points can have large financial impacts on businesses.
To help make administration and operation more efficient, a number of enhancements have been built into BizTalk Server 2010. The BizTalk Administration Console includes two pieces of key functionality: the Group Hub page and application views. The Group Hub page exposes information for a single BizTalk Server, providing a view into the health of the server and allowing for troubleshooting and triage of issues. Specifically, the Group Hub page provides the following:
Queries for work in progress and suspended items (service instances and messages)
The ability to perform bulk operations (terminate, suspend, or resume) on service instances
The ability to build and save custom queries to return information on service instances and messages
Enables troubleshooting of service instances and messages
Allows for debugging of orchestrations
The application views expose information for a single BizTalk Server application. An application is a logical grouping of BizTalk artifacts. By grouping artifacts, applications allow them to be managed as a single unit as opposed to individual items. Applications can be started and stopped, which starts and stops all the underlying artifacts, such as orchestrations, receive locations, and send ports. When an application is started or stopped, the individual artifacts are started or stopped in the correct order, accounting for all interdependencies. Applications also facilitate a number of deployment related tasks, such as importing and exporting.
If you've used previous versions of BizTalk Server, you will notice that Health and Activity Tracking (HAT) is no longer available as a stand-alone tool. Portions of it continue to be used from within the BizTalk Administration Console (such as the orchestration debugger), and BTSHatApp.exe is in the root of the BizTalk folder—however, trying to run it results in an error. All of the HAT functionality has been moved to the Administration Console.
This chapter focuses on the use of the administration tools within BizTalk Administration Console and how to ensure a well-managed BizTalk environment and a streamlined troubleshooting process.
A variety of tools can be used for troubleshooting suspended instances. The BizTalk Administrator Console is the first place to look in helping to identify why errors occur in an integration solution and to determine the best way to fix them. Other tools include the Windows event log, SQL Server, and other external applications.
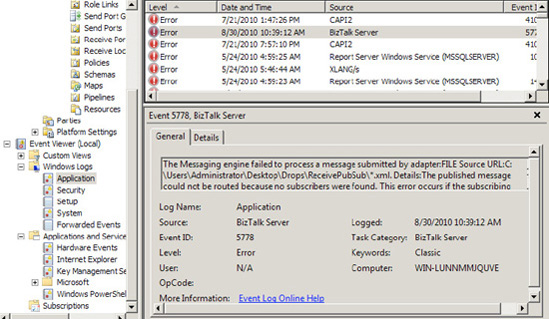
Often, the event log gives the first indication an error has occurred in BizTalk, especially during the development stages of an integration project. BizTalk Server writes errors to the application event log each time it suspends a service instance. The error event contains helpful information on when, why, and where the fault happened. You can view errors posted to the event log by BizTalk Server through the BizTalk Administrator Console, which includes the Event Viewer MMC snap-in.
Frequently, the event log will have enough information to determine what action needs to be taken to fix the error (server name not specified on the SMTP adapter, for example), but often, further troubleshooting is necessary. To obtain more detailed information about the fault, you can use the BizTalk Administrator Console's Group Hub page, which provides a number of ways to search for suspended service instances.
The following steps outline a procedure for troubleshooting a suspended service.
Open the BizTalk Administration Console.
Expand the
Event Viewerfolder in the left pane, click Windows Logs, and select Application. You should see an error event relating to the service instance that was suspended. This event is flagged with a BizTalk related source, such as BizTalk Server or XLANG/s. See Figure 10-1.To obtain more detailed information about the event, expand the BizTalk Server
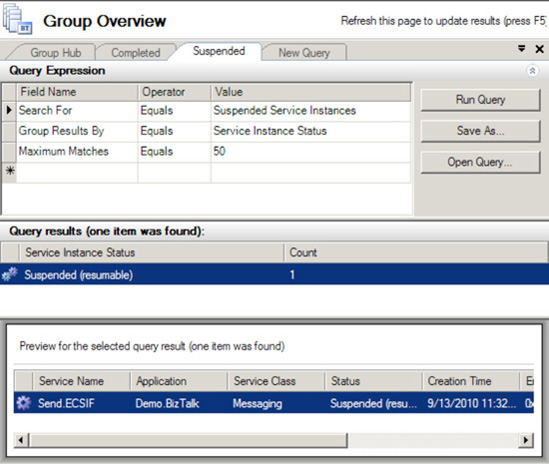
Administrationfolder in the left pane, and select your BizTalk group. This opens the Group Hub page.Click the Suspended service instances link in the Suspended Items section. Clicking this link launches a query window, as shown in Figure 10-2.
Note
The Group Hub page also provides filtered views of suspended service instances, including resumable service instances; nonresumable service instances; suspended MSMQT messages; and suspended service instances grouped by application, error code, service name, and URI. All queries are customizable.
Order the query results on the Creation Time column by clicking the column header. You can compare the creation date with the timestamp of the error event log entry to determine if they relate to one another.
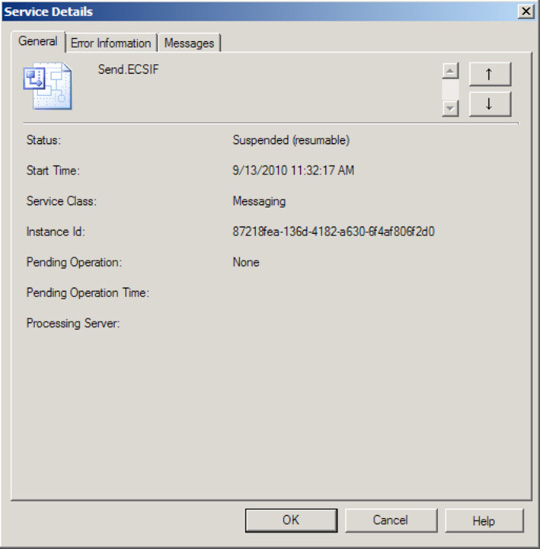
Once you have found the appropriate suspended service instance in the query results list, double-click the row to launch the Service Details dialog box, as shown in Figure 10-3. The General tab of this dialog box includes high-level information regarding the suspended instance, including the BizTalk component that encountered the error, the service's status, and the instance ID. Knowing the particular component that encountered the error is a valuable and significant piece to the troubleshooting puzzle, as it assists in narrowing down where the fault occurred.
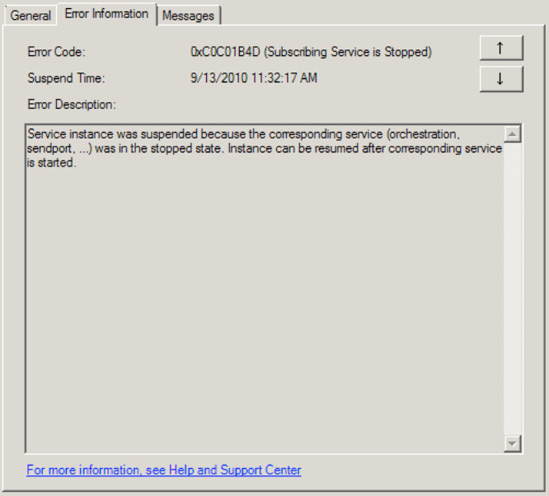
Click the Error Information tab. As shown in Figure 10-4, this tab displays the text of the exception that the suspended service instance encountered, which is the same as what is written to the application event log. The error text usually includes key stack information, indicating at what level the fault occurred and how it was bubbled up through BizTalk. In our example, the instance was suspended because the send port was stopped.
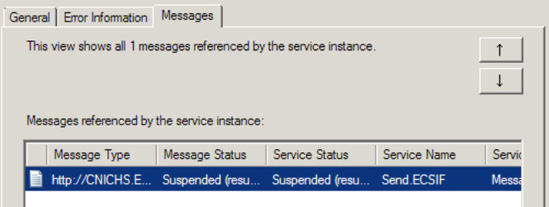
Click the Messages tab. As shown in Figure 10-5, the Messages tab displays a list of all messages related to the suspended service instance. From this tab, you can save the suspended message to a file for further inspection, turn on tracking for the message, or view additional details of the message (right-click the message for these capabilities).
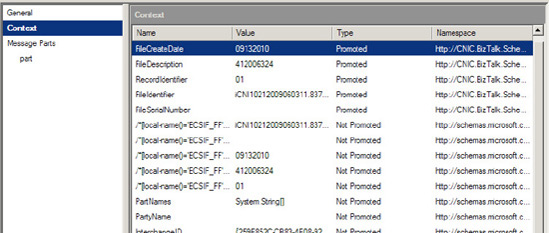
Double-click one of the messages, and select the Context section, as shown in Figure 10-6. This view displays the context of the suspended message, which can be especially helpful when troubleshooting. Particularly, it alerts you to what properties the message had when it was suspended and which were promoted.
When errors occur in your integration solutions, BizTalk typically suspends the service instance encountering the error. Service is a generic term used to describe an area of BizTalk processing, such as orchestration, messaging, or adapter. Service instance refers to a specific instance of the orchestration, messaging, or adapter component. The troubleshooting tools of BizTalk are primarily used by system/solution administrators and are not typically used (in a production environment) by developers or testers.
Finding the particular suspended service instance you are troubleshooting is the first step in solving the issue. In this recipe's solution, we compared the timing of event log errors and suspended services to find a specific instance. This technique of timestamp comparison would not work well if you were troubleshooting a long-running service instance (in which case, the creation time of the instance and the time of the error may be significantly different). While our solution used a simple way of locating the suspended instance, more-advanced methods can be useful, especially in production, heavy-load, or long-running environments.
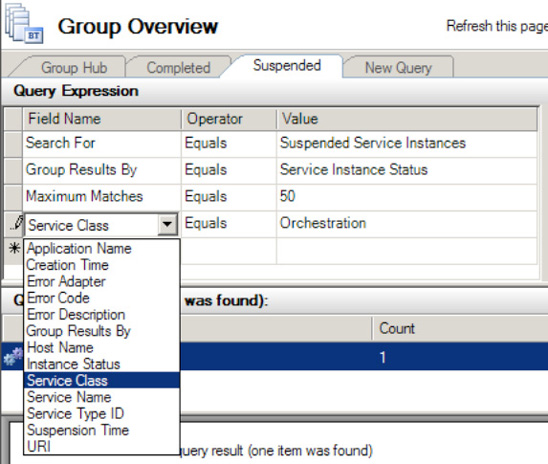
You can search for instances based on all sorts of information. To add additional filter criteria to the report, in the BizTalk Administration Console, take the following steps:
Click a new row in the Query Expression pane, under the Field Name column.
Add the desired column, as shown in Figure 10-7.
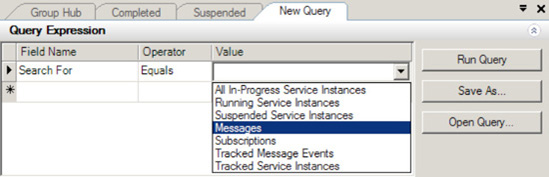
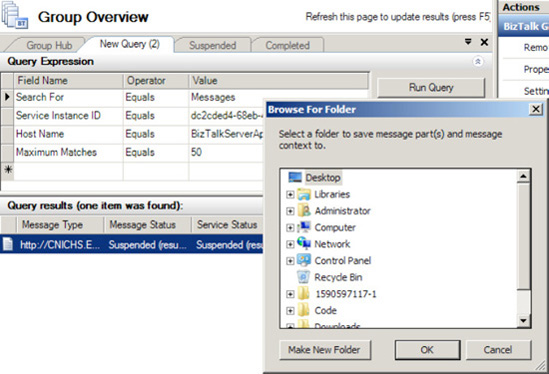
The BizTalk Administration Console also allows you to create your own queries to find suspended service instances. Click the New Query tab (shown in Figure 10-8) available in the BizTalk Group Hub Overview area. You can save and retrieve custom queries for future troubleshooting needs (a query can be saved by using the Save As button and storing the file for later retrieval).
Once you have found your suspended service instance, the details that BizTalk Server tracks against the suspended instance provide a solid starting point for determining the best way to fix the issue. In general, you should use generic problem-solving skills when troubleshooting BizTalk errors: break down the problem into its component parts, and use the tools at your disposal to evaluate the fault using a bottom-up approach. Using the BizTalk Administrative Console allows you to break down complex solutions into manageable parts and troubleshoot the specific component encountering the error.
Your integration solution has encountered an error, and you need to resubmit the messages that have been affected by the fault.
The BizTalk Administrator Console allows you to resume service instances and resubmit their associated messages. You can locate the suspended service instance (which will contain the suspended message) that you need to resume and then choose to resume it, as follows:
Open the BizTalk Administration Console.
Expand the BizTalk Server
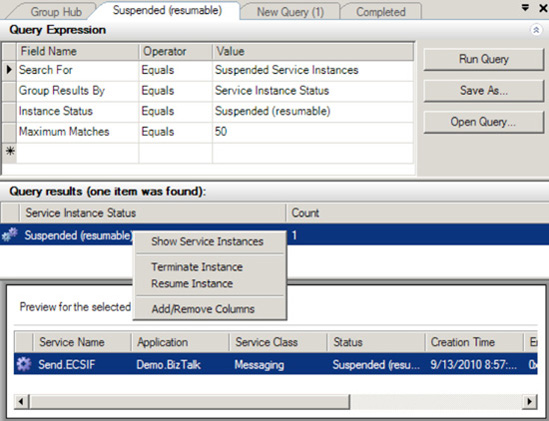
Administrationfolder in the left pane, and select your BizTalk group. This opens the Group Hub page.Click the Resumable link in the Suspended Items section. This launches a query window displaying all suspended service instances in your BizTalk environment that can be resumed.
If you are unsure if a particular suspended service instance contains the message you need to resubmit, right-click the instance record in the results pane, and select Show Messages. This displays a list of messages referenced by the service instance, allowing you to drill down further into the message details and interrogate the actual message, its context, and the flow the message took prior to suspension.
When you have located the service instance you need to resume, right-click the record in the results pane, and select Resume Instance, as shown in Figure 10-9. In addition to resuming single suspended service instances, you can also resume multiple instances by holding down the Ctrl key and selecting multiple rows in the results pane. To resume all instances, right-click the header record in the results pane, and select Resume Instances.
BizTalk errors can be caused by a number of faults, including hardware or network failure or errors during pipeline or adapter processing. When errors occur in your integration solutions, BizTalk typically suspends the service instance that encountered the error. Services are areas of BizTalk processing—such as orchestration, messaging, or adapter—and service instances are specific instances of the orchestration, messaging, or adapter component. A service instance may contain one or more suspended messages. BizTalk differentiates between two basic types of suspension events: resumable (the service instance can be restarted) and nonresumable (the instance cannot be restarted).
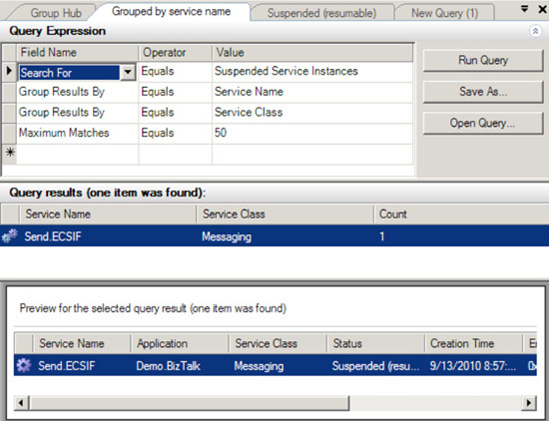
Finding the service instance that contains the message you want to resubmit is critical. A number of methods for searching for suspended instances are provided by BizTalk. If you know that you must resubmit a message that was suspended in a specific orchestration, a quick way to search for service instances is to click on the Grouped by Service Name link on the Group Hub page, as shown in Figure 10-10.
In addition to resuming services instances normally, you can also resume service instances in debug mode. Resuming in debug mode will restart the service instance at the last successful persistence point prior to the error.
BizTalk also provides Windows Management Instrumentation (WMI) methods for resubmitting suspended service instances, such as MSBTS_ServiceInstance.Resume and MSBTS_HostQueue.ResumeServiceInstancesByID.
Finally, messages can be manually resubmitted. This process involves finding a particular service instance or message via the BizTalk Administrator Console, saving the message data, and using a resubmit mechanism (such as ports or administrative tools) to resend the message through BizTalk. To save a message, right-click the record (in the BizTalk Administrator Console), and select the option for saving the tracked message(s). While this method is generally more time consuming and task intensive, it can be particularly helpful when the error is such that it would be significantly difficult to successfully resume a suspended service instance. You should consider the following when manually resubmitting messages:
Security, with regards to encryption and authentication
Data privacy and protection for sensitive information
User error if data is manipulated
You have BizTalk solution artifacts that should be grouped together for ease of management and maintenance. Specifically, you would like to group BizTalk Solution components so that you can easily deploy those components to another environment as well as start and stop the components together as a whole.
You can use a BizTalk application to group and manage BizTalk solution artifacts. As outlined in the following steps, the process involves creating the new application, configuring it, and then adding components. After creating the BizTalk application, you can import BizTalk MSI files and bindings and add previously created BizTalk assembly DLLs, scripts, and resources. The instructions in this solution describe the process for adding a BizTalk assembly DLL that contains multiple schemas.
Open the BizTalk Administration Console.
In the left pane, right-click the
Applicationsfolder, and choose New
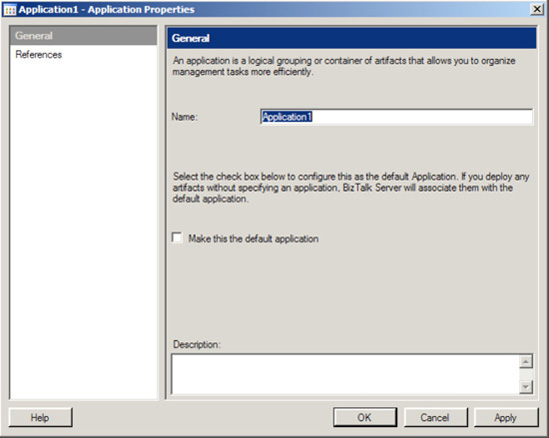
In the Application Properties dialog box, make the following settings, and then click the OK button to create the new BizTalk application.
Enter the name of the application that you are creating.
Specify if this application is the default application. Identifying your application as the default application is significant when deploying new BizTalk artifacts from Visual Studio. Unless you specify an application in Visual Studio, your BizTalk artifact deploys to the default BizTalk application. A BizTalk artifact that does not specify a deployment application name will be grouped in your newly created default application.
Identify any application references. Identifying application references allows you to share resources across applications. For example, if you have a common set of shared schemas, maps, or pipelines, you can specify them as part of an application reference and not need to make multiple copies of those components for each BizTalk application.
After the application is created, verify that the artifacts have been bound appropriately. Right-click the application and choose Start.
Note
When you start a BizTalk application, you have the choice of enlisting and starting all orchestrations, send ports, send port groups, receive locations, host instances, and resuming suspended instances.
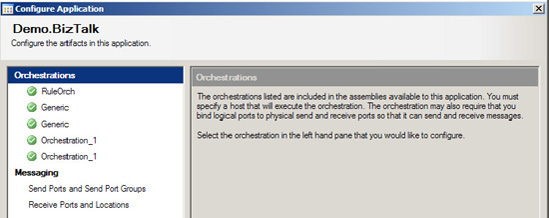
To configure your application, from the BizTalk Administration Console, right-click it, and choose Configure. You will be presented with a Configure Application dialog box, shown in Figure 10-12. Here, you can configure binding, host, role links, and messaging/port settings for your application. Click OK after completing your configuration.
From the newly created application, right-click and choose Add
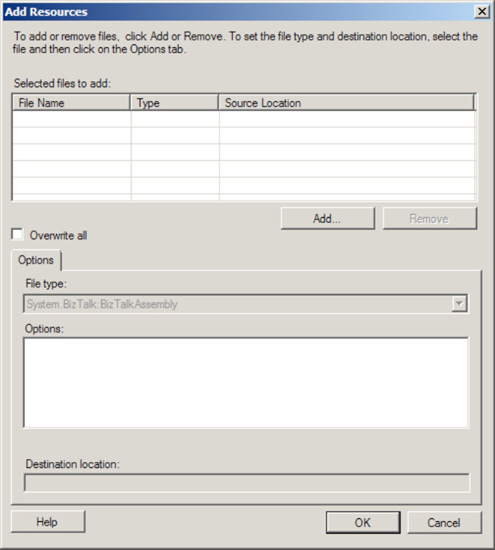
Click the Add button to identify the assemblies to add to the BizTalk application. You can add assemblies (BizTalk or custom), scripts, bindings, COM objects, and other objects to your BizTalk application. This dialog box includes the following settings:
Overwrite all: This flag indicates whether to overwrite an existing resource in the Management database with the resource specified in the application. If you do not specify this flag and you have a resource that contains the same name, the process will fail when trying to add the object.
Options: Depending on the type of resource being added, you have different options. For example, if you are adding an assembly to your project, you also have the option to add the assembly to the Global Assembly Cache (GAC), make the resource visible to COM, and register the component as a serviced component. Remember any assembly you wish to add to the GAC must be signed with a strong name key (this can most easily be done through the project properties in Visual Studio).
Dependencies: You will receive a list of dependencies if you choose to add an assembly (BizTalk or custom) to your BizTalk application.
Destination location: This is the location or path where the resource file will be copied when the application is installed. You may specify an absolute, relative, or UNC path. The default path copies the resource file to the application installation folder.
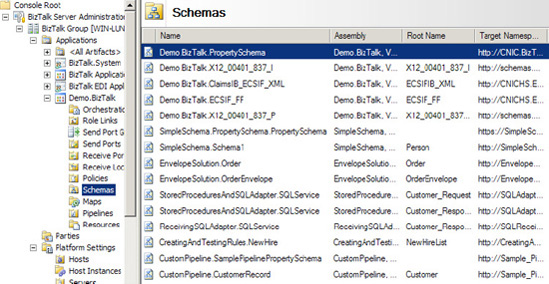
When you have selected the resources to add to you BizTalk application, click the OK button. Figure 10-14 shows an example of a BizTalk application with a schema resource added. Notice that BizTalk automatically manages the placement of the resource into the correct folder location within the BizTalk application.
BizTalk applications represent a powerful concept in organizing BizTalk artifacts into logical groupings. You can group like or related artifacts together in a BizTalk application. Once BizTalk artifacts are grouped logically, it is possible to export the application to another BizTalk environment. The concept of applications simplifies management, troubleshooting, and deployment of BizTalk artifacts.
The monitoring tools that are included in the BizTalk Administration Console take advantage of the BizTalk application concept. Multiple BizTalk solutions can be managed through logical application groupings.
BizTalk is set up with a default application container under which all BizTalk artifacts are deployed to by default. When you upgrade a previously created BizTalk solution, the artifacts will initially be placed in the default application. Additionally, in the following situations, BizTalk artifacts will be placed in the default application:
When you deploy BizTalk artifacts from Visual Studio without specifying an application
When you use
BTSDeployto deploy BizTalk artifacts (because this tool was created for a previous version of BizTalk)When you use
BTSTaskwithout specifying an application name
Note
If you perform automated deployment, make sure to use the BTSTask tool instead of the deprecated BTSDeploy tool. With BTSTask, you can specify the application under which your BizTalk artifacts are deployed. If you continue to use the BTSDeploy tool, your BizTalk artifacts will be deployed to the default BizTalk application.
Consider using a separate BizTalk application in the following situations:
When sharing BizTalk assemblies across multiple applications: In this situation, group BizTalk assemblies in a separate application.
When sharing a deployed web site: The best approach here is to implement the shared web site in a separate application. When uninstalling a BizTalk application that contains a web site, the virtual directory of that web site will be removed even if it is currently being used. Any other application sharing that web site will encounter exceptions if that web site is removed.
When sharing a policy across multiple applications: In this situation, create a separate application for that policy. When you stop a BizTalk application that includes a policy, the policy is undeployed. If another application is referring to the undeployed policy, you will encounter exceptions.
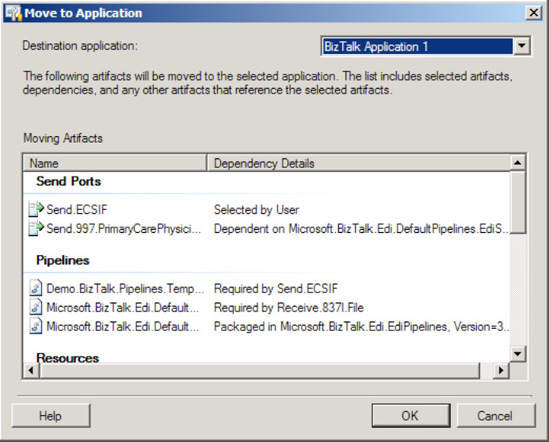
You can move artifacts between BizTalk applications in the same BizTalk group by selecting an application resource, right-clicking, and choosing Move To Application from the context menu. This will launch the Move to Application dialog box (see Figure 10-15), where you can choose a new BizTalk application. If you need to move artifacts to another BizTalk application in a different BizTalk group, you must export the artifact and then import it into the other BizTalk group's application.
You can use BizTalk's Orchestration Debugger, which allows you to set breakpoints on any shape in an orchestration. Once an instance of an orchestration executes and encounters one of these breakpoints, it will go into a wait state in the BizTalk MessageBox, allowing a developer or administrator to manually step through the orchestration.
Note
A dehydrated orchestration is an orchestration that has been removed from memory and persisted to SQL Server while it waits for its next action to occur, such as receiving a document. Upon this next action, the orchestration is returned to memory in the exact state prior to dehydration, and processing continues. This ability to dehydrate/rehydrate allows BizTalk Server to better utilize server resources.
The following steps demonstrate setting how to debug an orchestration.
Open the BizTalk Administration Console, and navigate to the BizTalk Group Hub page.
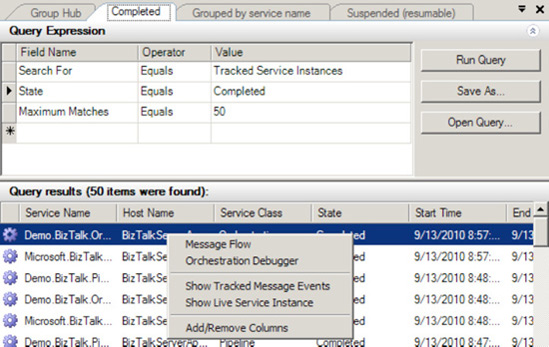
Find an instance of a currently running orchestration that you wish to debug, or find a completed instance of an orchestration that you wish to debug future instances of. For this example, click on the Completed Instances link on the Group Hub page, which will show a list of all instances (orchestrations and otherwise) that have completed.
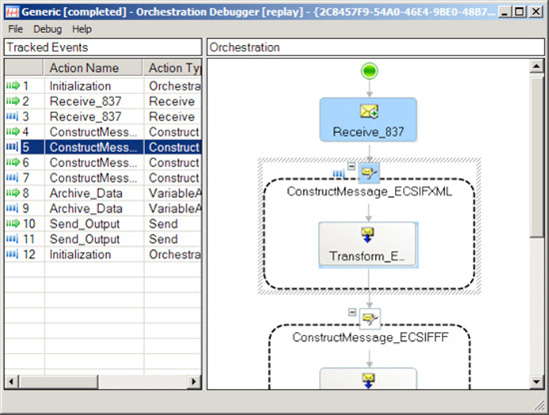
Right-click the instance of the orchestration to debug, and select Orchestration Debugger, as shown in Figure 10-16. The Orchestration Debugger window will open. The full orchestration will appear with a pane on the left showing a list of tracked events, as shown in Figure 10-17.
To set a breakpoint, right-click any shape, and select Set Breakpoint on Class.
Step through the orchestration by clicking tracked events in the left pane.
At any time, select Debug
Click through the tracked events in the left pane to see which steps have executed by highlighting the corresponding orchestration shapes in the right pane. The color green indicates input to a shape, and blue indicates an exit from a shape. This will aid in determining which paths have been followed (in the case of Decide and Parallel Action shapes), how many times they may have executed (for instance, how many times a loop has executed), and which step in the process may be causing an error.
If desired, step into a child orchestration by clicking the event in the Tracked Events pane, which corresponds to the Call Orchestration shape. Right-click the event, and select the option to step into the child orchestration.
Once all debugging has been completed on an orchestration, make sure to clear all breakpoints. Open the Orchestration Debugger on an instance of the same orchestration (any instance will do), and select Debug
While the Orchestration Debugger can be a helpful tool, especially in cases where an orchestration is deployed in a production environment and is encountering errors, developers often need a much more rapid and controllable method for debugging. It is helpful to have logging in development and in production, and the ability to turn it on and off for any given process at any given time should be available. Several techniques enable this type of debugging.
For example, using two standard .NET lines of code will allow a view into what is happening in an orchestration without opening the Orchestration Debugger:
System.Diagnostics.EventLog.WriteEntry("Demo","Value: " + strValue);
System.Diagnostics.Trace.WriteLine("Value: " + strValue, "Demo");
The System.Diagnostic.EventLog.WriteEntry method will log entries to the Windows Event Viewer. To view this logged event, open the Control Panel, select Administrative Tools, and double-click Event Viewer. Events will be logged to the application log, and you'll need to refresh the display to see results as they are written.
Note
The user that runs the orchestration (whatever the host user has been configured to be) must have rights to write to the Event Viewer to use the System.Diagnostic.EventLog.WriteEntry method.
The System.Diagnostics.Trace.WriteLine method will allow all of the trace outputs to be read by attaching to the main BizTalk executable and monitoring in Visual Studio. Use the following steps to do that monitoring:
One way to use the System.Diagnostic methods for debugging/tracing in orchestrations is to wrap the logging code in an If statement and create a TraceFlag that can be set in a configuration file, such as the BTSNTSvc.exe.config file in the root BizTalk Program Files folder. Here is an entry you could add to the BTNTSvc.exe.config file:
<add key=" TraceFlag" value="true"/>
Listing 10-1 demonstrates how to retrieve the TraceFlag and, based on its value, log information.
Example 10.1. Configurable Trace Flag
// set the trace flag based on a value stored in the BizTalk Config File
// note that blnTraceFlag must be defined in the orchestration variables
blnTraceFlag = System.Convert.ToBoolean(System.Configuration.
ConfigurationSettings.AppSettings.Get("TraceFlag"));
// set the source to something unique for this orchestration
strSource = "DebugDemoOrchestration";
// Trace
if(blnTraceFlag == true){
strValue = System.Convert.ToString(intValue);
System.Diagnostics.EventLog.WriteEntry(strSource,"Value: " + strValue);
System.Diagnostics.Trace.WriteLine("Value: " + strValue, strSource);
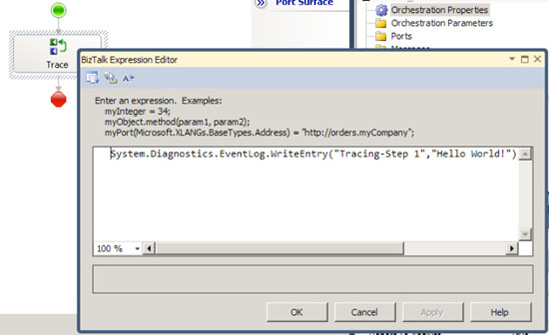
}When using this approach, keep tracing information separate in the orchestration from other functionality, and label it appropriately. You can do this by dedicating an Expression shape to a single trace event and naming it Trace (for example), as shown in Figure 10-18.
One of the most helpful ways to debug is to see the actual XML of a message, especially before and after mapping. This can be done by setting a variable of type System.Xml.XmlDocument equal to an orchestration message and then tracing the value of this variable, as shown in Listing 10-2.
Example 10.2. Tracing XML
// set the xmlDoc variable equal to the message to be traced.
// msgOrch is an orchestration message
xmlDoc = new System.Xml.XmlDocument();
xmlDoc = msgOrch;
System.Diagnostics.EventLog.WriteEntry(strSource,"Value: " + xmlDoc.OuterXml);
System.Diagnostics.Trace.WriteLine("Value: " + xmlDoc.OuterXml, strSource);
Note
The maximum size of a string that can be written to the Windows Event Viewer is 32KB. Often, XML messages will exceed this size. If a string longer than 32KB is written, an exception will be thrown, and the orchestration will terminate (unless appropriate exception handling is implemented). You can truncate the length using .NET code. There is no limitation to the size when using the Trace.WriteLine method.
You want to be able to view the contents of messages that have arrived in a given BizTalk solution to monitor messages and actions that have been processed through ports and orchestrations.
The ability to monitor orchestration activity and access message contents and flow is known as tracking messages. BizTalk allows tracking to be set at a number of different levels. This solution describes how to configure tracking so that messages can be saved in their entirety and viewed in any text editor. You can configure tracking using the BizTalk Administration Console.
The following steps outline the procedure to configure tracking on receive ports, send ports, and on any orchestrations where messages need to be tracked.
Open the BizTalk Administration Console.
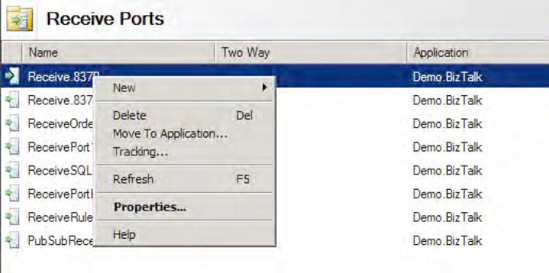
Expand the tree in the left pane until the BizTalk application that contains the solution on which you want to configure tracking is visible, and then click the
Receive Portsfolder.In the right pane, right-click the receive port that is to be configured for tracking, and select Tracking, which is shown in Figure 10-19.
In the Tracking Options dialog box, set the desired options for tracking. The settings are generic across one-way and two-way ports.
Request Message Before Port Processing: Request messages exist in one-way and two-way ports. Checking this value will track the message prior to being processed by the port (processing includes any pipelines or maps that may be on the port).
Note
A message is a request if the message is initiated by the port/orchestration. A message is a response if the port/orchestration is receiving it from an external source.
Request Message After Port Processing: Checking this value will track the message after it is processed by the port (processing includes any pipelines or maps that may be on the port).
Response Message Before Port Processing: Response messages exist on two-way ports only. Checking this value will track the message prior to being processed by the port (processing includes any pipelines or maps that may be on the port).
Response Message After Port Processing: Checking this value will track the message after being processed by the port (processing includes any pipelines or maps that may be on the port).
If desired, configure tracking for send ports. Right-click the send port, select Tracking, and choose options in the Tracking Options dialog box.
Configure tracking on the appropriate orchestrations. In the left pane of the BizTalk Administration Console, click the
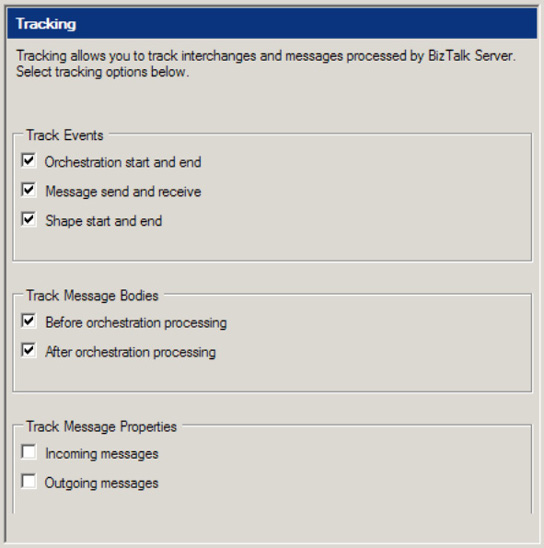
Orchestrationsfolder. In the right pane, right-click the orchestration, and select Tracking. In the Orchestration Tracking Options dialog box, you can configure tracking on events and on messages within the orchestration, as shown in Figure 10-20.
After you have configured tracking through the BizTalk Administration Console, access the tracked messages as follows:
Drop a message on the appropriate receive location to instantiate the orchestration.
Open the Group Hub page, and run a query that will return message instances.
Right click the message, and select Save to File to select a folder to save to, as shown in Figure 10-21.
Depending on the complexity of the orchestration, the number of send and receive ports, and the level of tracking configured, there may be a few or a large number of messages written out to the directory specified. A combination of system messages and XML messages will have been tracked.
There is a direct relation between the level of tracking configured for a given solution and the size of the underlying BizTalk databases. For solutions with high levels of tracking and a high volume of message transactions, databases can grow quickly. An intelligent approach to traditional SQL database management is required, especially as it pertains to table truncation and data backups.
You have a number of new configurations in your BizTalk applications. You want to refresh everything and make sure all configurations are acknowledged by BizTalk Server.
Refreshing BizTalk Server is quite simple—restarting the BizTalk Host instance(s) essentially refreshes all of the configurations and running instances in the MessageBox. To perform the restart, take the following steps:
Open BizTalk Administration Console.
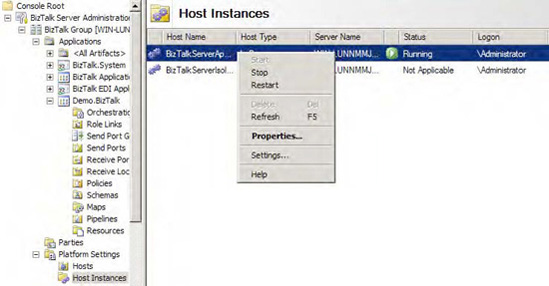
Expand the BizTalk Group, expand the Platform Settings folder, and click Host Instances.
Right-click the Host Instance that you want to restart, and select Restart (shown in Figure 10-22).
Occasionally, especially during development, you will need to restart the BizTalk host instances. When deploying new configurations, new referenced .NET assemblies, and new shared maps and schemas, it is important to restart the host to ensure all of the new artifacts are referenced properly (and that old references are forgotten). It is also helpful to stop the whole BizTalk host instance when you want to turn off all processing to ensure that nothing is received or sent, regardless of the status of the send and receive ports.
You need to optimize the memory use of orchestrations running on one of your BizTalk Server groups.
The new BizTalk Settings Dashboard allows for the configuration of a variety of core settings that control memory usage and performance. To access the tool, take these steps:
Right-click the BizTalk Server Group, and select Settings. The BizTalk Settings Dashboard will open.
Click the Host Instances tab.
Select the Orchestration Memory Throttling tab (see Figure 10-23).
Change the memory usage to the desired percentages.
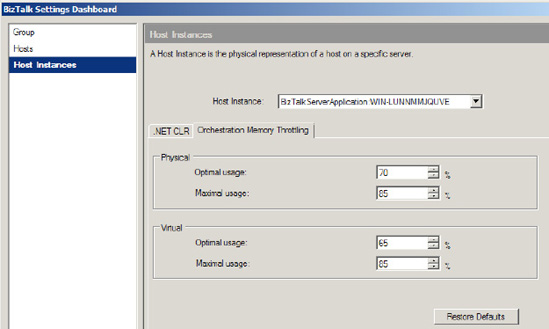
The new BizTalk Settings Dashboard is hidden within BizTalk, but it is an extremely powerful tool. Orchestration performance is one of the features, but there are a wide variety of additional features that will prove to be useful. Take a look at the tool and see what properties will help improve the performance of your deployment. The default settings are usually fine to keep, but for advanced solutions, it may be necessary to make alterations.
BizTalk has encountered an error and suspended the processing of an inbound message. You need to fix the error and resume message processing to receive it successfully.
This example demonstrates the resumable inbound message-processing capabilities of BizTalk. BizTalk initially receives a message that has no recipients. In the publish/subscribe architecture of the MessageBox, the error message will indicate that BizTalk cannot find a subscriber to the message. After creating the appropriate subscription, this example resumes processing and successfully delivers the message.
Begin by creating the receive port and receive location that will accept the message:
Right-click the
Receive Portsfolder under an application, and select NewEnter SuspendedMessagesExampleIn for the name of the new receive port.
Add a receive location to the receive port, using the default
PassThroughReceivepipeline.Using the File transport type, specify
C:SuspendedMessagesExampleInas the receive folder. Create the folder if necessary.Grant the BizTalk Application Users group full control to the
C:SuspendedMessagesExamplefolder.Enable the receive location.
BizTalk can now receive messages, but the administrator has not specified where BizTalk should deliver the messages. BizTalk will raise an error to the event log and suspend messages received through the SuspendedMessagesExampleIn receive port. Follow these steps:
Place an XML file in the
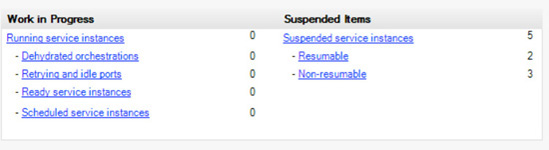
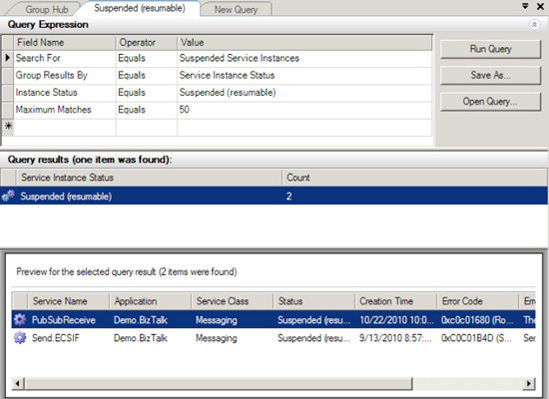
C:SuspendedMessagesExampleInfolder.In the left tree view of the BizTalk Server Administration Console, click the BizTalk Group to show the Group Hub page. Press the F5 key to refresh the Group Overview page. Note that you will be able to see the count of suspended messages, as shown in Figure 10-24.
Click the Suspended Service Instances link to open the Suspended tab. The Suspended tab will display all resumable suspended service instances, as shown in Figure 10-25.
Now that there is a suspended message in BizTalk, create a send port to deliver the message and resume message processing:
Create a new static one-way send port in the same BizTalk application as the receive port was created in.
Enter SuspendedMessagesExampleOut for the name of the send port, and configure the File adapter to deliver messages to the
C:SuspendedMessagesExampleOutfolder. Create the folder if necessary. Use the defaultPassThruTransmitsend pipeline.In the left pane of the SuspendedMessagesExampleOut – Send Port Properties dialog box, select Filters.
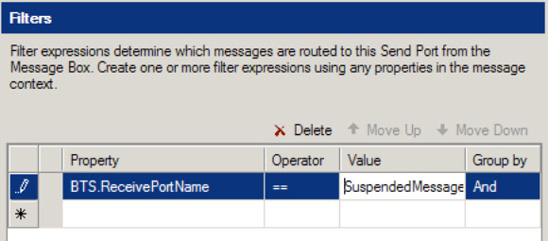
Define a filter where
BTS.ReceivePortNameequalsSuspendedMessagesExampleIn, as shown in Figure 10-26. This will create a subscription for all messages received through theSuspendedMessagesExampleInreceive port.Enlist and start the
SuspendedMessagesExampleOutsend port.On the Group Hub page, return to the Suspended tab.
Select the Suspended (Resumable) query results to display the suspended
SuspendedMessagesExampleInservice instance.Right-click the suspended service instance, and select Resume Instance from the context menu. Click Yes when prompted to confirm. If the Resume Instance option is not available, verify that the selected service instance's status is Suspended (Resumable) under the query results.
Verify that BizTalk successfully delivered the XML message to the
C:SuspendedMessagesExampleOutfolder.
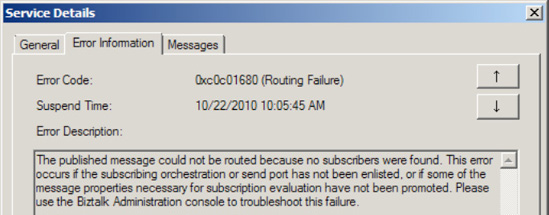
BizTalk supports resumable inbound interchange processing. It suspends the message while receiving it, and the administrator can resume the message after fixing the configuration error. The BizTalk administrator can perform extensive troubleshooting to identify the cause of a suspended message. Double-clicking the Suspended (resumable) service instance shown in Figure 10-25 opens a Service Details dialog box containing detailed information about the suspended message. The Error Information tab, shown in Figure 10-27, displays detailed error information indicating that the message was suspended because BizTalk could not identify a subscriber.
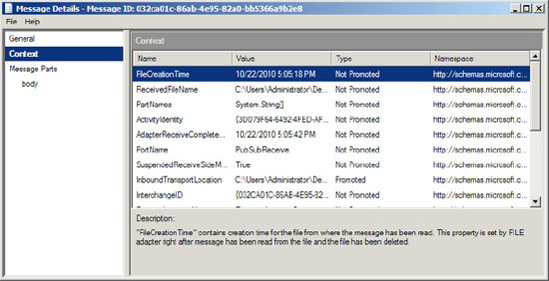
The Messages tab displays all the messages in the suspended service instance. Double-clicking a message opens the Message Details dialog box. Select Context in the left pane of the Message Details dialog box to display the message's context properties, as shown in Figure 10-28. BizTalk can use the Promoted context properties to identify the subscriber of a message.
Back on the Suspended tab of the Group Hub page, the BizTalk administrator can right-click a suspended message and navigate the Troubleshoot Routing Failure submenu to identify the cause of a routing failure.
Although most suspended messages in BizTalk are resumable, in some situations, BizTalk cannot resume message processing. One example is when BizTalk uses order delivery messages in the same order BizTalk receives them. In this situation, resuming a message would also deliver it out of order, so BizTalk prevents resuming the message.