
Our application components must also be profiled to produce instruction-level information and call stacks for us to analyze, not just to track performance but also to debug application flaws. The strace tool can be used to record system calls made by a running docker container. As an example, get the process ID for our orderer container as follows:
docker inspect --format '{{ .State.Pid }}' orderer.trade.com
sudo strace -T -tt -p <pid>
You should see a continuous output, something like the following:
strace: Process 5221 attached
18:48:49.081842 restart_syscall(<... resuming interrupted futex ...>) = -1 ETIMEDOUT (Connection timed out) <0.089393>
18:48:49.171665 futex(0x13cd758, FUTEX_WAKE, 1) = 1 <0.000479>
18:48:49.172253 futex(0x13cd690, FUTEX_WAKE, 1) = 1 <0.000556>
18:48:49.174052 futex(0xc420184f10, FUTEX_WAKE, 1) = 1 <0.000035>
18:48:49.174698 futex(0xc42002c810, FUTEX_WAKE, 1) = 1 <0.000053>
18:48:49.175556 futex(0x13cd280, FUTEX_WAIT, 0, {1, 996752461}) = -1 ETIMEDOUT (Connection timed out) <1.999684>
To analyze the output, read the canonical strace documentation. Note that this tool is available only on Linux systems. Also, in your docker-compose YAML file, you can configure a container to run strace internally. As an example, take the container definition of peer0.exporterorg.trade.com in network/base/docker-compose-base.yaml. You can augment it to enable strace as follows (added configuration italicized):
peer0.exporterorg.trade.com:
  container_name: peer0.exporterorg.trade.com
  cap_add:
   - SYS_PTRACE
  security_opt:
    - seccomp:unconfined
Finally, for information more specific to the Fabric platform and the application you have developed on it, there is Go profiling to turn to. The Fabric components (peers, orderers, and CAs) are written in Golang, as is the chaincode, and finding out which parts of the program use more time and resources are of critical importance in improving the quality of your application. For such profiling, we can use pprof (https://golang.org/pkg/net/http/pprof/), Golang's built-in profiler (https://blog.golang.org/profiling-go-programs). (Please ensure you have go installed on the system in which you intend to run your profiler.) To capture an application profile consisting of call graphs and run frequency (equivalent to CPU usage) of various functions in the graph, pprof requires a Go application to run an HTTP server as follows:
import "net/http"
http.ListenAndServe("localhost:6060", nil)
To get a profile, we can use go tool to hit this server and fetch the data. As an example, if your application is running a server on port 6060, you can get a heap profile by running:
go tool pprof http://localhost:6060/debug/pprof/heap
You can replace localhost with an appropriate host name or IP address in the preceding command. To get a 30-second CPU profile instead, run:
go tool pprof http://localhost:6060/debug/pprof/profile
Hyperledger Fabric provides built-in support for such profiling (https://github.com/hyperledger-archives/fabric/wiki/Profiling-the-Hyperledger-Fabric), at least on the Fabric peer. To enable profiling (or running the HTTP server), we need to configure the peer (or in our case, the docker container running the peer) suitably. Recall that the core configuration for each peer in our sample trade network is defined in network/base/peer-base.yaml. Notice the following lines:
services:
  peer-base:
    image: hyperledger/fabric-peer:$IMAGE_TAG
    environment:
      ......
      - CORE_PEER_PROFILE_ENABLED=true
      ......
Also recall that our peer's port mappings between the container and the host are defined in network/base/docker-compose-base.yaml. Examples of exporter and importer org peers are given as follows:
peer0.exporterorg.trade.com:
  ......
  ports:
    ......
    - 7055:6060
    ......
peer0.importerorg.trade.com:
  ......
  ports:
    ......
    - 8055:6060
    ......
Though within their containers, the profile server runs on port 6060, on the host machine, pprof will hit port 7055 to capture the exporter organization peer's profile and port 8055 to capture the importer organization peer's profile.
As an example, let us capture a 30-second CPU profile of the exporter organization's peer. We can start up the trade network and run the channel creation and chaincode installation steps using middleware/createTradeApp.js. In a different terminal window, we can run:
go tool pprof http://localhost:7055/debug/pprof/profile
This will eventually generate a file in ~/pprof, and spew something like the following on your console:
Fetching profile over HTTP from http://localhost:7055/debug/pprof/profile
Saved profile in /home/vagrant/pprof/pprof.peer.samples.cpu.006.pb.gz
File: peer
Build ID: 66c7be6d1f71cb816faabc48e4a498bf8052ba1b
Type: cpu
Time: May 29, 2018 at 5:09am (UTC)
Duration: 30s, Total samples = 530ms ( 1.77%)
Entering interactive mode (type "help" for commands, "o" for options)
(pprof)
Lastly, the tool leaves a pprof shell to run a variety of profiling commands from, to analyze the obtained dump. For example, to get the top five most active functions or goroutines:
(pprof) top5
Showing nodes accounting for 340ms, 64.15% of 530ms total
Showing top 5 nodes out of 200
      flat  flat%   sum%        cum   cum%
     230ms 43.40% 43.40%      230ms 43.40%  runtime.futex /opt/go/src/runtime/sys_linux_amd64.s
      30ms  5.66% 49.06%       30ms  5.66%  crypto/sha256.block /opt/go/src/crypto/sha256/sha256block_amd64.s
      30ms  5.66% 54.72%       30ms  5.66%  runtime.memmove /opt/go/src/runtime/memmove_amd64.s
      30ms  5.66% 60.38%       30ms  5.66%  runtime.usleep /opt/go/src/runtime/sys_linux_amd64.s
      20ms  3.77% 64.15%      110ms 20.75%  runtime.findrunnable /opt/go/src/runtime/proc.go
The tree command displays the entire call graph in textual form, a section of which looks something like this:
(pprof) tree
Showing nodes accounting for 530ms, 100% of 530ms total
Showing top 80 nodes out of 200
----------------------------------------------------------+-------------
      flat  flat%   sum%        cum   cum%   calls calls% + context
----------------------------------------------------------+-------------
                                              70ms 30.43% |   runtime.stopm /opt/go/src/runtime/proc.go
                                              50ms 21.74% |   runtime.notetsleep_internal /opt/go/src/runtime/lock_futex.go
                                              40ms 17.39% |   runtime.ready /opt/go/src/runtime/proc.go
     230ms 43.40% 43.40%      230ms 43.40%                | runtime.futex /opt/go/src/runtime/sys_linux_amd64.s
----------------------------------------------------------+-------------
                                              30ms   100% |   crypto/sha256.(*digest).Write /opt/go/src/crypto/sha256/sha256.go
      30ms  5.66% 49.06%       30ms  5.66%                | crypto/sha256.block /opt/go/src/crypto/sha256/sha256block_amd64.s
----------------------------------------------------------+-------------
You can also view the graph pictorially, either on a web page or by generating a file:
(pprof) png
Generating report in profile001.png
The following example here shows the call graph generated as a PNG image:
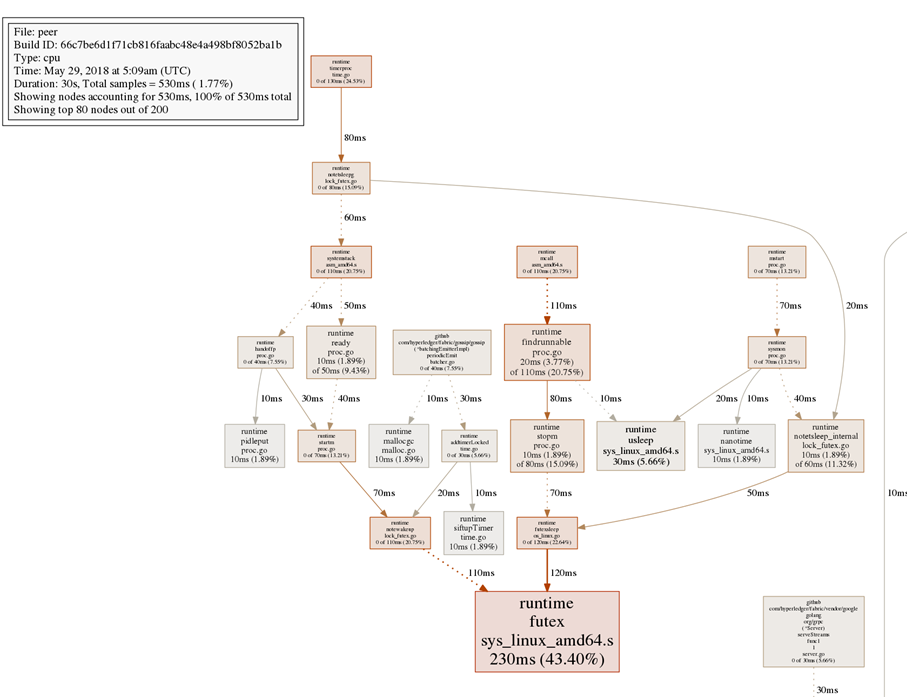
This is a section of the call graph image, which each box representing a function and the box's size indicating the frequency of that function (that is, the number of profile samples in which that function was running). Directed graph edges indicate calls made from one function to another, with the edges indicating the time spent in making such calls.
For more pprof options and analytical tools, the reader is encouraged to read the documentation.