
Chapter 4: Data Construction for Analysis
Introduction
Selecting the best data for analysis requires a thorough understanding of your business objective and your market. The data serves as the foundation for all of your analysis. In this case, the old adage is true: “Garbage in, garbage out!”
Finding the right data for analysis typically begins with your own data. Depending on your goal, you may have all the data you need in your own databases. However, in certain situations, you may need to purchase data from outside data sources to enhance your analysis. Either of these scenarios requires a culture of big data–a culture that supports collaboration and data sharing between silos and across systems. This culture of big data requires a strategic approach to data acquisition, storage, management, and access.
In this chapter, we will look at some typical sources for descriptive and predictive analysis. These examples give you a basic framework from which to develop your own analysis data sets.
Data for Descriptive Analysis
As we saw in Chapter 3, descriptive analysis helps you understand the underlying characteristics and patterns in your data. Your data can come from any source. Descriptive analysis can analyze a point in time or can include trending of data across defined time intervals. Some kinds of descriptive analysis are as follows:
• Customer profiling. To get a good understanding of your customers, you can perform this analysis on your customer database. It involves looking at the different levels of categorical variables and the distributions of continuous variables.
• Marketing activity. Campaign analysis or any variation of marketing activity can come from the marketing database. It can be matched to the customer database to look at marketing performance by different customer segments.
• Performance analysis. Similar to marketing activity, performance analysis looks at your company’s measures of success at a point in time. Having several “snapshots” at different points in time allows for trending. And this data can be matched to the customer database for analysis by customer segment.
Data for Predictive Analysis
Data for predictive analysis generally comes from some historical or static source. Most commonly, a group of names is extracted or purchased with a group of predictive variables from a specified time period. The names are processed for action during a processing timeframe. Next, an offer or request is made to a group of customers or prospects. Each customer or prospect can respond or act on the stimulus during a fixed time period, often called the performance window.
At the end of the performance window, the responders or those who act on the stimulus are matched back to the original file from the earlier time period. The matched data forms the modeling data set. The model is then developed and scored for future use. This description is the basic framework for a modeling data set. Many examples will illustrate this process throughout the rest of this chapter.
As seen in Figure 4.1, a general timeline exists for the development of model data. The timeline for these steps can vary depending on the type of campaign or the channel used. For a direct-mail model, the historic data might be compiled for six months or more. The processing might take a month and the performance window might last three months. The model development might take anywhere from two to six weeks.
Figure 4.1: General Timeline for Development of Model Data
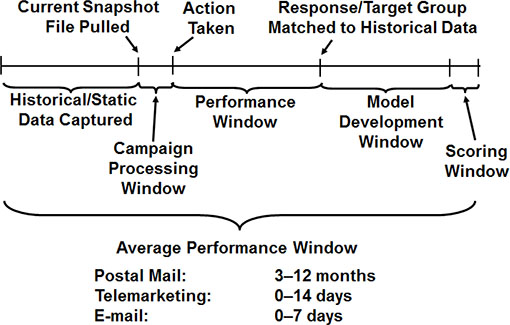
A telemarketing scenario might also use six months of data, or it might use results from the previous day. What is used varies greatly, depending on the situation. Processing can be anywhere from a few hours to a week. The performance window might be limited to the time spent on the phone. Development of the model might take as little time as a few hours to as much as a few weeks.
Internet models are becoming so sophisticated that companies are embedding automated modeling tools to capture historical data (which could represent the most recent 10 minutes of someone’s online activity), develop models in real time, and generate offers or take action automatically via either email or postal mail.
Prospect Models
The first kind of data discussed here is data for modeling prospects. This data is used for prospecting or acquiring new customers.
Data from a prior campaign is the best option for target modeling. This advice is true, whether or not the prior campaign matches the exact product or service you are modeling. Campaigns that have been generated by your company will be sensitive to factors like creative copy, terms of the offer or promotion, and brand identity. These factors may have a subtle effect on model performance.
It’s important to note that data from a prior campaign for the same product and to the same group is the best option for data in any targeting model. It allows for the most accurate prediction of future behavior. The only factors that can't be captured in this scenario are seasonality, changes in the marketplace, and the effects of multiple offers.
If data from a prior campaign is not available, the next best option is to build a propensity model. To do so, you use a data source to develop a model that targets a product or service similar to your primary targeting goal.
Increasingly, companies are forming affinity relationships with other companies to pool resources and increase profits. For example, credit card banks are forming partnerships with airlines, universities, clubs, retailers, and energy companies. Telecommunications companies are forming alliances with airlines, insurance companies, and others. One of the primary benefits of such arrangements is shared access to personal information that can be used to develop targeting models.
The following scenarios highlight some common ways that modeling data sets are created.
Case 1: Same Product to the Same List, Using a Prior Campaign
In January, ABC Credit Card Bank purchased 100,000 randomly selected names from Experian Credit Bureau for an acquisition campaign with the goal of developing a model. Together with the names, ABC purchased more than 300 demographic and credit attributes. ABC then mailed a credit card offer with an annualized annual percentage rate (APR) of 11.9% and no annual fee. ABC received approximately 1,000 responses from the campaign over the next 12 weeks. The responses were matched back to the original mail file to create a modeling data set.
In May, ABC Credit Card Bank built a response model, using the 300 variables that were purchased at the time of the original offer. After the model was constructed and validated, ABC used the model algorithm to score (assign a probability estimating their likelihood to respond) the May customer file at Experian Credit Bureau. In early June, it sent the same offer to the 30% of customers with the highest predicted response rate based on the model. To validate that the model performed as expected, it also mailed a random sample of the lower-scoring names.
Case 2: Same Product to a New List, Using a Prior Campaign
Next, ABC Credit Card Bank wants to develop a response model for its standard 11.9% APR “No Annual Fee” offer, a model that will be optimal for scoring names at the Equifax Credit Bureau. All of the other terms and conditions are the same as the prior campaign that used Experian data. Rather than start with a random sample, ABC’s most cost-effective option for getting data for model development is to use the model that was developed for the Experian Credit Bureau. ABC plans to use the Experian model to score the Equifax data. It will mail to the highest-scoring 40% of names selected by the model. To ensure a data set for developing a robust response model that is more accurate for the Equifax Credit Bureau, ABC will take a random sample of the names not selected by the model.
The response rate for the names in the top 40% is 2.1%. This rate is lower than the response rate from the Experian data. However, ABC was able to determine that the model still worked well; because the rest of the file was sampled, the performance for the entire file could be recreated by weighting the sample, which allows each member of the sample to be counted multiple times. The overall response rate was less than 1%, and as the score increased, each 10% increment of the population had a higher response rate. The recreated population file was used to develop a new model using only Equifax data.
Case 3: Same Product to the Same List, Using Prior Campaign with Selection Criteria
Summit Sports is a company that sells sports equipment online and via catalog. Six months ago, Summit Sports purchased a list of prospects from Power List Company. The list contained names, email addresses, and 35 demographic and psychographic attributes. Summit Sports used criteria that selected only males aged 30 to 55 years. To that segment, it emailed a catalog that featured baseball products. After three months of performance activity, response and sales amounts were appended to the original email file to create a modeling data set.
Using the 35 demographic and psychographic attributes, Summit Sports plans to develop a predictive model to target responses with sales amounts that exceeded $20. After the model is constructed and validated, Summit Sports will have a robust tool for scoring a new set of names for targeting purchases exceeding $20 from the baseball products catalog. For best results, the names will be purchased from Power List Company and use the same selection criteria as were used for the first model.
Case 4: Similar Product to Same List, Using Prior Campaign
A few months ago, RST Cruise Line decided to purchase a list of travel magazine subscribers from TravelPro Publishing Company. It randomly selected 10,000 names and sent them the Caribbean cruise offer. At the end of the performance window, when most of the expected responses were received, RST developed a model to use for targeting future Caribbean cruise offers.
Meanwhile, the product manager for the Alaskan cruise line wanted to try the same list of travel magazine subscribers. Rather than begin with a random sample, RST decided to use the Caribbean model to score the file for the Alaskan cruise offer. Even though the Alaskan cruise is less popular than the Caribbean one, it reasoned that at least, this way, it would target people who like to take cruises. By mailing the best 30% of the list and randomly sampling the rest of the list, RST validated that using the Caribbean model was more cost effective than just mailing a random offer.
Customer Models
As markets mature in many industries, attracting new customers becomes increasingly difficult. For example, credit card banks are compelled to offer low rates to lure customers away from competitors. The cost of acquiring a new customer has become so expensive that many companies are expanding their product lines to maximize the value of existing customer relationships. Credit card banks are offering insurance or investment products, or they are merging with full-service banks and other financial institutions to offer a full suite of financial services. Telecommunications companies are expanding their product and service lines or merging with cable and Internet companies. Many companies in a variety of industries are viewing their customers as their key asset.
These expanding markets create many opportunities for target modeling. A customer who is already doing business with you is typically more likely to prefer you over a competitor when purchasing additional products and services. This likelihood creates many opportunities for cross-sell and up-sell target modeling. Retention and renewal models are also critical for targeting customers who may be looking to terminate their relationship. Simple steps to retain a customer can be quite cost-effective.
Data from prior campaigns is also the best data for developing models for customer targeting. Although most customer models are developed with internal data, overlay data from an external source is sometimes appended to customer data to enhance the predictive power of the targeting models.
TIP: Many list companies will allow you to test their overlay data at no charge. If a list company is interested in building a relationship, it usually is willing to provide its full list of attributes for testing. The best method is to take a past campaign and overlay the entire list of attributes. Next, develop a model to learn which attributes are predictive for your product or service. If you find a few very powerful predictors, you can negotiate a price to purchase these attributes for future campaigns.
Case 1: Cross-Sell
Sure Wire Communications has built a solid base of long distance customers over the past 10 years. It is now expanding into cable television and wants to cross-sell this service to its existing customer base. Through a phone survey to 200 customers, Sure Wire learned that approximately 25% are interested in signing up for cable service. To develop a model for targeting cable customers, it wants a campaign with a minimum of 5,000 responders. It is planning to mail an offer to a random sample of 25,000 customers. This plan will ensure that, with as low as a 20% response rate, it will have enough responders to develop a model.
Case 2: Up-Sell Using Life-Stage Segments
XYZ Life Insurance Company wants to develop a model to target customers who are most likely to increase their life insurance coverage. From past experience and common sense, it knows that customers who are just starting a family are good candidates for increased coverage. But it also knows that other life events can trigger the need for more life insurance.
To enhance its customer file, XYZ plans to test overlay data from Lifetime List Company. Lifetime specializes in life-stage segmentation. XYZ feels that this additional segmentation will increase the power of its model. To improve the results of the campaign, XYZ Life is planning to make the offer to all of its customers in Life Stage 3. These customers are the ones who have a high probability of being in the process of beginning a family. XYZ Life will pull a random sample from the remainder of the names to complete the mailing. Once the results are final, it will have a full data set with life-stage enhancements for model development.
Case 3: Loyalty, Attrition, and Churn
Float Credit Card Bank wants to predict which customers are going to pay off their balances in the next three months. Once they are identified, Float will perform a risk assessment to determine whether it can lower its APR, in an effort to keep its balances. Through analysis, Float has determined that there is some seasonality in balance behavior. For example, balances usually increase in September and October because of school shopping. They also rise in November and December because of holiday shopping. Balances almost always drop in January as customers pay off their December balances. Another decrease is typical in April, when customers receive their tax refunds.
To capture the effects of seasonality, Float decided to look at two years of data. It restricted the analysis to customers who were out of their introductory period by at least four months. The analysts at Float structured the data so that it could use the month as a predictor, together with all the behavioral and demographic characteristics on the account. The modeling data set was made up of all the lost customers and a random sample of the current customers.
Risk Models
Managing risk is a critical component to maintaining profitability in many industries. Most of us are familiar with the common risk inherent in the banking and insurance industries. The primary risk in banking is the borrower’s failure to repay a loan. In insurance, the primary risk is the customer’s filing a claim. Another major risk assumed by banks and insurance companies is that of fraud. Stolen credit cards cost banks millions of dollars a year. Losses from fraudulent insurance claims are equally staggering.
Strong relationships have been identified between financial risk and some types of insurance risk. As a result, insurance companies use financial risk models to support their claim risk modeling. One interesting demonstration of the correlation between financial risk and insurance risk is the fact that credit payment behavior predicts the likelihood of auto insurance claims. Even though they seem unrelated, the two behaviors are clearly linked and are used effectively in risk assessment.
Risk models are challenging to develop for several reasons. The performance window has to cover a period of several years to be effective, which can make the models difficult to validate. Credit risk is sensitive to the health of the economy, and the risk of claims for insurance is vulnerable to population trends.
Credit data is easy to obtain from any of the three major credit bureaus: Experian, Equifax, and Trans Union. It’s just expensive to request and can be used only for an offer of credit. Some insurance risk data, such as data from life and health insurance claims, is relatively easy to obtain, but obtaining claims data for the automotive insurance industry can be more difficult to obtain.
Because of the availability of credit data from the credit bureaus, you can build risk models on prospects. This availability of credit risk data creates quite an advantage to banks that are interested in developing their own proprietary risk scores.
Case 1: Default Risk for Prospects
High Street Bank has been conservative in the past. Its product offerings were limited to checking accounts, savings accounts, and secured loans. As a means to attract new customers, it is interested in offering unsecured loans. But first, it wants to develop a predictive model to identify prospects that are likely to default.
To create the modeling and development data set, High Street Bank decides to purchase data from a credit bureau. It is interested in predicting the risk of bankruptcy for a prospect for a three-year period. The risk department requests 12,000 archived credit files from four years ago, 6,000 that show a bankruptcy in the last three years, and 6,000 with no bankruptcy. This combined file of names will give it a view of the customer’s credit and other financial characteristics at that point in time.
Case 2: Loss-Given-Default Risk for Prospects
Trustus Mortgage wants to estimate its exposure to loss before approving a new mortgage. Each customer already has a score that estimates the probably of default. The next step is to estimate the amount of the loss, given that the default occurs. The combined score provides a good estimate of the full level of risk.
The modeling data set is constructed by combining two samples. The first is a sample of current customers that have had their loan for at least five years. The second is a sample of customers whose loans were initiated at least five years ago and have completed the default process. The predictive information is built from the information on their original application. The loss information includes information related to the property, the location (to accommodate state and local laws), and the nature of the loan. For example, some states have different processes for foreclosure, some loans have mortgage insurance, and the local real estate market has an important role in the final amount of the loss.
Case 3: Fraud Risk for Customers
Anchor Credit Card Bank wants to develop a model to predict fraud. It captures purchase activity for each customer in the transaction database, including the amount, date, and spending category. To develop a fraud model, it collects several weeks of purchase data for each customer and calculates the average daily spending within each category. From this information, it can establish rules that trigger an inquiry if a customer’s spending pattern changes.
Case 4: Insurance Risk for Customers
CCC Insurance Company wants to develop a model to predict comprehensive automobile claims for a one to four-year period. Until now, it has been using simple segmentation based on demographic variables from the customer database. It wants to improve its prediction by building a model with overlay data from Sure Target List Company. Sure Target sells demographic, psychographic, and proprietary segments called Sure Hits that it developed by using cluster analysis.
To build the file for overlay, CCC randomly selects 5,000 names from the customers with at least a five-year tenure who filed at least one claim in the previous four years. It randomly selects another 5000 customers with at least a five-year tenure who have never filed a claim. CCC sends the files to Sure Target List Company, with a request that the customers be matched to an archive file from five years ago. The demographic, psychographic, and proprietary segments represent the five-year-old customer profiles. The data can be used to develop a predictive model that will target customers who are likely to file a claim in the next four years.
TIP: For best results in model development, strive to have the population from which the data is extracted resemble the population to be scored.
External Sources of Data
Scores built on your own data from within your own company will almost always be the most powerful ones available. But, as shown in some of the examples above, data purchased from an outside source is often useful for testing and modeling. Some main sources of data for both consumers and businesses are the major credit bureaus Experian, Equifax, and Trans Union. Other companies that sell scores are Fair Isaacs (FICO), Dun and Bradstreet (business data), InfoUSA, and U.S. Data Corp. A little Internet research will uncover a multitude of data sources.
Notes from the Field
As you can see, there are numerous sources and types of data available for modeling and analysis. With experience, you may find additional sources. Just be sure it is accurate and makes sense to your business. You learned in Chapter 2 that your analysis is only as good as your data, and this truism certainly applies to descriptive and predictive analyses. You can create a fancy analysis on bad data, but the analysis will be worthless. Similarly, you can build what appears to be a strong model on bad data, and the model will be worthless.
Once you understand the data and how it was sourced, the next step is to perform exploratory data analysis (EDA). You may be tempted to skip this step, but EDA is an important step in understanding the health of your data. It involves looking at frequencies of categorical variables and at distributions of continuous variables, also known as descriptive analysis (described in Chapter 3).
If you recall the Ferrari metaphor, SAS technology makes it possible for you to build a model without knowing whether the data is good or bad. So, take care to use common sense and business acumen to validate your results.