Chapter 1: Defining the Business Objective
Market Penetration or Wallet Share
Predictive Modeling Opportunities by Industry
Introduction
In today’s highly competitive global economy, organizations are increasingly dependent on their ability to leverage accurate, accessible, actionable data. This increased dependence on data requires a new kind of visionary leadership focused on a smart investment in an enterprise data management system, the right analytic talent to leverage it, and a culture designed to support “big data.”
A culture of big data includes powerful analytic tools. Advanced analytics and reporting software platforms, such as SAS Enterprise Guide and SAS Enterprise Miner, enable the user to extract deep insights from big data and its underlying patterns. This book is designed to guide the business analyst or manager as he or she seeks these insights by providing case studies and everyday examples.
In this chapter, you will learn the importance of clearly defining the objective of any data analysis project.
Setting Goals
The use of data analysis is now commonplace in business across industries. Many applications, such as customer profiles or response or risk models, are quite straightforward. However, as companies attempt to develop models that address more complicated measures such as customer retention and lifetime value, the importance of clear goals is magnified. Failure to define the goal correctly can result in wasted dollars and a lost opportunity.
The first and most important step in any data analysis project is to establish a clear goal, not a goal defined only by the data or the method, but a goal that makes sense to the business as a whole. In other words, the goal of the analysis must be defined in terms of how it will help the business reach its strategic goals. When you engage the stakeholders, questions and analytic methods will likely include the following:
• Do you need to understand the characteristics of your current customers? This goal may involve looking for averages or segmenting your customer base and creating profiles.
• Do you need to attract new customers? Response modeling on customer acquisition campaigns enables you to lower the marketing costs of attracting additional customers.
• Do you need to avoid high-risk customers? Risk or approval models identify customers or prospects that have a high likelihood of incurring a loss for the company. In financial services, for example, a typical loss comes from nonpayment on a loan. Insurance losses result when claims filed by the insured outweigh the calculated loss reserves.
• Do you need to make your unprofitable customers more profitable? Cross-sell and up-sell target models can be used to increase profits from current customers.
• Do you need to retain your profitable customers? Retention, or “churn,” models identify customers with a high likelihood of lowering or ceasing their current levels of activity. The identification of these customers before they change their behavior enables the construction of strategies and actions to retain them. The cost of retaining a customer is often less than the cost of winning back a customer.
• Do you need new customers to be profitable? A lifetime value model identifies prospects with a high likelihood of being long-term profitable customers. Combining several measures, such as response, activation, and attrition, can help you target prospects that have the highest value over the life of the product or service.
• Do you need to win back your lost customers? Win-back models are built to target former customers.
• Do you need to improve customer satisfaction? In today’s competitive market, customer satisfaction is crucial to success. Combining market research with customer profiling is an effective method of measuring customer satisfaction.
• Do you need to increase sales? You can increase sales in several ways. A new-customer-acquisition model can grow the customer base, leading to increased sales. Cross-sell and up-sell models can also be used to increase sales.
• Do you need to determine what products or services to bundle or offer sequentially? Affinity analysis can identify products that have a high probability of being purchased together or within a narrow time frame.
• Do you need to reduce expenses? Better targeting through the use of models for customer acquisition and customer relationship management can improve the efficiency of your marketing efforts by reducing expenses.
• Do you need to determine the most effective channel or sequence of channels? Analysis of purchase behavior can identify and measure which channel or sequence of channels is most efficient.
• Do you need to optimize the frequency of your offers? Analysis based on frequency testing can indicate how often to send an offer. This frequency strategy may vary greatly by channel in terms of both cost and results.
• Do you need to deliver the right message to the right person at the right time through the right channel? This objective is every marketer’s overall goal and encompasses all of the more specific goals.
So far, the list of goals concerns selling a product or service. Other business uses of data analysis that can result in cost reductions and higher profits may involve answering the following related questions:
• Do you need to avoid process failure? Companies in a variety of industries are modeling data collected from production lines, customer feedback, hospital error, and similar sources to predict breakdowns and take corrective actions.
• Do you need to analyze health treatments? Predictive models in the life sciences have saved money and lives. Models that predict disease outbreaks are used to calculate inventory in high-risk geographic regions.
• Do you need to optimize your inventory? Knowing how many of what products to have on hand in a specific location can save time and money.
• Do you need to optimize your staffing? Demand can be predicted, which enables stores, resorts, and other businesses to know exactly whom to have on-site or available for work.
• Do you need to predict the best location for a future store, restaurant, or other business? Planning growth can be facilitated by the prediction of sales for a specific geographic area.
For numerous other examples of goals, see Predictive Analytics (Siegel and Davenport 2013).
To achieve your goals, you will choose appropriately from a variety of analyses. The two major categories of analysis are Descriptive Analysis and Predictive Analysis.
Descriptive Analyses
Descriptive analysis is a technique that allows you to view and measure your company and customer characteristics. The results of the analysis can be used to guide decisions in every area of your company. Therefore, descriptive analysis is an essential first step to managing your business.
Customer Profile
Because your best customers typically drive your company’s profitability, analyzing your customer base is a good first step. This provides a snapshot of exactly who is buying your products or services.
A customer profile analysis identifies and measures the characteristics of your most profitable customers. Insights gained from this analysis can be used to enhance and customize your marketing activities. Customer profile analysis involves measuring common characteristics within a population of interest. Demographics, such as average age, gender (percent male), marital status (percent married, percent single, and so on), and average length of residence, are typically included in a profile analysis. Other measures might be more business-specific, such as the age of a customer relationship or the average risk level.
Also, if you find distinct characteristics that define a particularly profitable segment, you can match those characteristics to names on other databases or external lists and purchase new names for marketing. Similarly, if you identify the most and least profitable customers, you can focus your retention efforts and offer varying levels of customer service.
Customer Loyalty
Loyalty is an aspect of the customer profile that is measured by the length of the relationship, the amount of spending, or a combination thereof. Unlike customer profile analysis, which is more of a snapshot of your base, customer loyalty analysis looks at your customer base over time. History tells us that, on average, loyal customers bring in more revenue at a lower cost.
Market Penetration or Wallet Share
Market penetration analysis and wallet share analysis are techniques for measuring the performance of your customer base in comparison with the performance of the overall market for your industry. These analyses typically look at these measures across selected demographics or other characteristics, or a combination thereof.
Your company’s market penetration compares the number of customers in your base to the possible customers in the overall market. Wallet share compares your revenues to those available in the market. It is powerful for determining how much potential lies with a specific segment as defined by a demographic or behavioral characteristic.
Wallet share analysis can be used to prioritize marketing dollars in industries where the customer has a fixed amount to spend with multiple businesses (their “wallet”). You calculate it by taking the amount that the customer is spending with your company and dividing it by the total that they have to spend with you and your competitors.
Predictive Analyses
Predictive analysis uses statistics, machine learning, or data mining to develop models that predict future events on the basis of current or past data. In business, there are numerous models that are commonly used.
Marketing Models
Marketing models are models that are built and used specifically for growing your business.
Response
A response model is typically the first type of target model that a company seeks to develop. If no targeting was done in the past, a response model can provide a significant boost to the efficiency of a marketing campaign by increasing responses or reducing expenses. The objective is to predict who will respond to an offer for a product or service. It can be based on past behavior of a similar population or some logical substitute. For more detail on data for modeling, see Chapter 2.
Win-Back
A win-back model is used to invite former customers to reconsider their relationship to the business. These models can be powerful, because you already have good behavioral data on these former customers. You should consider risk and retention measures when appropriate.
Activation
An activation model predicts whether a prospect will become a customer. It is applicable only in certain industries, most commonly credit card and insurance. For example, for a credit card prospect to become an active customer, the prospect must respond, have their credit approved, and use the account. If the customer never uses the account, he or she actually costs the bank more than a noncustomer. Most credit card banks offer incentives, such as low-rate purchases or balance transfers, to motivate new customers to activate. An insurance prospect can be viewed in much the same way. A prospect can respond and be approved, but if he or she does not pay the initial premium, the policy is never activated.
Revenue
A revenue model predicts the dollar amount of an expected sale. This model is useful for distinguishing low-value from high-value responders or customers. For example, if a prospect becomes a customer after buying a product online, he or she has a specific value based on the amount of that purchase.
Usage
A usage model predicts the amount of use given to a product or service. This model is most applicable to the telecommunications companies that determine their profits by estimating minutes of usage. Life sciences companies predict disease outbreaks in specific geographic locations, on the basis of doctor visits, sales of prescriptions, and over-the-counter drugs.
Cross-Sell and Up-Sell
A cross-sell model is used to predict the probability or value of a current customer’s buying a different product or service from the same company. An up-sell model predicts the probability or value of a customer’s buying more of the same product or service.
Selling additional products or services to current customers is quickly replacing new customer acquisition as one of the easiest ways to increase profits. Testing offer sequences can help to determine what the next offer should be and when to make it. This testing enables companies to carefully manage offers to avoid over-soliciting and possibly alienating their customers.
Loyalty, Attrition, and Churn
A familiar mantra in marketing is, “It costs less to retain a customer than it does to replace one.” Every company benefits from loyal customers. Loyalty, also known as retention, can be thought of as the opposite of attrition—the loss of a customer relationship. For highly competitive industries where markets are close to saturation, these terms are particularly relevant. Industries that count on renewals, such as insurance, telecommunications, and publishing, pay close attention to retention and attrition.
Attrition is defined as a decrease in the use of a product or service. For credit card banks, attrition is the decrease in balances on which interest is earned. It occurs when customers switch companies, usually to take advantage of a better deal. For years, credit card banks lured customers from their competitors by offering low interest rates. Telecommunications companies continue to use strategic marketing tactics to lure customers away from their competitors. Many other industries spend much effort to retain customers and steal new ones from their competitors.
For several decades, credit cards have been offered to almost every segment of the population, resulting in a saturated market. This reality means that credit card banks are now forced to increase their customer base primarily by luring customers from other providers. Their tactic is to offer low introductory interest rates for anywhere from three months to one year or more on either new purchases or balances transferred from another provider, or both. Their hope is that customers will keep their balances with the bank after the interest converts to the normal rate. Many customers, though, are savvy about keeping their interest rates low by moving balances from one card to another before the rate returns to normal. These activities introduce several modeling opportunities. One kind of model predicts the customer’s reduction or ending of the use of a product or service after an account is activated.
In some industries, attrition becomes cyclical and is known as churn, which is defined as customers’ closing of one account in conjunction with the opening of another account for the same product or service, usually at a reduced cost. Companies have learned that it is cheaper to keep a customer happy than to replace him or her. To this end, retention and attrition modeling have become popular in some industries.
Businesses use social network analysis to predict churn by examining the group behavior. By measuring the density of connection in a mobile phone network, for example, cellular companies are able to predict patterns of churn and take proactive steps to retain their customers.
Risk and Approval Models
Risk models, or approval models, are unique to industries that assume the potential for loss when offering a product or service. The most familiar kinds of risk occur in the banking and insurance industries. However, there is a new focus on models to predict risk in the form of fraud and security breaches. As a result of the growth of data and interconnectivity, the level of risk related to data and technology is increasing exponentially.
Default
Default models have been used to determine risk for several decades. On the basis of an individual’s or business’s credit history, financial profile, demographics, or similar data, a lending institution or other business can determine its applicant’s likelihood of meeting his or her loan obligation. Predicting the likelihood of default or bankruptcy has been a main profit-driver of the loan industry for many years. Whether it’s for a mortgage, credit card, car loan, or even utility service, many companies rely on a credit score to determine approval and terms of a contract. Banks also use aggregations of the expected loss to meet regulatory requirements for loan reserves.
Loss-Given-Default
At the point of default, loss-given-default models are used to estimate the size of the loss. Some loans, such as mortgages and automobile loans, are secured, meaning that the bank holds the title to the home or automobile for collateral. The risk is then limited to the loan amount minus resale value of the home or car. Unsecured loans are loans for which the lender holds no secured assets, such as credit cards.
Many other industries incur risk by offering a product or service with the promise of future payment. This category includes telecommunications companies, energy providers, retailers, and many others. The type of risk is similar to that of the banking industry in that it estimates the probability of a customer’s defaulting on the payment for goods or services.
Claim
For the insurance industry, the risk is that of a customer’s filing a claim. The basic concept of insurance is to pool risk. Insurance companies have decades of experience in managing risk. Insurance companies use predictive model scores to determine approval, optimize pricing, and determine reserve levels for life, health, auto, and homeowners insurance on the basis of demographics, risk factors including claim history, and credit risk factors. Because of heavy government regulation of pricing in the insurance industry, managing risk is critical to insurance companies’ profitability. Warranty companies often use product information and safety records to model the likelihood of a claim.
Fraud
With the increase in electronic and online transactions, fraud is increasing at an alarming rate. According to fraud research by the 2012 Global Fraud Study, survey participants estimated that the organizations lose an average of 5% of their revenues to fraud each year (Association of Certified Fraud Examiners 2012). Applied to the 2011 gross world product, this figure translates to a potential projected annual fraud loss of more than $3.5 trillion. Because of fraudulent purchases made with stolen credit cards, fake insurance claims (including life, health, and auto), stolen cellular usage, false tax returns, account fraud through Automated Clearing House, and money laundering, fraud increases costs for businesses and consumers alike.
Powerful models are in use and in development to thwart these costly actions.
Credit card banks use predictive models to identify the types of purchases that are typically made with a stolen card. For example, if the card is used to purchase expensive jewelry, furs, or firearms, the bank will freeze the card until the cardholder can verify the charges.
Insurance claim fraud is also costly to insurers and policyholders. Historically, every claim was personally inspected for fraud. Today, predictive models can estimate the likelihood that a claim is fraudulent based on common characteristics of past fraudulent claims. This model allows insurers to reduce expenses by automating the approval of low-risk claims and placing a priority on claims with a high likelihood of fraud.
Government institutions, including the Internal Revenue Service and social service agencies such as Medicare and the Social Security Administration, use predictive models to identify false tax returns or requests for benefits.
Lifetime Value
Lifetime value (LTV) is the expected value of a prospect or customer over a specified period of time, measured in today’s dollars. When calculated with the use of a series of models or other estimates, it allows a company to make decisions that optimize overall profits.
LTV is measured in various ways, depending on the industry, but basically it represents the value of future revenues minus overhead and expenses. It can be estimated from a series of estimates from models or other sources that may consider one or more of the following: response, activation, retention, risk, cross-sell, up-sell, and revenue. This evaluation enables companies to allocate resources based on customer value or potential customer value.
Historically, marketing strategies were driven by the financial benefits of a single campaign. Customer profitability was optimized by the net profits of the initial sale. With the increased cost of acquiring customers and the expansion of products and services to existing customers, companies are expanding their marketing strategies to consider the LTV of a potential customer.
LTV measurements on a customer portfolio can quantify the long-term financial health of a company or business. However, focusing on long-term goals can be challenging for companies if they suboptimize short-term profits.
The customer life cycle comprises three main phases (Figure 1.1):
• prospect
• new or established customer
• former or lapsed customer
Many opportunities for developing predictive models exist within the life cycle.
Figure 1.1: Customer Life Cycle
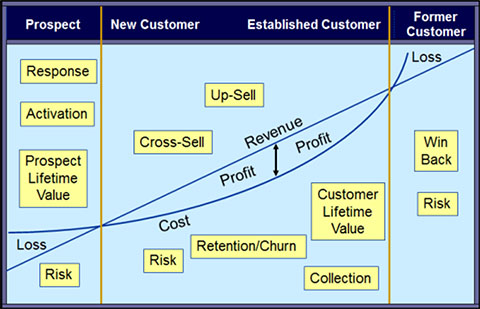
A prospect can be modeled for the propensity to respond or to activate. The risk level can also be estimated with predictive modeling or segmentation. By combining response, activation, or risk models with some customer value estimates such as retention (churn) or subsequent revenues, companies can calculate a prospect’s LTV.
After a prospect becomes a customer, numerous additional modeling opportunities exist. Finally, after the customer relationship ends, models can be developed to improve profitability. By integrating models into a customer relationship management program, companies can reduce expenses while improving the efficiency of their marketing efforts.
Predictive Modeling Opportunities by Industry
In the past few decades, predictive models have gained popularity across a variety of industries. Statisticians and data miners have found that the methods pioneered by the financial services industry have broad applicability to most other industries.
For all of the industries listed in this section, a combination of factors drives profitability. The financial impact of these factors can be predicted with the following types of models:
Banks: Credit Card, Retail, Mortgage, and Savings and Loan
• response model—to target offers for loans
• default model—to predict non-payment or bankruptcy
• revenue model—to estimate the amount of purchases and earned interest
• retention/loyalty/attrition model—to estimate the optimal combination of pricing and services
• cross-sell/up-sell model—to increase usage on credit cards or purchase additional products and services such as investment products, retail banking services (savings and checking accounts), refinance of mortgage, etc.
• fraud model—to detect lost or stolen cards or identity theft
• collection model—to prioritize resources in the collection of debt
Insurance Companies: Life, Health, Auto, Property, and Casualty
• response model—to target offers for insurance
• default model—to predict likelihood of claims
• retention/loyalty model—to estimate the optimal combination of pricing and services
• cross-sell/up-sell model—to increase insurance coverage (life) or purchase other types of insurance
• fraud model—to predict the likelihood of a false insurance application or claim
Retailers: Catalog Companies and Retail
• response model—to target offers for goods and services
• catalog companies and offline retailers—to reduce snail mail costs
• online retailers—to improve targeting
• revenue model—to estimate the amount of the purchases
• retention/loyalty model—to estimate the optimal combination of marketing actions and incentives
• cross-sell/up-sell model—to increase repeat sales
Telecommunications Companies: Cable, Internet, Wired-phone, and Cellular
• response model—to target offers for phone or internet service
• revenue model—to estimate the amount of usage
• retention/loyalty model—to estimate the likelihood of cancellation or churn
• default model—to predict the likelihood of defaulting on payment
• cross-sell/up-sell model—to increase usage and optimize product and service bundling
• fraud model—to predict illegal access to services
• process failure model—to predict grid or supply-chain failure
Entertainment and Social Media Industry: Radio, Television, Social Media, and Online Sharing Sites
• response model—to increase click-through, views, and purchases based on variations in ad content, timing, and placement
• revenue model—to estimate the amount of the purchases
• retention/loyalty model—to estimate the optimal combination of marketing actions and incentives
• failure model—to predict internet or media delivery interruptions
Gaming Industry: Casinos and Online Gaming
• response model—to optimize ad placement and incentives
• retention/loyalty model—to estimate the optimal combination of marketing actions and incentives; for example, many casinos have strong loyalty programs that include food, lodging, and priority access
• cross-sell/up-sell model—to increase usage and optimize product and service bundling
• fraud model—to predict the likelihood of a false representation, such as a stolen credit card or identify theft
Education: Colleges, Universities, Technical Colleges, and Art Schools
• response model—to target an offer based on the likelihood of acceptance
• retention model—estimate the likelihood of graduation
Technology Companies: Computer Hardware and Software
• response model—to target offers for product or service
• revenue model—to estimate the amount of usage for services
• retention/loyalty model—to estimate the likelihood of repeat purchases
• cross-sell/up-sell model—to increase usage and optimize product and service bundling
• process failure model—to predict product, operations, or supply-chain failure
Utilities: Gas, Electric, and Water
• response model—to target offers for services in deregulated areas
• usage model—to estimate the amount of usage.
• retention/loyalty model—to estimate the likelihood of cancellation or churn
• default model—to predict the likelihood of defaulting on payment
• cross-sell/up-sell model—to increase usage and optimize product and service bundling
• fraud model—to predict illegal access to services
• failure model—to predict grid or supply-chain failure
Hospitality and Travel Industry: Hotels, Resorts, and Restaurants
• response model—to target offers for phone or internet service
• usage model—to estimate the number of potential customers in order to plan staffing and supplies
• revenue model—to estimate the amount of revenue
• retention/loyalty model—to estimate the likelihood of repeat customers
• cross-sell/up-sell model—to increase usage and optimize product and service bundling
• process failure model—to predict operations or supply-chain failure
Manufacturing: Auto, Pharmaceutical, Biotech, Chemical, Food, etc.
• response model—to predict sales
• usage model—to predict product expiration, disease outbreak, poisoning, allergic reaction
• revenue model—to predict production needs
• process failure model—to predict a breakdown in operations or a supply-chain
• product failure model—to predict the likelihood of a product malfunction or safety recall
Public Sector and Nonprofit: Government, Political, Religious, Community, Education, Healthcare
• response model—to predict who will donate or help with campaign
• revenue model—to estimate the amount of donations
• target model—to predict for whom someone will vote
• fraud models—to detect false charges for services, identity theft, or IRS tax filings
• usage models—to plan staffing and supplies for hospitals, emergency centers, first responders, or nursing homes
Transportation and Shipping: Rail, Ship, Truck, and Airline
• usage model—to predict quantities, sales, and fuel costs
• geo usage model—to optimize routes and storage locations
• process failure model—to predict operations or supply-chain failure
Sports
• recruitment model—to predict whether a player’s statistics are a good fit for the team
• target model—to predict who will attend an event
Notes from the Field
The fact that you are reading this book suggests that you are among those of us who are seduced by the power and beauty of big data and its emergent insights. However, big data has a dark side. One can easily become lost in the minutia and forget about the main purpose of the project—that carefully crafted business goal.
In any data analysis or modeling project, you will benefit from stepping back and looking at your work from a leader’s perspective. Typically, the CEO doesn’t have the skills or the time to explore a project’s details to the extent that you do. So, sometimes you must play CEO for your part of the business.
Engaging powerful tools like SAS Enterprise Guide and SAS Enterprise Miner is like sitting behind the wheel of a Ferrari. These tools can take you far and fast, but will you end up where you need to go?
To reach your destination in sound condition, you must know what the goal is, and you must have a map to direct your progress. You must also know where you are now and what your assets are: your data, tools, reference materials, and support resources.
If you are a manager, discipline and focus will be your best tools during this exciting process. When you are performing data analysis, allow your business acumen to guide you. The insights that emerge can serve to validate and enhance your knowledge, as well as inform your strategy.
If you are an analyst, you have a real opportunity here. The skills that brought you to this position are highly valued in the marketplace. But to become a true asset to your organization, you must learn the business—from strategy to operations. Your understanding of the business will help you make decisions based not only on the data, but also on what your findings mean to the business. If you’re developing analysis and models to guide your strategy, then you will want to think through all the ramifications of your strategic decisions as they relate to the goals of the business.