Chapter 2: Data Types, Categories, and Sources
Demographic or Firmographic Data
Introduction
Data is being created at an increasingly exponential rate. It’s no wonder that, in today’s high-tech, interconnected global economy, data is a foundational asset for all Fortune 500 organizations, as well as an increasing number of smaller companies.
In this chapter, you will learn about the different types and sources of data available for modeling and analysis. This data is the basis of your analysis. In the end, your final deliverable, anything from a simple report to an advanced model algorithm, is only as good as your data.
The chapter begins with a brief historical perspective on the evolution of big data collection and usage in business. This foundational knowledge not only gives you what you need to begin building a base for modeling and analysis, but will also teach patterns of data creation and usage that will enable you to be on the lookout for new types and sources of data.
The Evolution of Data
Financial institutions were the early pioneers in the use of big data to manage risk and optimize marketing. Today, the use of data to drive decision-making has moved into all departments of most Fortune 500 businesses. Balanced Scorecard and Six Sigma are powerful tools for measuring and managing business processes. The next area of analysis with great potential for improving business is the measurement of human capital and performance.
To leverage this data explosion, companies are diligently collecting, cleaning, combining, storing, and analyzing their data. Many companies are making major investments in enterprise data management systems to ensure accuracy and accessibility. To understand the real significance of this increased focus on data, you will find that looking at some recent history is worthwhile.
Since the early 1990s, advances in computer power, server capacity, and connectivity have fueled the growth of data collection and usage. This growth has enabled companies to market directly to consumers and businesses. Companies have emerged with the sole purpose of collecting data on individuals and businesses from a variety of public and private sources, such as U.S. Census statistics, phone directories, warranty cards, and public records. A long history of credit behavior also has been available for credit-related use.
As companies began to realize the financial benefits of utilizing these sources, new businesses formed for the sole purpose of collecting, cleansing, aggregating, enhancing, and selling data on individuals and businesses. Today, the dramatic increase in World Wide Web traffic, social media, and mobile devices has generated enormous amounts of data. And each new technology, process, or activity is a potential source of new data. Experts are calling this phenomenon big data.
Large data sets have been around for many years. But the growth in the amount of data is now increasing exponentially. Many factors contribute to the increase in the amount of data being generated: transaction-based data stored through the years, unstructured data streaming in from social media, and increasing amounts of sensor and machine-to-machine data being collected. In the past, excessive data volume was a storage issue. But with decreasing storage costs, other issues emerge, including how to determine relevance within large data volumes and how to use analytics to create value from relevant data.
But big data is also characterized by how quickly it changes and its numerous sources. Data today comes in many different formats: structured, numeric data in traditional databases; information created from line-of-business applications; and unstructured text documents, email, video, audio, stock ticker data, and financial transactions. Managing, merging and governing varieties of data is still a struggle for many organizations.
According to SAS Institute in “Big Data: What It Is and Why It Matters,” data earns its “bigness” in two additional ways (SAS Institute Inc., 2014):
• Variability. In addition to the increasing velocities and varieties of data, data flows can be highly inconsistent, with periodic peaks. Is something trending in social media? Daily, seasonal, and event-triggered peak data loads can be challenging to manage, and even more so when unstructured data is involved.
• Complexity. Today’s data comes from multiple sources, and it is still an undertaking to link, match, cleanse, and transform data across systems. However, it is necessary to connect and correlate relationships, hierarchies, and multiple data linkages, or your data can quickly spiral out of control.
New kinds of data from digitization and social media are adding to the “bigness” of data. Unstructured data appears to be the next frontier of data sources. Powerful software is now able to decipher and analyze handwritten text, audio, images, and videos. The translation of unstructured data and its integration with structured data are projected to be the primary sources of data for analysis in the future.
The first step in making the best use of any data source is to understand the nature of the data, how it is gathered, and how it is managed.
Types of Data
Data comes in three basic types: nominal, ordinal, and continuous.
Nominal Data
Nominal data is qualitative or descriptive data that has discrete values.
Variable or data columns that contain nominal data are often referred to as class variables, categorical variables, or discrete variables. Nominal data can be used for segmentation or classification.
When a class variable is used as an input to a particular kind of predictive model, such as a regression or neural network model, it must be converted into a numeric form. For example, you could say that the values for gender are 1 and 0, where 1 = male and 0 = female. When the values are set to 0 and 1, they are also referred to as indicator variables. This transformation can be accomplished automatically in modeling software such as SAS Enterprise Miner.
Ordinal Data
Ordinal data is data with categories that have relative importance. The categories can be used to rank strength or severity. For example, you may be familiar with the rankings “Low, Medium, and High.” These have a relative ranking but can’t be compared mathematically.
Numeric values can also be used to denote relative ranking without a mathematic relationship, For example, a list company assigns the values 1 through 5 to denote financial risk. The value 1, characterized by no late payments, is considered low risk. The value 5, characterized by a bankruptcy, is considered high risk. The values 2 through 4 are characterized by various previous delinquencies. A prospect with a risk ranking of 5 is definitely riskier than a prospect with a ranking of 1, but he or she is not five times as risky. And the difference in their ranks, 5 - 1 = 4, has no meaning.
Continuous Data
Continuous data, or ratio data, is the most common data used to develop predictive models. It can accommodate all basic arithmetic operations: addition, subtraction, multiplication, and division. Most business data, such as sales, balances, and minutes, is ratio or continuous data.
Categories of Data
Three main characteristics of data should be considered when you are deciding the types of data you want to use: the power, stability, and cost. First, however, you will want to look at the data categories.
Although data is available from numerous sources and is of varying types, regardless of its origin, data fits into one of three basic categories: demographic, behavioral, or psychographic or attitudinal. Each category has its strengths and weaknesses.
Demographic or Firmographic Data
Demographic data generally describes personal or household characteristics. It typically includes the following characteristics:
• gender
• age
• marital status
• income
• home ownership
• dwelling type
• education level
• ethnicity
• presence of children
Demographic data has many strengths. It is stable, which makes it appealing for use in predictive modeling. Characteristics like marital status, home ownership, education level, and dwelling type aren’t subject to change as frequently as behavioral data, such as bank balances, or attitudinal characteristics, like favorite political candidate. And demographic data is usually less expensive than attitudinal and behavioral data, especially when purchased on a group level.
One of the weaknesses of demographic data is that it is difficult to collect on an individual basis with a high degree of accuracy. Unless it is required by law or is required in return for a product or service, many people resist sharing this type of information, or they supply false information.
Firmographic data can be thought of as demographic data for businesses. It includes characteristics, such as industry, annual revenue, number of employees, number of sites, and growth rate. It has many of the same features as demographic data. However, it is often more accurate on an individual level, especially for publicly traded companies.
Behavioral Data
Behavioral data is a measurement of people’s action or lack of action. Typically, behavioral data is the most predictive kind. Depending on the industry, behavioral data may include elements such as the following:
• response to an offer
• purchase date
• amount of purchase
• type of purchase
• ending of subscription
• payment date
• payment amount
• customer service action
• insurance claim
• default
• bankruptcy
Website and social media activity are also forms of behavioral data. Websites can track the path of a visitor. Social media sites are able to collect an enormous amount of information based on your preferences and connections.
Social network data is a type of behavioral data that includes size and density of a social group, its stability, and within-group similarity. Members of a social network are evaluated on characteristics such as connectedness, social role, and traffic role.
You can collect online behavioral data by analyzing the sequence and timing of visitors to a website or series of websites. The results can be used to assist with search engine optimization and increase website “stickiness” or the time a visitor lingers on a page or site.
Behavioral data is better for predicting future behavior than the other categories of data. It is, however, generally the most difficult and expensive data to get from an outside source. Consequently, most companies focus on internally tracking and storing their customer data.
TRENDS: Web-savvy businesses are developing predictive models by using online patterns of behavior to estimate preferences, industry changes, untapped markets, and future trends. Using estimates from these models, business can measure sentiment and activities that can inform timing and messaging of marketing or other actions.
Psychographic Data
Psychographic data is also known as attitudinal data or lifestyle data. It is characterized by opinions, fashion, style, political choices, personal values, or some combination. Traditionally associated with market research, this category of data is collected mainly through surveys, opinion polls, and focus groups. It can also be inferred through subscription, purchase, and social media behavior. Because of increased competition, this category of data is being integrated into customer and prospect databases for improved target modeling and analysis.
Psychographic data brings an added dimension to predictive modeling. For companies that have squeezed all the predictive power possible out of their demographic and behavioral data, psychographic data can offer some improvement. It is also useful for determining the life stage of a customer or prospect. This data creates many opportunities for developing products and services around life events such as marriage, childbirth, college expenses, and retirement.
The biggest drawback to psychographic data is that it denotes intended behavior that may be highly, partly, or marginally correlated with actual behavior. Data may be collected through surveys or focus groups and then applied to a larger group of names, such as a customer base, using segmentation or predictive modeling. If data is applied with the use of these methods, it is recommended that a test be constructed to validate the correlation.
Data Category Comparison
Table 2.1 provides a quick reference and comparison of the three main categories of data. The rating is based on individual-level data. If data is collected on a group and inferred on an individual level, it is generally less predictive and less expensive. The stability remains the same.
Table 2.1: Data Category Characteristics
| Data Category | Power | Stability | Cost |
| Demographic | Medium | High | Low |
| Behavioral | High | Low | High |
| Psychographic | Medium | Medium | Low or High |
The cost for psychographic data shows Low or High because social media data is becoming a low-cost source of this data. As tools become available to access and mine the rich information in social media data, the cost drops accordingly.
Sources of Data
Data for modeling can be generated from numerous sources. These sources fall into one of two categories: internal or external.
Internal sources are those that are generated through company activity and are stored within the company, typically in a data warehouse. They include, but are not limited to, customer records, transactional data, World Wide Web behavior, and marketing data (both offer and customer behavior). External sources of data include companies such as credit bureaus, list brokers and compilers, and corporations with large customer databases, such as retailers, publishers, and social media sites.
Internal Sources
Internal sources are optimal for analysis because they represent information that is specific to the company’s product or service. The following subsections detail the typical features and components of these databases.
Customer Database—Business to Consumer
A business to consumer (B2C) customer database, designed to target consumers, typically is designed with one record per customer. In most organizations, it is one of several databases. It contains identifying information that is linked to other databases, such as a transaction database to obtain a current “snapshot” of a customer’s performance. Even though wide variation among companies and industries may exist, following are some key elements in a typical customer database:
• Customer ID is a unique numeric or alphanumeric code that identifies the customer throughout his or her entire customer life cycle. Some companies may use an account number for this function, but doing so can be risky if the account numbers are subject to change. For example, credit card banks assign a new account number when a card is lost or stolen. The customer ID allows each account number to be linked to the unique customer, thereby preserving the entire customer history. It is essential in any database to effectively link and track the behavior of and actions taken on an individual customer.
• Household ID is a unique numeric or alphanumeric code that identifies the household of the customer through his or her entire customer life cycle. This identifier is useful in some industries in which more than one member of a household shares products or services.
• Account number is a unique numeric or alphanumeric code that relates to a particular product or service. One customer can have several account numbers.
• Customer name is the name of a person or a business. It is usually broken down into multiple fields: last name, first name, middle name or initial, salutation.
• Physical address is typically broken into components such as number, street, suite or apartment number, city, state, postal code, and country. Some customer databases have a line for a P.O. Box. With population mobility about 10% per year, additional fields that contain former addresses are useful for tracking and matching customers to other files.
• Phone number includes area code, country code, and, if applicable, extension.
• Email address can also serve as unique identifier.
• Demographic information such as gender, age, and income may be stored for profiling and modeling.
• Products or services are typically tracked with the use of a list of products and product identification numbers that may vary by company. An insurance company may list all its insurance policies, together with policy numbers. A bank may list all the products across different divisions of the bank, including checking, savings, credit cards, investments, loans, and more. If the number of products and the product detail are extensive, this information may be stored in a separate database with a customer and household identifier.
• Model scores such as response, risk, retention, profitability scores, or any other scores may be purchased or developed in-house. These scores may reside in a separate database that is linked by the account number.
Customer Database—Business to Business
A customer database designed to target businesses (B2B) resembles a customer database designed to target consumers (B2C). The main difference is that the customer is a business instead of an individual.
The overall structure is also similar. The main database typically has one record for each company unit. Each record or site may also be a headquarters (HQ) or a map to another site that is the HQ. Each record contains the identifying information that can be linked to other databases, such as a transaction database, a marketing database, or other databases that track past performance and other information of value to the company.
In addition to a company-level database, many large B2B companies have a contact database in which the individuals are associated with companies in the customer database. It may also contain additional contacts that work for companies that are not yet customers.
NOTE: Some companies sell to both consumers and businesses. Their databases are either separate or are a hybrid of both business and consumer data.
Even though there may be wide variation among companies and industries, the following are key elements in a typical customer database:
• Company ID is a unique numeric or alphanumeric code that identifies the company throughout its life cycle.
• Headquarter ID is a unique numeric or alphanumeric code that identifies the headquarter (HQ) of the company throughout its entire life cycle.
• DUNS number (site) is a unique ID that is available through Dun and Bradstreet (D&B). This ID allows for mapping to firmographic data provided by D&B.
• DUNS number (other) is one of a series of numbers that can match each site to its HQ, domestic ultimate (DU), or global ultimate (GU). It may be the same as the site ID if the site is also the HQ, DU, or GU.
• Company name is the name of the business. For a sole proprietor, it may be a person’s name.
• Physical address is typically broken into components such as number, street, suite or apartment number, city, state, postal code, and country. Business addresses are more stable than addresses for individuals, especially companies with many employees.
• Phone number is the main number for the organization and typically includes area code and country code. If the data is at a contact level, the phone number may include area code, country code, and, if applicable, extension.
• Company URL or web address can also serve as a unique identifier.
• Firmographic data resembles demographic data but is at the company level. It includes industry, number of employees, age of company, annual sales, growth rate, standard industrial classification codes, and the like.
• Product or service IDs typically consist of a list of identification numbers that vary by company. Product or service IDs may reside in a separate database that is linked by the company ID.
• Model scores such as response, risk, retention, profitability scores, or any other scores may be purchased or developed in-house. These scores may reside in a separate database that is linked by the company ID.
Contact Database
The contact database contains data about the employees of companies found in the company database, as follows:
• Contact ID is a unique numeric or alphanumeric code that identifies the contact throughout his or her entire life cycle.
• Contact name is the name of a customer or prospect. It is usually broken down into multiple fields: last name, first name, middle name or initial, and salutation.
• Company ID is a unique numeric or alphanumeric code that identifies the company throughout its life cycle.
• Company name is the name of the business. For a sole proprietor, it may be a person’s name.
• Physical address is the street address, typically broken into components such as number, street, suite or apartment number, city, state, postal code, and country. Companies with virtual workers can have contacts anywhere in the world.
• Phone number includes area code, country code, and, if applicable, extension.
• Email address can also serve as unique identifier. Job title or job level describes the role, department, and level of each contact.
• Model scores such as response, risk, retention, profitability scores, and any other scores may be purchased or developed in-house. These scores may reside in a separate database that is linked by the contact ID.
Transaction Database
For certain industries, the transaction database contains records of customer activity. It is often the richest and most predictive information, but it can be the most difficult to use. In most cases, each record represents a single transaction, so multiple records may exist for each customer.
The transaction database can take on various forms, depending on the type of business. For you to use this data for modeling, it must be summarized and aggregated to a customer level. Number of records per customer can differ. The following typify what might be found in a transaction database:
• Customer ID or contact ID is a unique numeric or alphanumeric code that identifies the customer throughout his or her entire life cycle. Some companies may use an account number for this function.
• Account number is a unique numeric or alphanumeric code that relates to a particular product or service.
• Activity type provides detail about the type of activity, such as purchase, payment, fee, or return.
• Activity amount is the amount of the transaction or activity.
• Activity date is the date that the transaction occurred.
These fields must be summarized to the customer or company level for most analyses.
Score Database
Many companies develop models for all areas of their business. The scores from these models can be stored in a score database. Some large companies may have multiple databases that contain different types of scores. For example, a bank might have one score database for risk scores, such as the probability of default or the potential loss upon default. That same bank might have a second score database for marketing scores, such as the probability to take a loan, carry high balances, or take an additional product or service.
The following typify what might be found in one or more score databases:
• Customer ID or contact ID is a unique numeric or alphanumeric code that identifies the customer throughout his or her entire life cycle. Some companies may use an account number for this function.
• Probability to buy is a score that represents the likelihood of a customer to purchase a particular product or service. This score can be for a new purchase or an additional purchase from the same company. It may cover a range of products and services.
• Expected value is the amount, in dollars or numbers, that the customer or company is expected to purchase or borrow, if response occurs.
• Probability to default is the likelihood that a customer will not pay the amount owed.
• Expected loss given default is the amount that a customer or company is expected to have as a balance when default on the loan occurs.
Marketing Database
The marketing database contains details about offers made to both prospects and customers. The most useful format is a unique record for each campaign to each customer or prospect.
A marketing database would contain all cross-sell, up-sell, and retention offers. A prospect marketing database would contain all acquisition offers, as well as any predictive information from outside sources.
Variables created from this type of database are often the most predictive for targeting models. It seems logical that if you know that someone has received your offer every month for six months, then he or she is less likely to respond than someone who is seeing your offer for the first time. As competition intensifies, this kind of information is becoming increasingly important.
With an average amount of solicitation, this kind of database can become huge. Consequently, you should perform analyses to establish business rules that control the maintenance of this database. Fields like date of first offer are usually correlated with response behavior. Following are key elements in a marketing database:
• Prospect ID or customer ID is a unique numeric or alphanumeric code that identifies the prospect for a specific length of time.
• Offer detail includes the date, type of offer, marketing copy, source code, pricing, distribution channel (mail, telemarketing, sales representative, email), and any other details of the offer.
• Date can be date of first offer (for each offer type) or other offer dates (unique to product or service).
Storage of Data
Data Warehouse
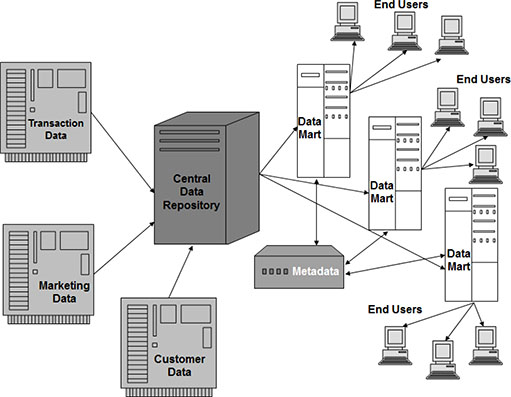
A data warehouse is a structure that links information from two or more databases. As shown in Figure 2.1, the data warehouse brings the data into a central repository, performs some data integration, cleanup, and summarization, and distributes the information into data marts. Data marts are used to house subsets of the data from the central repository. The data in data marts is selected and prepared for specific end users.
Figure 2.1: Data Warehouse
Hadoop
Apache™ Hadoop is revolutionizing the leveraging of big data. Hadoop is a data platform that operates by dispersing data storage and processing over a large group of servers. Hadoop can quickly scale data processing from a single machine to several thousand machines.
Traditional models of data storage are expensive, especially for large data sets. Hadoop is built at a much lower cost and uses commodity hardware. By operating at the petabyte scale, Hadoop can reduce costs tremendously. This savings will continue to increase as the cost of hardware continues to decrease.
Companies use web data to understand customer behavior and improve marketing. But the immense volume of web data can be prohibitive to capture and store. Hadoop allows companies to capture and store web data at a much lower costs. It also allows companies to hold onto historical data for a longer period of time.
Hadoop also offers the ability to analyze large volumes of data. Because of the distributed servers, Hadoop can process large volumes of data in parallel.
The ability to perform advanced analytics is a key feature of Hadoop. Hadoop also has the capacity to support several higher-level business intelligence tools.
External Sources
The pressure is on many companies to increase profits either by acquiring new customers, or by increasing sales to existing customers. You can enhance both of these initiatives with the use of external sources.
External sources consist mainly of list sellers and compilers. Few companies that sell lists, however, have these sales as their sole business. Many companies have a main business, like magazine sales or catalog sales, with list sales as a secondary business. Depending on the type of business, they usually collect and sell names, addresses, email messages, and phone numbers, together with demographic, behavioral, and psychographic information. Sometimes they perform list “hygiene,” or cleanup, to improve the value of the list. Many of them sell their lists through list compilers or list brokers.
List compilers are companies that sell a variety of single and compiled lists. Some companies begin with a base like the phone book or driver’s license registration data. Then they purchase lists, merge them, and impute missing values. Many list compliers use survey research to enhance and validate their lists.
Many companies sell lists of names with contact information and personal characteristics. Some specialize in specific kinds of data. The credit bureaus are well known for selling credit behavior data. They serve financial institutions by gathering and sharing credit behavior data among their members. Hundreds of companies sell these lists, ranging from very specific to nationwide coverage.
TIP: Commonly, prospect data is purchased repeatedly from the same source. The goal may be to purchase new names or to get fresh information about existing names. In either case, you should arrange with the data seller to assign a unique identifier to each prospect that is housed on the seller’s database. Then, when additional names are purchased or current names are refreshed, the match rate will be much higher than it otherwise would be.
NOTE: For privacy reasons, social media data is mainly collected and used with each social media site. Some social media activities can be purchased.
Notes from the Field
In this chapter, you’ve seen how data for analysis comes in many forms and from multiple sources. Your first step in preparing the data for analysis is to understand how and from where all the data sets were extracted. When data is purchased or extracted from unfamiliar sources, you should request data dictionaries that contain a definition for every field. Be sure you know what each field means and how it is derived (if applicable). In addition, request counts, ranges, and simple statistics for each field, such as mean, median, minimum, maximum, and standard deviation.
Make friends with the people in your information technology department. They can become valuable collaborators. They can help you get the names of the people in charge of creating the data, if possible. Don’t hesitate to ask questions until you are sure you understand the data.
Data can be seductive. If you are starting a new project, you may be eager to collect as much data from as many sources as possible. However, with the amount of data available for analysis, too much of a good thing can be paralyzing.
The best approach is to work in stages. Begin with the question from Chapter 1: What is your objective? If you have many objectives, choose the most important two or three. Then, work with your data management team to optimize the process. If operational or pricing considerations justify the collection a large amount of data, then focus on a few that will have the most impact. Remember that analysis is usually done in isolation, but the planning should be done in concert with the major stake-holders and end-users to ensure the optimal use of talent, time, and money.
Remember that, in the end, your analysis is only as good at your data. This fact is true for both the quality of the data and how well it aligns with the objective of your analysis.