Using the Designer
Exploring Solution Explorer
Coding with Code View
Using the Tools menu
Integrated Development Environments, or IDEs, are the Swiss army knife of the programmer's toolkit. IDEs provide a mechanism for storing program code, organizing and building it, and looking at finished products with design editors. IDEs make things happen, and in the bargain, cut hours from a task.
Visual Studio is becoming truly globally recognized as the cream of the crop of IDEs, even by Microsoft detractors. I know Python programmers who will rail on Windows all day while surfing their Linux box and then switch to a Windows partition to use Visual Studio to code with IRONPython in Visual Studio.
Visual Studio is impressive; it is massive. I wrote a book with David Deloveh at the turn of the century (heh!) that attempted to cover all Visual Studio features. It was 600 pages. The major complaint by readers: too short. Didn't cover enough. Visual Studio is twice as large now. It's far too big for a single chapter.
So, rather than try to cover everything, I give you the chance to experience only the features of Visual Studio that I use every day. I don't want to try and cover anything up, and I hope that you continue exploring the IDE and discovering new stuff — don't just stop with what I tell you about. This is only a brief overview of some of the astonishing features in the tool.
One thing that is integrated into an Integrated Development Environment is a way to edit files graphically, sometimes called a Graphic Development Environment or designer. Visual Studio allows you to graphically edit five different types of code bases and provides adjunct tools for the further management of said code bases.
In short, the designer is the drag-and-drop element of the Visual Studio world. It isn't always the best way to develop a program, but it sure can help sometimes.
For each major type of project that Visual Studio maintains, there is a designer. The designer handles the What You See Is What You Get portion of the experience and usually the behind-the-scenes markup code.
The problem is that because of the necessities of the software development world we live in, different designers all work a little differently. A significant difference exists between HTML and XAML, for example, so the Web designer and the WPF designer don't look or act the same.
Visual Studio gives you several visual designers to help develop applications, including these:
Class Designer
Data View
Web Forms
Windows Forms
Windows Presentation Foundation
Windows Presentation Foundation is covered in some depth in Book V, but for now you should know that it is the future of Microsoft's Windows development experience. Book V talks all about WPF, so you can read more about it there.
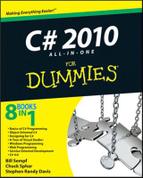
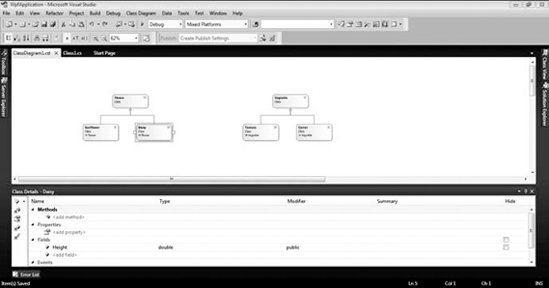
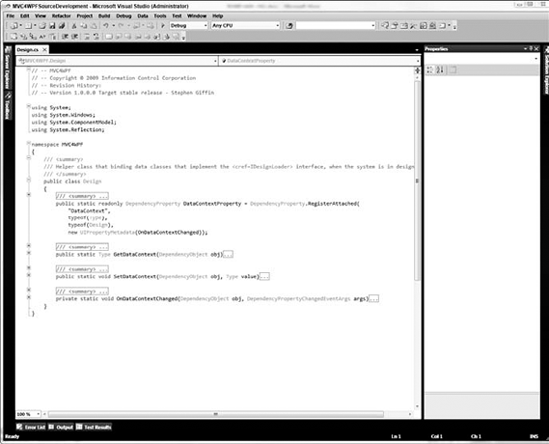
The core of the user interface design experience is a language called XAML, which (unsurprisingly) is an XML-derived domain-specific markup language for the creation of user interfaces. In the Designer, shown in Figure 2-1, the design is in the top frame, and the underlying code is in the bottom frame.
You can click in the design in the designer and move things around, if you want, or use the designer to select things and edit the properties in the Properties panel (which I cover in the upcoming section "Paneling the Studio"). Additionally, if you change something in the code area, you'll see the change in the design. It's a good system.
There are a few small but significant features in the WPF designer that should be pointed out. You can see them all in Figure 2-1.
Near the upper-left corner is a zoom bar. You can click at the bottom of it and Zoom To Fit, or move the slider. This is invaluable for working on an application that is bigger than your screen, or lightening things just so.
At the left side of the dividing line between the Design and XAML frames is a little double-arrow icon. Clicking this icon changes whatever is in the bottom frame to be in the top frame, and vice versa.
On the right side of the same dividing line are three buttons that determine the kind of split you have — a vertical split, a horizontal split (which is default), or no split.
A few cool point-and-click adjustment tools are in the designer itself. Here's just one: Click in the red area of the table in the window in the designer. Put your mouse right above where the "146" size designation appears.
See the little floating box that appears, with an asterisk, a hash, and the word Auto? That's just one of the many little helpers that you find in the WPF designer. The hash sets the column width to a set number (as it is by default). The asterisk sets it to a percentage of the table — useful for resizing. The word Auto sizes the column based on the contents.
These little features make changes only to the XAML in the frame below the designer. If you click the word Auto in the floating table designer, you will change this line of code:
<ColumnDefinition Width="146" />
to this line of code in the XAML frame:
<ColumnDefinition Width="Auto" />
Some people like the code. Some people like the designer. Some people (like me) prefer a strange mixture of the two. You determine how you want to use the tools.
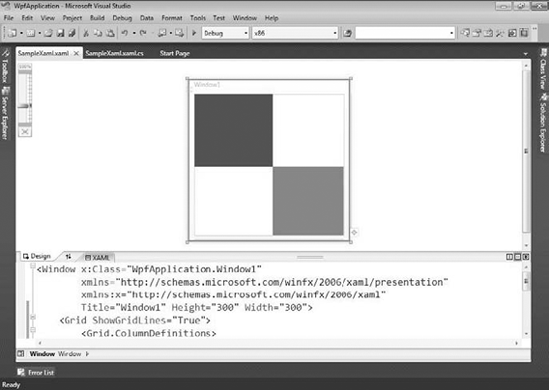
The main difference between the Windows Forms designer and the WPF designer is the lack of a code panel in Windows Forms. Although there is code (of sorts) backing up Windows Forms, you don't get to edit it. So there.
The topic of Windows Forms isn't covered in this book. Though it's still an active development platform, I had to make the tough call to cover WPF instead. It performs the same programming duties as Windows Forms but is the newer technology. The Windows Forms designer is shown in Figure 2-2.
In truth, there is little to say about the Windows Forms designer itself. The individual controls have some nice designer features, but the designer itself doesn't do much.
It should be said, though, that I don't do much with Windows Forms in this book. First, this isn't a Windows programming book; it is a C# book. Second, Windows Forms is on its way out. WPF is the future of Windows programming. Window Forms is just there for backward compatibility.
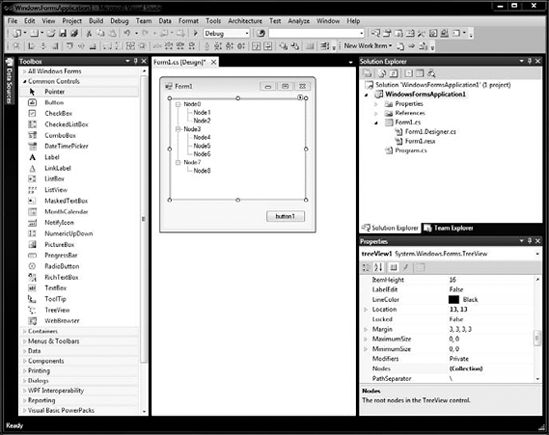
Web programming resembles WPF programming more than it resembles Windows Forms programming, but it's run from a Web server and viewed in a browser. ( Book VI is all about Web forms.) Because the designer has a back-end code element, you can see a split view, as shown in Figure 2-3.
Getting around in the HTML designer is easy. I want to point out two features in particular about the HTML designer. These features can be found in a menu strip along the bottom of the designer view:
The view change buttons, which read Source, Design, and Split: Source shows only the HTML code. Design shows only the visual designer. Split, unsurprisingly, shows both in two panels, just like the WPF designer.
Note
Interestingly, the two frames do not stay in sync. If you change the HTML, the design frame shows a message that says "Design view is out of sync with Source view. Click here to synchronize views." Here's hoping they fix that before they release to manufacturing.
The small document tree next to the view change buttons: This shows you where in the hierarchal tree your cursor is and its relationship to the rest of the HTML document.
You can make a Class Designer from any project, but I used a Class Library project for my next example, shown in Figure 2-4:
The class designer gives you a visual interface into a class library. You can easily see the inheritance, and the members are visible and editable. Here is the class library I used for Figure 2-4:
namespace MyGarden
{
    public class Flower
    {
        public string Color;
    }
    public class Vegetable
    {
        public bool Yummy;
    }
    public class Daisy : Flower
    {
        public double Height;
    }
    public class Sunflower : Flower
    {
        public bool Harvested;
    }
    public class Tomato: Vegetable
    {
public double StakeHeight;
}
public class Carrot : Vegetable
{
public double Depth;
}
}To create a class library like this, follow these steps:
Create a new Class Library project.
Replace the default code with a listing of your own.
You can use the one in this section, if you want.
Build the class library by pressing Ctrl + Shift + B.
Right-click on the project and select View Class Diagram.
Visual Studio creates a new file called
ClassDiagram1.cd. This is your Class Diagram file.Save your project.
You can add methods to your new class as well. Click on the Methods of the Flower class and add a Water method by typing Water under name Void under type, and Public under modifier. If you change back to the library view, you'll find that there has been a method added to the code under that class.
Tip
To aid in documentation of projects, you can right-click anywhere in the designer pane and select Export This Diagram as an Image, and then save it off as a .PNG file. I find this immensely useful when I am creating documentation for a project. It is a lot more useful than Visio because its integrated with your code, included in Visual Studio, and it's free!
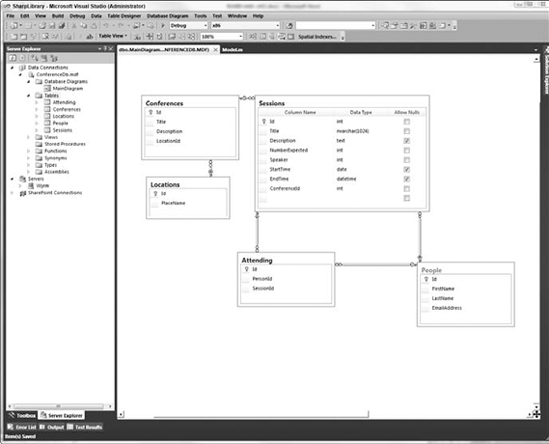
Data View is usually used with the Server Explorer and is part of an in-studio representation of SQL Management Studio. You can view and edit data tables in the SQL Server (and other) database management system right inside Visual Studio. An example is shown in Figure 2-5.
There is a remarkable amount of power here, and there just isn't enough space to cover it all. Again, this isn't a database book, so I recommend reading over the MSDN entries for the Data Connections feature of SQL Explorer for more details.
Paneling: That's just so very seventies.
To be as flexible as it needs to, Visual Studio has a large collection of modular windows that are called panels. These panels do everything that isn't involved with directly editing a design or code. They manage files, manage objects, show feedback, show properties, all sorts of stuff.
Visual Studio has something like 23 panels. I don't have room to discuss them all here, so I cover only 5 — the ones you use every day. The rest you can find on the View menu.
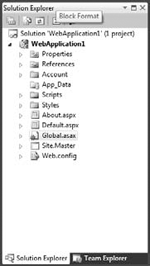
Solution Explorer (see Figure 2-6) manages solutions, projects, and files. Despite my claim earlier that solutions are just a matter of files and folders, it is a somewhat more complex operation than it seems at first blush.
For solutions themselves, Solution Explorer provides a number of important tools, including the following:
Configuration Manager provides a useful interface for what is basically a settings file in the solution itself. You can specify whether Release or Debug compilation is desired for your build here, if you want all debugging information stored with your file. You can tell the compiler whether you want the software built for 32-bit systems or 64-bit systems too.
Project Dependencies shows how your projects are interrelated and describes the way in which your projects depend on each other. It has a tab for the build order, too. When you are getting weird "referenced member not available in object" errors, check here first.
Property Pages determine which project should start on debug and where source files are kept, among other things.
Additionally, Solution Explorer is a repository for projects. Each appears in a tree view.
Projects are the individual compiled units and are divided by type. You can find more about projects in Chapter 1 of this minibook.
Solution Explorer brings to projects the capability to add and remove files, make references and services, set up a class diagram, open the representative Windows Explorer folder, and set properties.
All this information is saved in the Project file. The project file is just an XML file. There are a few key characteristics of the file:
It includes a PropertyGroup for each build type. This is because you can set different properties for each type of executable.
It contains an ItemGroup that has all the references in it, including required Framework versions, and another set of ItemGroups that have the project load details.
The file includes the import of the project general details and the Target collections. You can actually edit the file manually to make a custom build environment.
You likely won't modify your Project file, but I think it's important that you know it can be done, and that Microsoft has inline comments. They expect the file to get hacked.
Files are a lot less exciting. They are pretty much exactly what you expect. They host the source code of the program being developed. Nothing hidden here.
Solution Explorer manages the files in the project basically like Windows Explorer does. Solution Explorer lists the files and folders and allows them to be opened in the designer or the code editor.
Tip
Solution Explorer also knows what files to show. If the file isn't in the project, but happens to be sitting in the folder for the project, it won't show in the Explorer. If you can't find a file, try clicking the Show All Files button in the gray button bar at the top of the Explorer. The hidden files will show up grayed out, but still won't compile into the project.
The Properties panel (see Figure 2-7) is a simple, flexible tool that allows you to update those endless lists of details about everything in development projects. The panel is basically a window with a two-column-wide datagrid. It reads properties in key/value pairs and allows for easy view and edit.
When I say it shows endless lists of details about everything, I mean everything. If you click on nearly anything in Visual Studio, press F4 to bring up the Property Panel (refer to Figure 2-7), you will get properties. Try it with these fun selections:
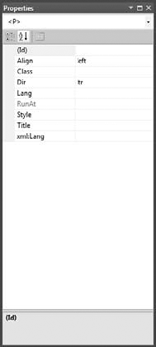
If there is any meta-data about something, the properties are in the Property Panel. It's a great tool.
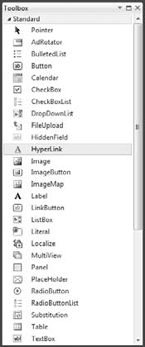
One of the great misunderstood tools is the Toolbox. (See Figure 2-8.) On the surface it seems so simple. The design-time controls for a given file type are available to drag and drop. Still, there is one important thing you need to remember about the Toolbox. Wait, I'll get out my Remember icon.
Note
The Toolbox displays only controls that are appropriate to the file in focus.
So, if you are running a Windows Form in the designer, you won't see a database table available to drop. Trust me; if you expect to see a certain control, and it isn't there, the Toolbox probably isn't messed up. If there isn't a file open, the Toolbox is empty. That's by design.
I can't tell you how many times I have been expecting to see something in the Toolbox only to find it blank. Then I spend ten minutes tracking down the problem, only to realize that the problem is mine — I didn't have a file open. I once actually called Microsoft because I couldn't find a maskedtextbox for my Web Forms project.
There is no maskedtextbox for Web Forms projects.
So keep it in mind that the Toolbox is context-sensitive. It works only when it wants to.
There is one other interesting property of the Toolbox: It can be used to store text clippings, which can be useful for demonstrations and presentations. It is also handy for storing often-used pieces of code, but snippets (covered in Chapter 3) are even better. To do so, follow these steps:
Open a code file.
Anything will do,
.csfile,.xamlfile, whatever.Highlight a piece of code.
Make sure the Toolbox is open. Then drag the selected code to the General section of the Textbox.
The copied code becomes a tool.
Open up another blank code file.
Drag the new tool into the code.
The copied code now appears in the code file.
Note
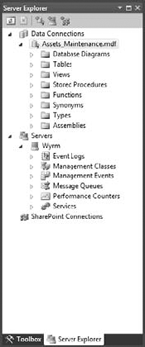
Server Explorer (see Figure 2-9) isn't in every version of Visual Studio. At the time this book was printed, it was included only in the Professional Edition and later.
Server Explorer enables developers to access important services on a remote machine. These could be anything from SharePoint to MSMQ but generally include two types of services:
Managed services
Database connections
Managed services are things like Event Viewer and Microsoft Message Queue: things that you would need to look at to test parts of your application. Internet Information Services, for example, is a managed service that would show up in the list.
To get a server into Server Explorer, follow these steps:
Right-click on Servers.
Click the Add Server button.
Type the machine name or IP number of the server you want to add.
If you want to use different credentials than you used to log in (for a different account, for instance), click Connect Using a Different User Name and enter the new credentials.
Click OK.
Play around with the services you see. There are a lot of features in this panel that I don't have space to get into here.
Above the Services in Figure 2-9 are the data connections. These are data connections that have been made on previous projects, which Visual Studio keeps around in case you need them for any other projects. Although keeping these connections around seems like a bit of a security risk, it sure as heck is convenient.
The goal is to reduce the dependency on SQL Management Console (the old method for managing the database for developers), and it does a darn good job. The key issue is access to the data model (table names and columns) and stored procedures; developing a program without access to the database is tough.
In a new connection, these database objects are given default folders:
Database diagrams
Tables
Views
Stored Procedures
Functions
Types
Synonyms
Assemblies
The key thing I want you to try is opening a Stored Procedure (you can do this by double-clicking it in the Data Sources panel). When you do so, you can easily edit SQL code, with indenting and colorization, right in Visual Studio. Use this. It's really neat.
The last of the five main panels is Class View. As I discuss throughout Books I and II, everything in the .NET Framework is an object. The classes that make up the framework — all derivatives of Object — are viewable in a tree view.
The Class Viewer is the home for that tree view. (See Figure 2-10.)
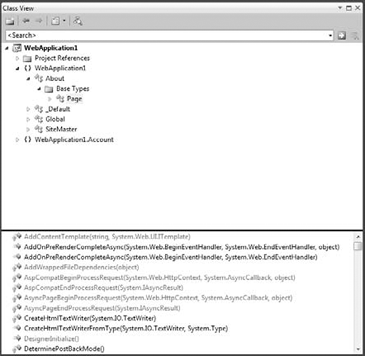
From the Class View, you can look at all the members of a class and access the inline documentation, which gives you an overview of the framework and custom classes that make up your project.
Really, what else would you do in Code View? Nothing, that's what!
There is a lot to the Code Viewer in Visual Studio. Fact is, this is where you will spend 75 percent of your time, and boy, will you be glad that it works well.
Code Viewer has two primary tools:
The Code Viewer itself: The first is the screen on which you edit the code — the Code Viewer.
Auxiliary windows: The second are the little auxiliary windows that do a lot of useful things that don't directly relate to the code.
The Code Viewer is where you edit code. Doesn't matter what type of code, all of it is edited here. (See Figure 2-11.)
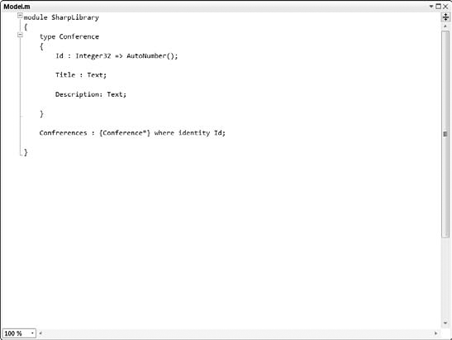
It is a smart tool, however. If you are in XML, it works like an XML editor. In C++, it helps with the tabbing.
You can get to a code file in the Code Viewer a few ways. The most common way is to double-click on a code-driven file in Solution Explorer, and it will open in Code Viewer.
If you are viewing something in the designer, you can get to the code-behind related to the file in question by any of three methods:
Click the View Code button in Solution Explorer.
Right-click on the design surface and select View Code.
Double-click on a control in the designer to generate an event for that control, and be moved to Code View.
You'll find yourself using all three over time. Note that you can get directly to the code-behind files by clicking the little triangle next to a designer file and then double-clicking the code files nested within.
IntelliSense is Microsoft's autocompletion feature, and it's a prominent part of the Code Viewer. You find IntelliSense no matter whether you want to. In Code View, click inside a class and press Ctrl+spacebar. Everything you are allowed to type there shows up in a big list.
The nice thing is, it is context-sensitive. Type Console and press the dot (.). All available members of Console appear. IntelliSense keeps you honest and prevents having to remember the two-million-odd members of the .NET Framework on a day-by-day basis.
IntelliSense helps with method signatures, too. Continue the line you started earlier by adding WriteLine — in other words, type (Console.WriteLine( — then check out the IntelliSense. It will tell you all the overloads for the member in question. Use the up and down arrows to move between them. It's slick.
Visual Studio will auto-outline your code for you. Notice the little box with a minus sign (−) next to every namespace, class, and method? (See Figure 2-12.) Those are close-up sections of the code for readability. Doesn't seem like much now, but when you have 2,200 lines of code in there, you will be glad.
You can create your own outlining, too. Preceding a section that you want to outline, put #region on a new line. After that section, put #endregion. This newly defined section — regardless of whether it's at an existing outline point — will get a new outline mark.
If there is a comment added after a region statement, it will show in the collapsed outline — as you can see in Figure 2-12.
A number of windows affect text input and output in order to solve certain problems. As a group, they don't really have a name, so I call them auxiliary windows. I cover four of them here.
The Output window: I use the Output window regularly for two things:
Build logging: Every time you build, the Output window tracks all of the linking and compiling that goes on under the sheets and shows any errors that might come up.
Tip
By default, the Output window shows when you build. You can set it to not show the Visual Studio Options dialog box, after choosing General

Errors listed in the Output windows can be used to navigate the code. The buttons in the Output box assist with getting around the code based on the messages in the window.
Debug statements: The second use of the Output window is Standard Out (for all you C++ people). If you use a
Debug.Writestatement in your code, the Output window is where it will go. Additionally, if you useConsole.Write, but are running a Windows Forms application, for instance, the text will go to the Output window.
The Immediate window: This window does exactly what one would expect it to do — it does something immediately. In debug mode, you can use the Immediate window to send commands to the program as it is running, to change the state, or evaluate operations. Try this to see what I mean:
Open a Windows Forms project.
Note
The one in the sample code for this chapter on this book's companion Web site is fine — you just need a default project template.
Put a breakpoint on
form.load. Do this by clicking in the grey bar running down the side of Code View.A red dot should appear.
The program should stop on the
loadmethod.Open the Immediate window.
You should be able to do this in the Debug window, or by pressing Ctrl+D, I.
Type
?this.See the IntelliSense menu?
After the dot, type WindowPosition.
The question mark in Step 5 means Print. This command prints the window position to the screen.
The response should be
windowDefaultLocation.
That's what the Immediate window is for. You can do more than print values, too. You can change variable values and modify the execution of your program. It is a powerful part of your debugging toolbox.
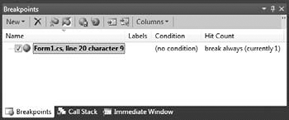
The Breakpoints window: Wait! Don't change anything in Visual Studio after trying the last example. Press Ctrl+D, B. The Breakpoints window appears, and the breakpoint you just added will be in it. (See Figure 2-13.)
What's cool here is that you can right-click on any breakpoint and completely alter the properties of that breakpoint. Try it — the important options are described in this list:
Location: Specifies the location of the line of code that should host the breakpoint. This is convenient if you have filters set and you find you need to shift a line back.
Condition: You can teach the breakpoint to stop at this line only if a certain variable is a specific value.
Hit Count: Stop here only after the xth time it is hit.
Filter: It's similar to Condition, except that you can use system values such as
MachineName, ProcessName, ProcessId, ThreadName, andThreadId. It's useful for multiprocessor development, among other things.WhenHit: You can do more than just stop on a breakpoint — instead, you can do something like print a value to the Output window, or even run a test script.
The Tasks window: While coding, have you ever wanted to tell the developer working after you that something still needs to be done? Maybe you make a comment, maybe call it
//TODO:.Well, if you do that, it appears in a task in the Tasks window. Isn't that just cool?
There are always a few things in any overview chapter that just don't fit in any category. In this one, there are a double handful of tools that I want to at least mention.
I am sure you are shocked to find that the Tools menu is a great place to find tools that don't fit anywhere else, including the following:
Attach to Process: For debugging, this tool enables you to connect to another running program on a machine and debug your code in that service.
Connect to Database: See the "Server Explorer" section, earlier in this chapter.
Connect to Server: Discussed in the "Server Explorer" section.
Code Snippets Manager: I chat about snippets in Chapter 3.
Choose Toolbox Items: This tool helps you manage the items in the Toolbox.
Add-in Manager: Manages Visual Studio Add-ins. Add, remove, enable, and disable.
Macros: You can group these commands or instructions as a single command to accomplish a task automatically. They're generally used to automate repetitive actions. Macros are covered in Chapter 4.
Create GUID: Funny that this is here. This tool literally creates a Globally Unique ID (GUID), one of those 25 character codes that are supposed to be unique over the next 2,500 years or something. Make a new one and sell it on eBay.
Dotfuscator Community Edition: This is a free code obfuscator for .NET.
WCF Service Configuration Manager: Graphic interface for the WCF
configfiles. Services are covered in Book VI.External Tools: This tool enables you to separate
.EXEfiles that add functionality to Visual Studio.Import and Export Settings: This tools helps you move projects between development tools.
Customize: This tool enables you to alter the look and feel of Visual Studio.
Options: With these, you can alter the way Visual Studio works. Options are covered in some depth in Chapter 3.
I'm sure by now you have gotten the basics of building and debugging. A few other options in the Build and Debug menus deserve at least a small explanation, including the following:
Rebuild: This checks all the references throughout the project before compiling the project. It's useful if your development computer has changed configuration since your last build.
Clean: This actually deletes not only the components created as part of your project, but also all DLLs that were copied into your project by references that were set to that mode.
Batch Build: This enables you to build release and debug versions (for instance), or 32 and 64 bit (as another example) at the same time.
Configuration Manager: Use this to set the order and mode in which you build your projects.
Refactoring is the practice of reorganizing code that might have become scattered during development or debugging. The Refactoring menu in Visual Studio provides a few tools that help with refactoring in C#, including these:
Rename: Rename is simple — anytime you rename a symbol (a named object such as a variable, a method, a property, or an enum, for example), you can change the name throughout the project. After you change the name of something, you should see a smart tag appear near the end of the symbol name that has Rename as an option.
Rename changes all other symbols with that same name in the project (not the solution). Rename with Preview shows you each change before it is performed.
Extract Method: Perhaps you've written a block of code and then thought "oh boy, I am going to need this over there." If so, Extract Method is for you. It will take a highlighted block of code, move it to a method, extract all the variables, make them parameters, and then you'll be ready for code reuse.
Encapsulate Field: In a similar vein as extracting a method, Encapsulate Field takes a private variable and makes it a public field. For instance, take a line of code like private string
_theValue; highlight it in code designer and select Encapsulate Field from the Refactor menu.Visual Studio asks you to name the new property and create a new property based on your selections:
public string TheValue
{
  get { return _theValue; }
  set { _theValue = value; }
}
Extract Interface: Extract Interface takes a set of method signatures and makes an interface for you. Interfaces are vital to contract driven development.
If you are working a project that suddenly has more than one programmer (as in, they got you help!), extracting interfaces to common classes in your project decreases barriers to the new folks' entry pattern.
Remove Parameters: This is the safe way to get excess parameters out of methods. In all honesty, I use this refactoring tool the least.
Reorder Parameters: Being able to change the order of parameters is significantly handier. Sometimes, you just need to switch the order of two parameters. If you do this, all the places where you call that method must have the parameter order changed, or they will send in the wrong stuff.
This simple tool enables you to change the parameter order and then finds all places that call the method in question, and switch the parameter order sent in.