CHAPTER 22
SDN Controllers
The CCNA exam topics covered in this chapter are:
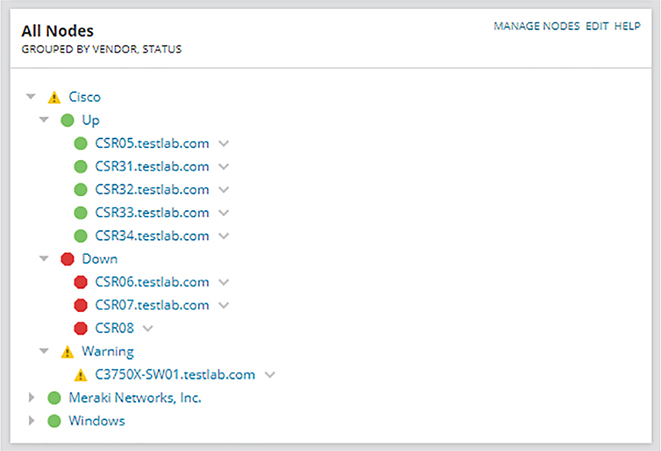
That said, automation has gotten popular enough to be included on the CCNA exam—it even has its own Devnet certification track! Even so, most companies still aren’t keen on fully managing their network with a bunch of python scripts on a shared drive. So a better solution is to go with something called a Software Defined Networking controller to centrally manage and monitor the network instead of doing everything manually. I’m going to introduce you to network monitoring solutions and configuration management before moving into Software Defined Networking (SDN) concepts and controller-based architecture. We’ll also cover some very cool advantages a DNA Center managed network offers us over a traditionally managed network. This is going to be a great chapter! People working on a network team find out about problems affecting the network two main ways: being bombarded by angry users or via a Network Monitoring System (NMS) that alerts them when the network isn’t looking so well. And even though users will probably still swarm when Facebook isn’t working, I’ll take the latter! I mean, at least we get warned that the mob is coming with an NMS… A Network Monitoring System’s job is to continuously poll your network devices using SNMP so it can pinpoint any misbehaving devices. Performance statistics like ICMP response times are also tracked to help us make network design decisions and troubleshoot. The NMS also keeps track of how much traffic is moving through the network, and depending on the exact solution being used, everything from applications to VoIP call quality can be tracked—nice! By default, NMS polls the network devices every couple of minutes. Plus, when an interface goes down on a Cisco router, the router can send an SNMP trap to the NMS, alerting the system to the issue. And while we’re talking about those alerts—most NMS solutions can send an email, an SMS text message if someone’s on call for network support, or just display the alert so the Network Operations Center can investigate the issue. In the upcoming examples, I’ll be showing you a popular NMS solution, Solarwind’s Network Performance Monitor, which is actually used by a fair amount of small to midsized companies. Know that Cisco does have a full solution called Prime Infrastructure, but we’ll be talking about DNA Center that’s its successor later in this chapter in detail instead. I think the contrast is really interesting! Configuring basic SNMP is the way we’ll start configuring a Cisco device here. Doing this will be just like we did earlier only with some extra commands to set up SNMP traps. We’re going to a read-only community for basic monitoring and a read-write community in case we want more in-depth information or if the NMS needs to make any changes on the device like this: So depending on the network environment, you might have to change the source interface that SNMP will use to send traps with the source-interface command: Each Cisco device has lots of traps you can enable that vary by platform and sometimes between IOS versions. You can see all available traps by typing a question mark after the snmp-server enable traps command. After that, just choose the traps you want enabled by selecting them one at time: If you’re just not that picky, an easier way is to enter the snmp-server enable traps command without any options because this enables all the traps supported on the system. If you want to disable a trap later, just use the no command on it: Okay so once the NMS has learned about the network devices in my lab—some Cisco routers, a 3750X switch, and some Meraki devices—the dashboard will display an overview of my network’s health. NMS’s usually show the status of your network with three colors:
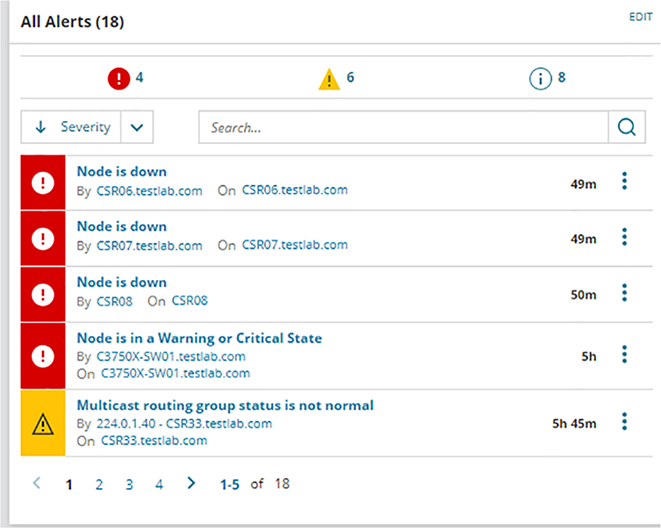
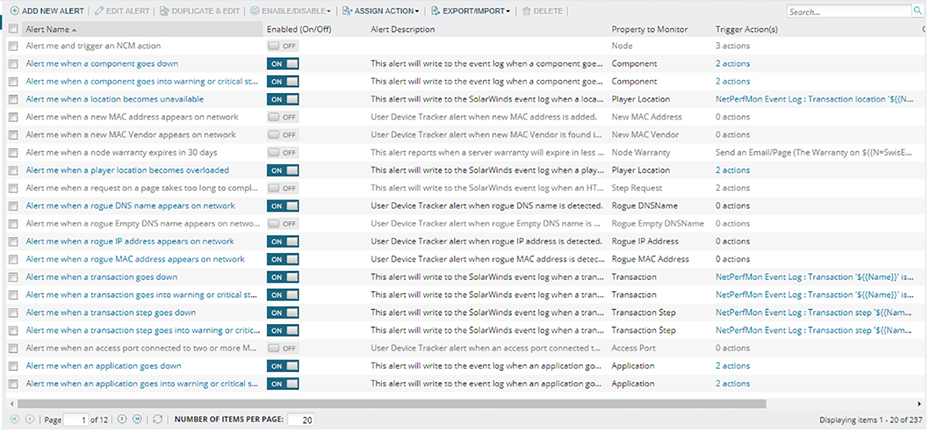
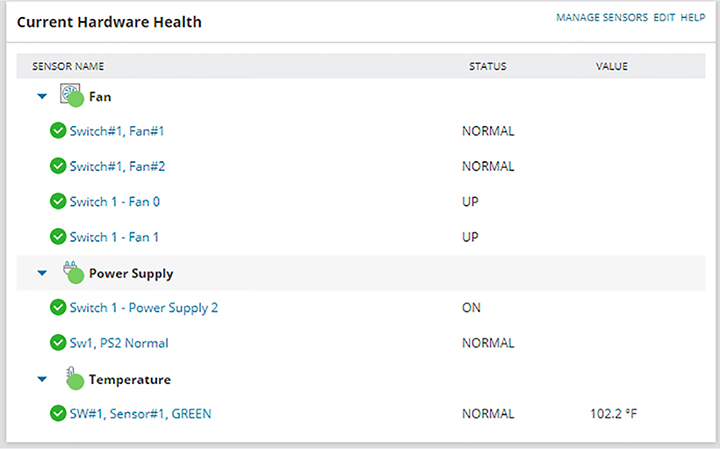
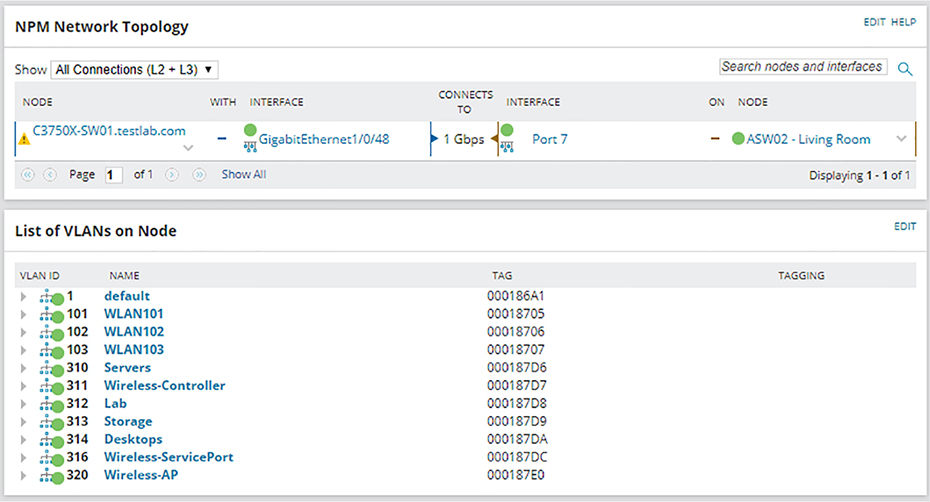
Figure 22.1 gives you an overview of my network. Figure 22.1 NMS network overview You can view more detailed information on the Alerts page, as shown in Figure 22.2. Figure 22.2 NMS alert configuration So how does an NMS make its decisions about how to handle an interface going down or what to do when a router reboots anyway? NMS is configured with lots of default rules defining how a system should treat various events discovered by the SNMP polling. And what’s cool is that every NMS solution lets you customize alerts to suit your environment. Sometimes it’s easy like with SolarWinds or Prime Infrastructure, but if you’ve gone with an open source solution, you just might find yourself writing java code at 3 a.m.! Figure 22.3 shows the alert customization page. Figure 22.3 NMS alert configuration NMS solutions can also serve as a convenient central syslog when troubleshooting. On the Syslog page, you can run searches to make it easier to filter exactly what you’re looking for, which is a really good thing because there can be hundreds of syslog messages at any given time. Syslog messages from a network device can also be used to notify the NMS there’s a network issue. You can even configure rules that will determine how the syslog will react to whatever syslog messages you want. This allows you to make things happen like having the server run a script if the NMS receives an OSPF-related message. All we have to do to configure a Cisco router to send syslog messages to the NMS is tell the router what logging level the router should send traps at. I’m going with level 7 to make sure syslog messages are sent so I can show you what the NMS side looks like. After that, I’ll just tell the router how to reach my SolarWinds server like this: Figure 22.4 gives you a look at the central syslog page. Figure 22.4 NMS central syslog The main information shown here is that several syslog messages have been reached from my router CSR31.testlab.com, and that highlighted message tells us OSPF has gone down. Now we’ve already covered configuring the SNMP traps that show up on the server a lot like syslog messages do. The main difference is that traps usually offer up a lot more detail than log messages. Just like before, we can search for a keyword or filter by device to make it easier to find what we’re looking for. And we can also configure rules if we want SolarWinds to do something in particular when it receives a trap. Figure 22.5 displays the central SNMP trap page. Figure 22.5 NMS central SNMP trap Another cool thing about NMS monitoring your network is that you can easily view a graphical representation of various interface information. Yes, you can actually see how busy your interfaces are by checking out the interface utilization graph; a glance at buffer misses graph tells you if your buffers are getting overloaded, and a quick look at an interface error graph shows you how many errors are on interfaces! So let’s check out the information in the Interface Utilization graph on my switch shown in Figure 22.6 Figure 22.6 NMS interface utilization Okay, so since this is a lab, we’re not seeing traffic here, but if I we’re downloading something, you’d see just how busy each interface gets. There’s also some good operational information like the assigned VLAN names the interface is using. SolarWinds also give us a good interface description, which really helps identify important information. When you’re troubleshooting manually, hardware health is notoriously hard to keep track of. Unless you’re right there on the box to troubleshoot an issue and/or happen to notice a log message about failing hardware, you probably won’t realize there’s a problem until the router blows up at 2 a.m.! Again, the NMS makes life a whole lot easier by presenting us with an easy-to-read graph on our hardware health. Figure 22.7 shows what mine looks like. Figure 22.7 NMS hardware health Surprise! A network monitoring system does indeed offer a ton of information about what’s generally up with the network. Two graphs I’d like to highlight are Response Time & Packet Loss, which is great for troubleshooting those “slow Internet” phone calls, and CPU Load and Memory Utilization is a snapshot of exactly how well a router is running and if it should be reconfigured or upgraded. Check out Figure 22.8 to get a picture of these. Figure 22.8 NMS network graphs NMS also pulls in intel like CDP information to show you vitals like which devices are directly attached to the switch and which VLANs are on the switch so it can populate other graphs. It analyzes routes within the routing table so it can determine if flapping is happening in your network, where a route appears and then disappears over and over. It culls even more advanced information like if the switch is in a stack or not, revealed in the VLAN table. Figure 22.9 pictures the Network Topology and VLAN tables. Figure 22.9 NMS network topology From this very brief look at network monitoring systems, you get the idea that we’ve only scratched the surface here. You can just imagine has the actual depth of the NMS, so it’s no surprise that there are tons of books and certifications based upon it. The CCNA introduces DNA Center, which we will talk about later in this chapter, and the CCNP and CCIE seriously expand on the topic. Just so you know, if you feel like test-driving SolarWinds for yourself, they offer a 30-day trial you can download at www.SolarWinds.com. Now that we’ve covered ways to monitor your network, we’ll move on to how to handle your configuration backups. Let me start by asking you what would you do if you had to replace your main Internet router due to an outage? Would you copy and paste a hopefully up-to-date config that was saved in Notepad? Maybe… But copying and pasting tons of configuration through a console port can result in missed lines that you’d have to troubleshoot. Worse, will you actually have to configure the entire router from scratch? Rebuilding a CCNA-level device from the starting gate may not sound so bad as long as you have the proper IPs on hand. But a busy real-world router can easily have hundreds or even thousands of lines of configuration! So how would you avoid that nightmare? Coming to the rescue of sys admins everywhere, the Network Configuration Manager does just what it sounds like it does—it manages your network configuration—yes! Depending on the specific solution, the NCM can be the same server as your NMS, or it can even be an entirely separate server with no integration. This is so good… NCM routinely backups your configuration by connecting to each network device and copying the configuration over to the server. Network devices can also be set up to notify the NCM about any changes so the server knows to collect the new configuration. Okay, saving configuration is very cool and all, but you’re thinking that’s something that can easily be done with a Python script written over a lunch break, right? Well, once the config is on the server, the NCM proves it value by letting you search through saved configs for keywords, letting you compare configuration to see if there are any changes between saved versions. And you can push out configurations too! Now that you’re sold, the commands below show how to configure a router to be added to an NCM. The NCM must be able to telnet or SSH into the box, so we’ll have to create a username and password for the NCM to use like this: NCMs can also use the SNMP Read-Write community to make changes on the box, meaning the SNMP seen in the NMS configuration may also be needed as well. Here’s a network device’s configuration overview page in SolarWinds shown in Figure 22.10 Figure 22.10 NCM config overview And here’s an example of the compare configs feature—key when trying to troubleshoot lost configs after a crash or even when you’re just trying to determine the changes that occurred on a device before disaster struck. Check out Figure 22.11 Figure 22.11 NCM compare config The NCM can also push out simple configurations. What’s more, you can even use the NCM scripting language to make configuration templates to effect mass configuration changes across the network. Every type NCM uses a different scripting engine for the template feature. For example, DNA Center uses Apache Velocity for creating templates, Solarwind’s scripting language can be seen in Figure 22.12.22.12 Figure 22.12 NCM push config And again, in the real world, NCMs are actually pretty complex things. What we’ve covered this far is just meant to get you used to the solution and prepare for when we get into how DNA Center handles the feature later. To really get what Software Defined Networking (SDN) is you’ve got to understand how a regular router sends traffic first. When a router receives a packet, it jumps through several hoops before it can send that packet out towards destination. Let’s explore that process now. Before the router can send out traffic, it has to know all the available destination routes. These routes are learned via a static route, a default route, or through a routing protocol. Because the CCNA exclusively focuses on OSPF, we’ve got to configure it and get the neighbors up. Once that’s done, we should have a nicely populated routing table for the router. It’ll look up the proper destination route with the help of Cisco Express Forwarding, which is what Cisco uses to build the forwarding table these days. Exactly how CEF and the forwarding table works are out of scope topics for the CCNA, so I won’t go into them further here. Now that we have our route, the router will need an ARP entry for the next hop IP address before it can send the traffic. The TTL on the packet will also be decreased by one as it passes through the router, and the IP header and Ethernet frame checksum will also be recalculated before the traffic is sent over the wire. Routers divide these different tasks into three different planes:
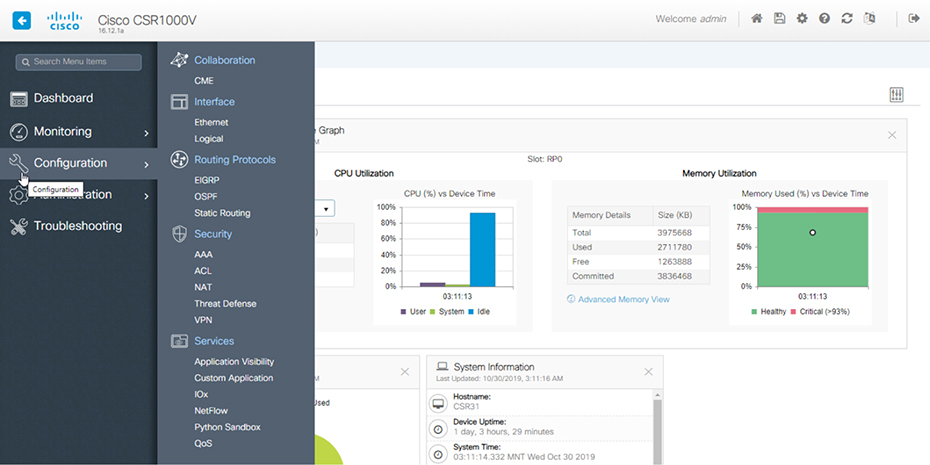
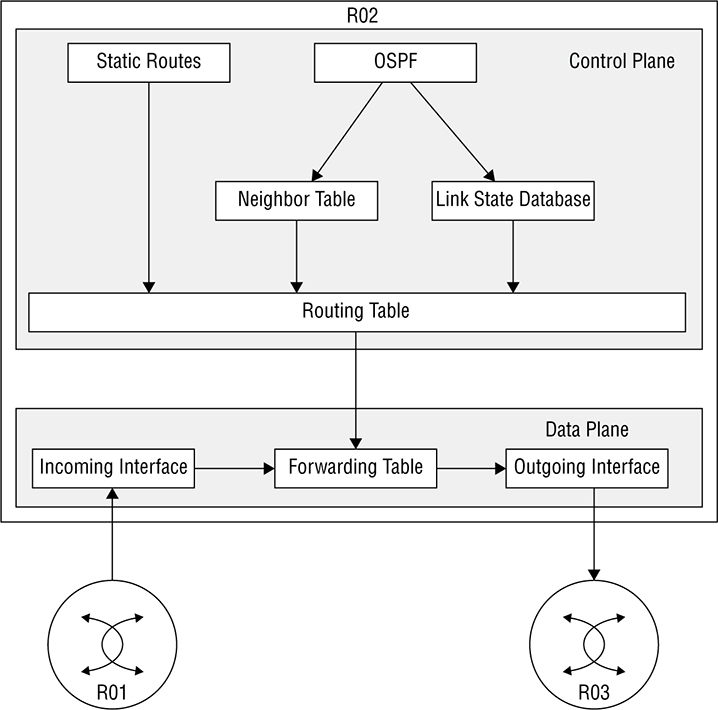
Let’s explore them now. The management plane controls everything about loging into a network device including telnet and SSH access—not that we would ever use telnet, right? SNMP is also included in the management plane, which allows Network Monitoring Systems to poll the device for information. And HTTP and HTTPs are also part of the plane. Maybe you’re thinking, “Cisco has got to have a web interface on routers!” In the IOS’s early days, the web interface was, um… Well, it wasn’t pretty. It was really just a way to run some IOS commands through a web page and you would only turn it on if you were running an application on your router that required it like Cisco Unified Call Manager Express. But now, with modern IOS-XE, the web interface is just lovely as you can see in Figure 22.13 Figure 22.13 IOS-XE web interface APIs are also considered management access including restful API discussed back in the Automation chapter. Ports like the console port, the AUX port, and the management port are also found here. The control plane is really the brain of the router—it’s where all the protocols are run and where all the decisions are made. The goal of this plane is to generate all necessary forwarding information needed to send the packet on towards its destination. So, lots of important things happen in the control plane. Security functions like defining ACLs and NAT, if the packet needs to change its source, or if the destination changed. Of course, everything to do with routing protocols like OSFP, including forming adjacencies and learning the routes, all occur on this plane. ARP is also a big part of the control plane, since knowing how to reach the layer 2 address of the next hop is essential for the actual routing to occur. Other control plane protocols include things like STP, VTP, and MAC address tables on switches, as well as QoS and CDP/LLDP. So if the control plane is the router’s brain, the data plane is its workhorse. The data plane’s job is to take all the information presented from the control plane and use it to send the packet on its merry way. Everything that happens at the data plane directly affects traffic. These are activities like encapsulating and de-encapsulating traffic as it arrives at and leaves the router, adding and removing packet headers as needed, plus actually dropping traffic that hits a deny statement on a ACL are all data plane tasks. Even the actual forwarding, where the packet moves from the inbound interface to the outbound interface, happen here as well. Okay—now that you know what the planes are and what happens at each of them, let’s turn to how things work on the router. I’ll start by walking through the steps R02 will take when it receives a packet from R01 that needs to be sent to R03. First, have a look at Figure 22.14 that pictures how the forwarding table is built from the routing table:
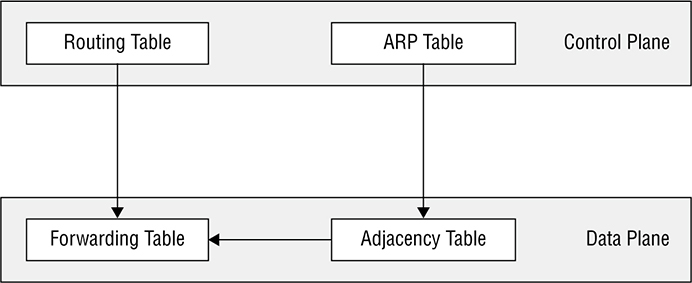
Figure 22.14 Fowarding traffic flow Now that the routing table has chosen routes, we can expand our diagram a bit to include more tables as shown in Figure 22.15
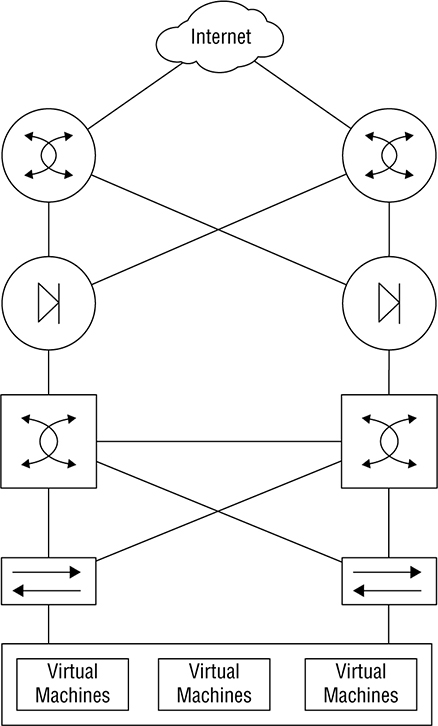
Figure 22.15 Forwarding table The whole story about how this works is well above the CCNA level, but packing the information I’ve given you will really help when we start talking about SDN because we’re going to be relocating the control plane off the device and on to an SDN Controller. Oh, and also before we get into SDN, I want to understand just how much work it would actually be to add a new virtual machine that uses a new subnet and requires Internet access into a traditional 3-tier architecture. Check out Figure 22.16 In general, we’d have to:
Figure 22.16 Full topology Not so bad? Well, now imagine that this just happens to be a really frequent request since most businesses constantly create new VMs! This is a very a big deal for the network team… It’ll take a whole bunch of time to plan the changes, go through change control, and then actually implement them. Plus, the whole melee introduces a lot of risk with all those changes and increases the odds the network won’t be cleaned up after a VM is no longer needed by the business. You get it now—adding a VM is no small thing! I’m going to begin our journey into the world of SDN by introducing you to two of its important components: the Northbound Interface and the Southbound interface. We gain access to the SDN solution via the Northbound Interface (NBI), which is actually similar to the management plane we just went over. The SDN Controller communicates with network-level devices through the Southbound Interface (SBI). Figure 22.17 gives you a picture of the architecture. Figure 22.17 SDN architecture The reason we access the SDN Controller through the NBI is so we can deploy the SDN to get something done for us, and most of the time, we do that via a GUI in Meraki or through a restful API call inside a script. We’re free to use whatever language we want for the script because all it’s going to do is call the restful API. Some of the vital things we can do through the NBI are creating VLANs, getting a list network of devices and generally polling the health of our networks. We can even automate the network in a way that would completely solve the scenario laid out at the beginning of this chapter! Now as I said, the South Bound Interface (SBI) is how the SDN Controller actually talks with the network device, and there are lots of different ways it can do that depending on your specific solution. For instance, OpenDaylight, a popular open source SDN Controller, uses a protocol called OpenFlow to talk to switches. On the other hand, Meraki uses a
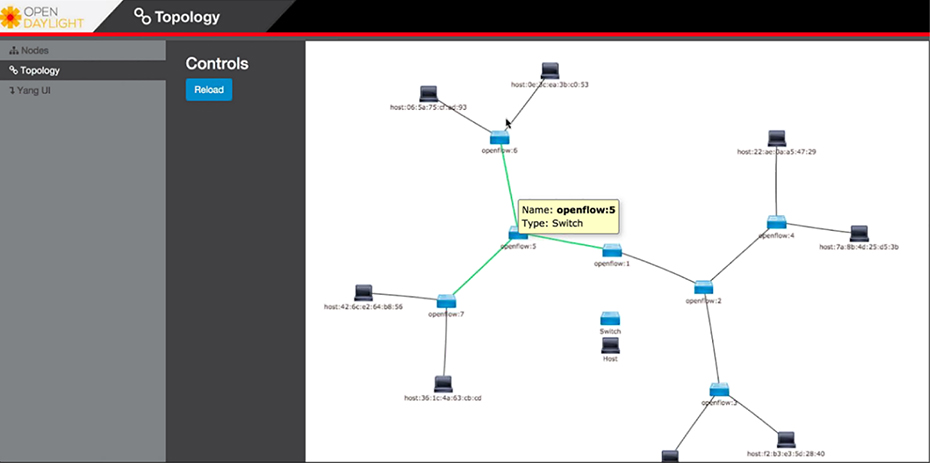
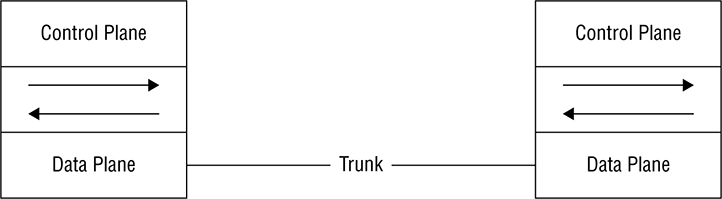
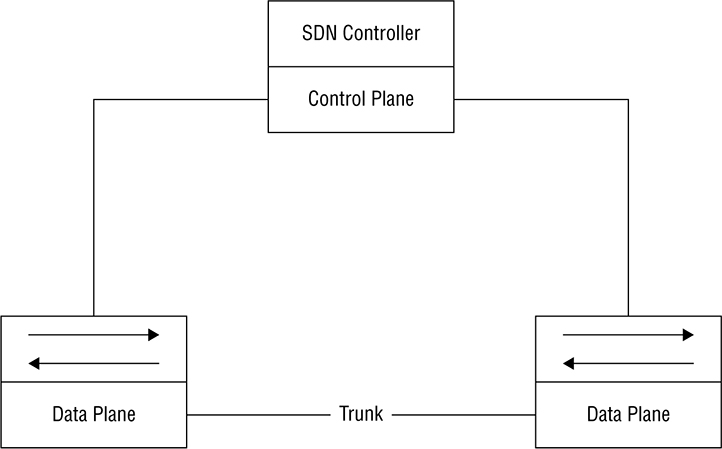
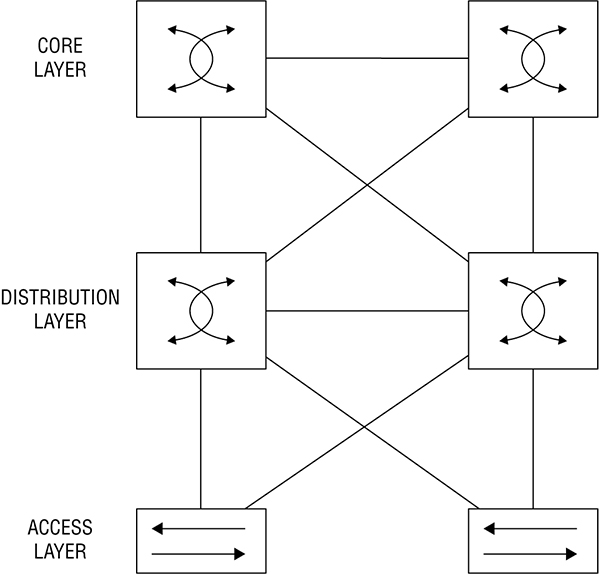
proprietary solution right now since they manage everything themselves. Here’s a rundown of some common southbound interface protocols: OpenFlow Describes an industry-standard API defined by the ONF (opennetworking.org). It configures non-proprietary, white label switches and determines the flow path through the network. All configuration is done via NETCONF. OpenFlow first sends detailed and complex instructions to the control plane of the network elements in order to implement a new application policy. This is referred to as an imperative SDN model. NETCONF Even though all devices don’t yet support NETCONF, it provides a network management protocol standardized by the IETF. With the help of RPC, you can install, manipulate, and delete the configuration of network devices using XML. onePK This is a Cisco proprietary SBI that allows you to inspect or modify the network element configuration without hardware upgrades. It makes life easier for developers by providing software development kits for Java, C, and Python. One PK is now legacy, but it’s still possible to find it in the real world. OpFlex This is a southbound API that is used by Cisco ACI, OpFlex uses a declarative SDN model because the controller, which Cisco calls the Application Policy Infrastructure Controller (APIC), sends a more abstract, “summary policy” to the network elements. The summary policy makes the controller believe that the network elements will implement the required changes using their own control planes, since the devices will use a partially centralized control plane. There are myriad SDN Controller solutions on the market today. Here’s a list of the ones you might come across. Cisco APIC-EM This was Cisco’s first real attempt at an enterprise SDN controller, and its main focus was configuring Cisco’s IWAN solution. Considered legacy these days, APIC-EM was succeeded by DNA Center. Cisco DNA-Center This is Cisco’s main enterprise SDN controller that we’ll explore soon! Cisco ACI This is Cisco’s Data Center focused SDN solution. You can learn all about ACI in the Data Center certification track. Cisco SD-WAN This solution brings the benefits of SDN to the WAN. You’ll learn more about SD-WAN when you tackle the CCNP. OpenDaylight ODL is a popular open source OpenFlow controller. Cisco offers a wee bit of OpenFlow support, but Cisco definitely prefers their own SDN solutions due to OpenFlow limitations. Here’s an example of OpenDaylight in Figure 22.18 Figure 22.18 OpenDaylight topology Software Defined Networking can actually mean lots of things, but it generally refers to separating the control plane from the data plane on a network device. Of course, this is a big help in device management because devices can be centrally managed by a controller, instead of manually. So let’s take a look at how things work on a plain, vanilla switch. Know that the control plane exists on each device independently and traffic is sent through interfaces in the data plane; see Figure 22.19. Figure 22.19 SDN control plane This is a great example of separating the control plane that doesn’t plunge too deeply down the Cisco Meraki rabbit hole. Everything in Meraki’s lineup is totally managed by the cloud, which means actual devices really only provide the data plane. The advantage here is that you can centrally manage your equipment from anywhere—there’s even an app for that, but it’s pretty limited right now. The downside to the Meraki model is predictable: Because devices have to be able to reach the Meraki cloud before you can manage anything, things get awkward fast when you’re flailing to resolve an outage or trying to get some pesky site online! But Meraki does equip us with basic, local management abilities that help troubleshoot connection issues as demonstrated in Figure 22.20 Figure 22.20 SDN Controller Another good central management example is brought to you by the Cisco Wireless LAN Controller. The access points that join the WLC aren’t to bright on their own, so they rely on the controller to push the configuration to them and tell them what to do. Cisco SDN solutions like Digital Network Architecture (DNA) Center, which we’ll talk about soon, allows you to centrally manage your network device’s configuration through several applications that live on the SDN Controller. This is better than traditional configuration because if you need to make changes to your network, you just adjust the settings in DNA Center to be replicated to your network’s relevant devices. This is a beautiful thing because it ensures configuration is consistent everywhere at once, greatly reducing the risk of death by typo when making a change on 50 switches manually—nice! Of course, there’s a downside to central management. For instance, say I were to accidentally type in “switchport trunk allowed VLAN 10” instead of “switchport trunk allowed VLAN add 10” on a switch. I’d probably cause an outage I’d have to scramble to fix, but it wouldn’t be the end of the world. On the other hand, if I made that same mistake on a template that I’m pushing to all my switches? Apocalyptic—time to make sure the old resume is up to date for sure! So fortunately, we can usually build out our configurations in the controller before applying them, maybe even getting someone to peer review things before sending away. Anyway, controllers also give us a convenient central point for monitoring and automation since they’re usually aware of a large part of the network, if not all of it. Just so you know, the only type of architecture we’ve covered so far is the campus architecture that’s most commonly used in traditional, enterprise networks. And just in case you need a quick review, in this kind of architecture, switches are connected to each other in a hierarchical fashion. The upside to this approach is that troubleshooting is easy since the stuff that belongs in each layer of the model is well defined, just like how the OSI model makes it easier to understand what’s happening on the network and where. All the endpoints in the network connect to the access layer where VLANs are assigned. Port-level features like port security or 802.1X are applied at this layer. Since access layer switches don’t have a lot of responsibilities and generally, no layer 3 configuration aside from what’s needed for managing the switch, you can usually get away with cheaper layer 2 switches and save some coin. The Distribution layer hosts all the SVIs and provides any IP-based services the network needs like DHCP relay. The distribution switch uses layer 2 interfaces with the access layer switches to terminate the VLANs, plus layer 3 interfaces to connect to the core switches. It will also a run a routing protocol to share routes with them. The core layer’s only job is providing high speed routing between the distribution switches. It doesn’t offer any other services—it just makes sure packets get from one switch to another. Here’s an example campus topology in Figure 22.21 Figure 22.21 Campus fabric The new and preferred architecture for controller-based networks and data centers is called CLOS, which stands for nothing other than the guy’s name who thought it up. CLOS is a spine/leaf design wherein you have two types of switches: a spine and a leaf. The Leaf switch maps to the access and distribution layers in the Cisco 3 tier model and is what you connect your devices into. Each leaf switch has a high-bandwidth uplink to each spine switch. The spine switch is a lot like the core because its sole job is to provide super fast transport across the leaf switches. Because leaf switches only connect to the spine switches not other leaf switches, traffic is really predictable since all destinations in the fabric follow the same path: Leaf -> Spine -> Leaf. Because everything is 3 hops away, traffic is easily load balanced in the routing table via equal-cost load balancing (ECMP). What’s more, it’s also very easy to expand the network. If you need more ports, just add a leaf switch. Need more bandwidth? Just add another spine switch. Figure 22.22 pictures CLOS topology. Figure 22.22 CLOS topology One of the benefits of Software Defined Networking is that a SDN controller can abstract away the “boring stuff” so you can focus on the fun more complex configurations. One of the ways SDN achieves this is by dividing the network into two different parts. An underlay, this is the physical network that is focused on providing a lot of layer 3 connectivity throughout the network. The underlay typically uses the spine/leaf architecture we just discussed but can also use the campus architecture depending on the solution being used. For example, DNA Center’s Software Defined Access solution is based on a typical campus topology because it is aimed at enterprise networks. SD-Access does use slightly different names though, the access layer is called the edge, and the intermediate node is the equivalent of the distribution layer but we don’t need to worry too much about that architecture. There is also the overlay component, which is where the services the SDN controller provides is tunneled over the underlay. We’ll have a closer look at the underlay and overlay in more detail. Underlay has its own components, and we’ll cover each of them in this section:
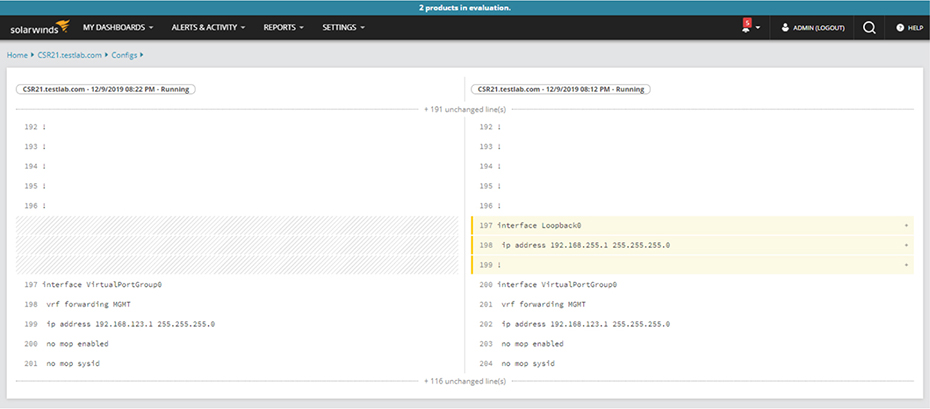
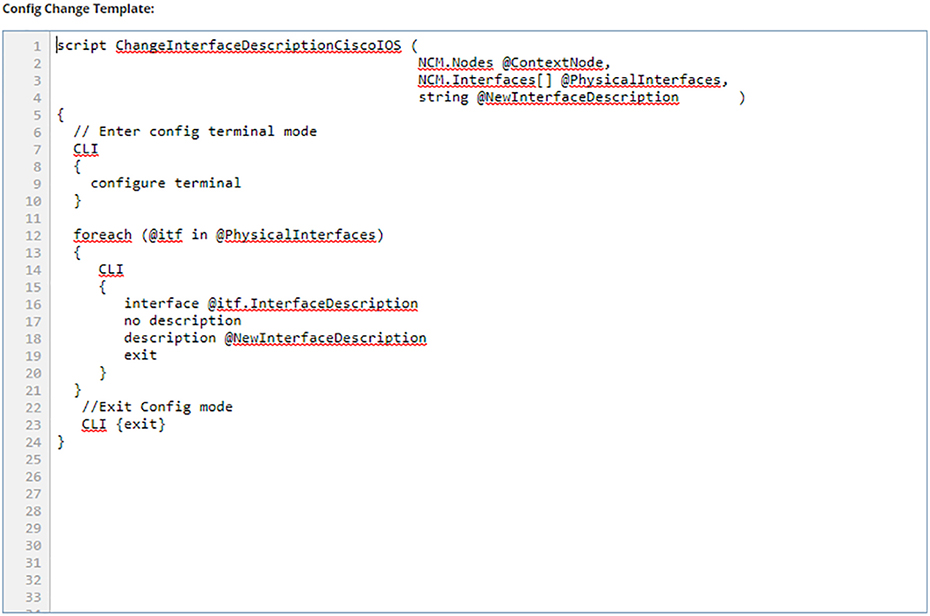
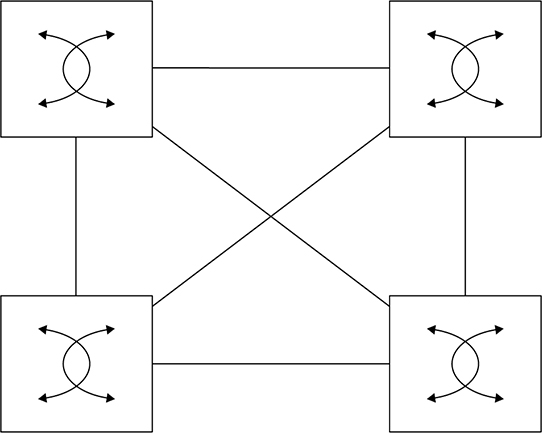
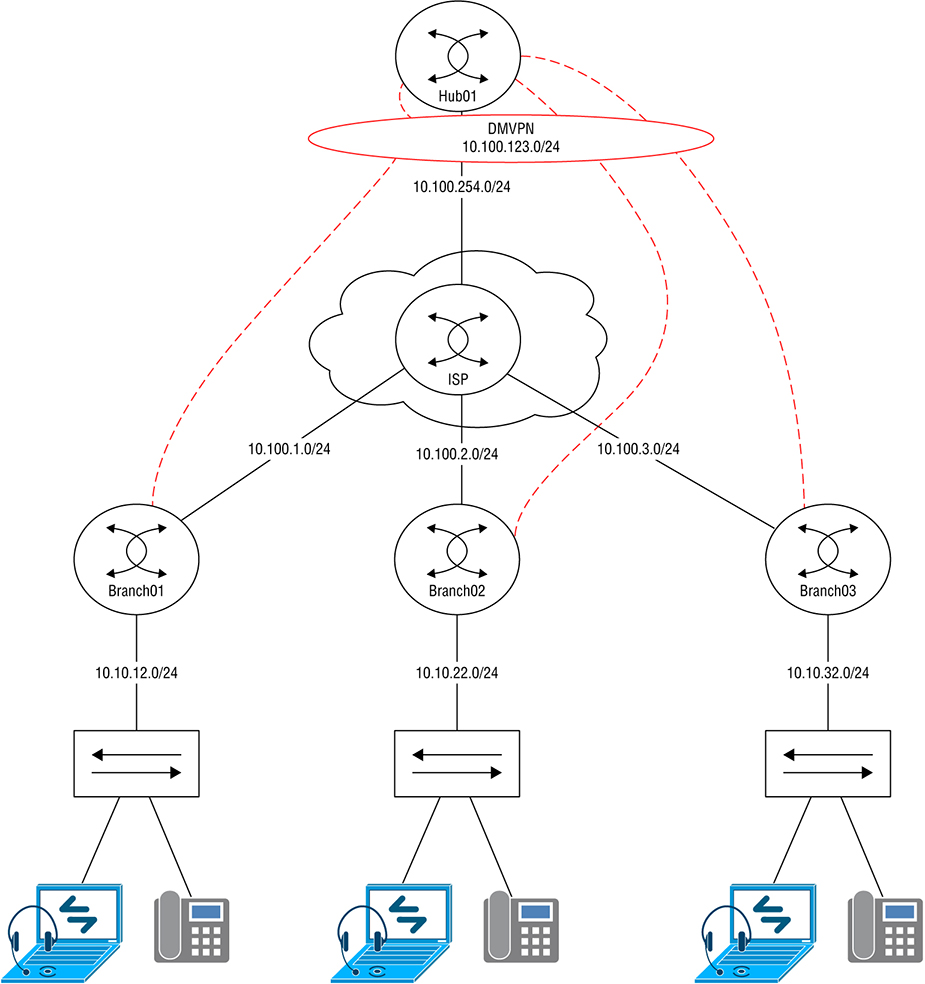
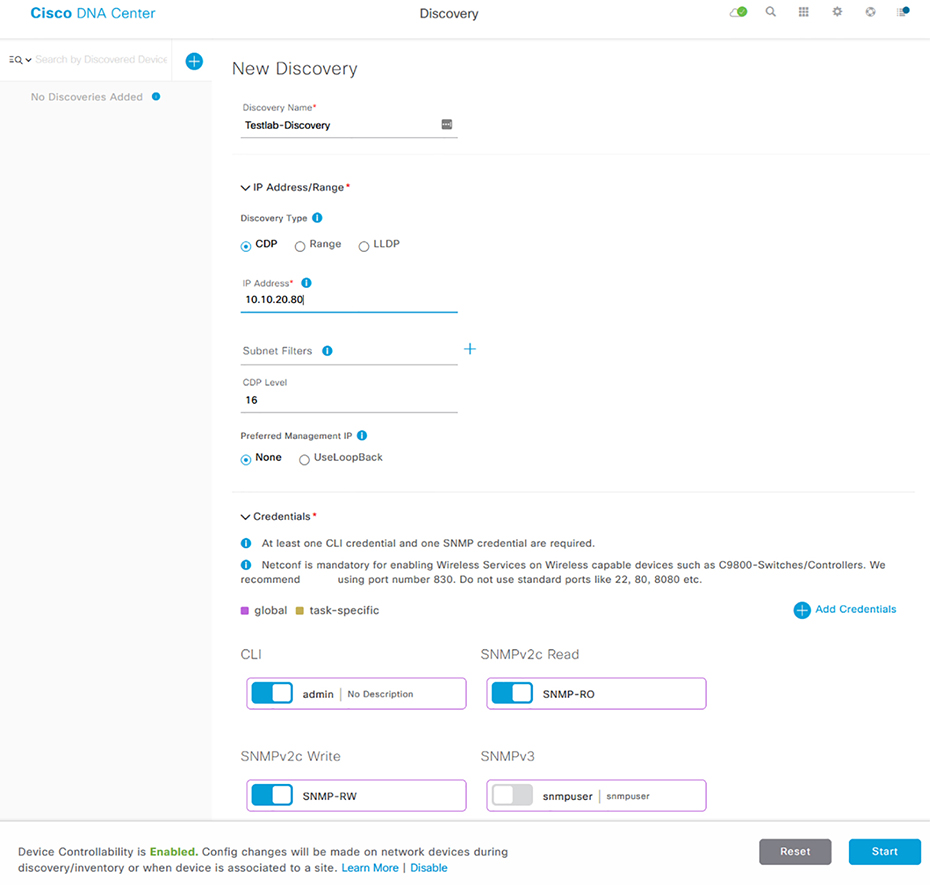
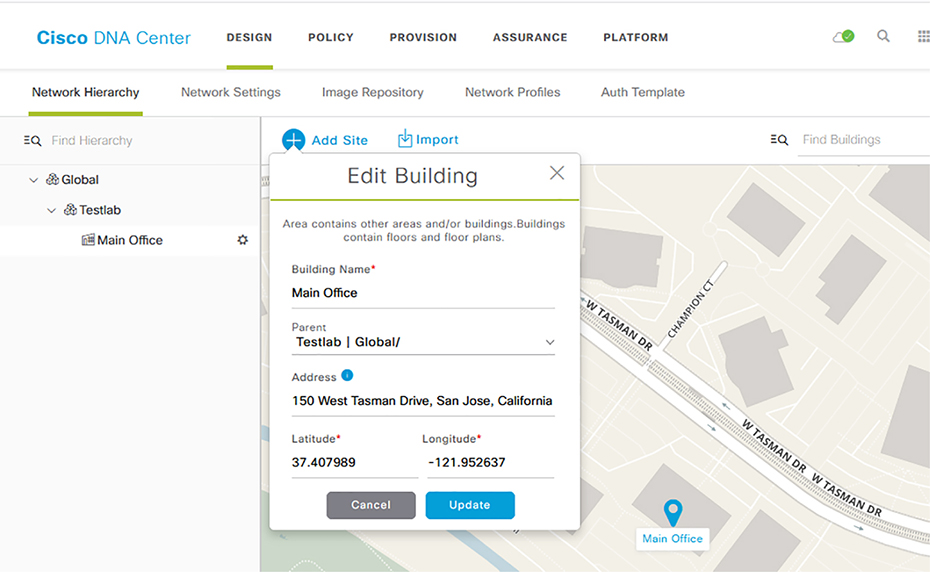
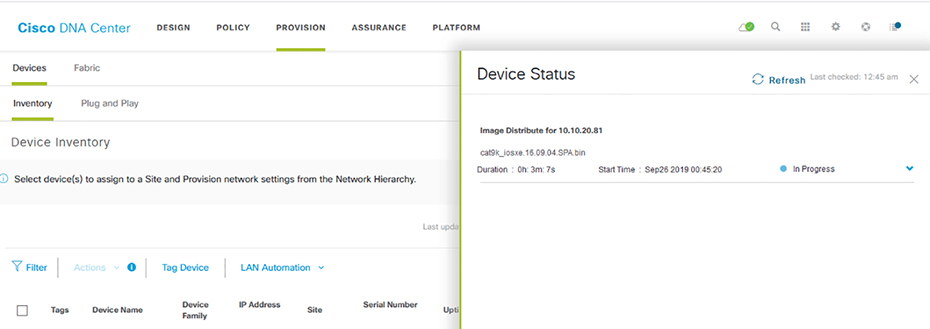
So the underlay is basically the physical network that provides connectivity so that the overlay network can be built upon, or over it. There’s usually basic configuration on it and its focus is on advertising the device’s loopback IP into OSPF or IS-IS is another link state routing protocol that is beyond what we need to learn for the CCNA. Devices in the underlay tend to be cabled so they’re highly redundant, removing single points of failure and optimizing performance. One way to implement this is via a full mesh topology, where every device is connected to every other device. Even though a full mesh network provides maximum redundancy, it can get out of hand fast because of the number of links involved as your network grows. Figure 22.23 pictures an example of a standard underlay topology. Figure 22.23 Underlay topology The Underlay’s job it to carry a lot of traffic with larger packet payloads than you’d normally see in a standard network. Because of this, it’s a good idea to raise the MTU on the underlay switches so the larger packets don’t give you any grief.You change the MTU on most Cisco IOS or IOS-XE based switches via the system mtu command. The switch must be rebooted for the change to take effect: Since the underlay will be running a routing protocol, ip routing needs to be enabled to make the act as a layer 3 switch: It’s a bad idea to go with Spanning Tree Protocol in an underlay topology because its job is to block redundant links—a problem, because it results in the underlay switch’s superfast uplink interfaces that clock in between 10gbs, 40gbs, even 100gbs, not always being used. What a waste! You can sort of mitigate this by spending (wasting) a bunch of time adjusting the STP configuration by spreading the VLAN root across several switches, but it really won’t solve the problem because each VLAN will still have blocked links. The better way to handle this is to use only layer 3 interfaces. Doing this means STP won’t run at all, meaning all the switch interfaces in the underlay will also run without being blocked. Plus, there won’t be any loops to worry about since its just OSPF or IS-IS doing the routing. And as a further bonus, because the switches should all have the same number of connections, the routing table can load balance traffic using Equal Cost Load Balancing (ECMP)! So with all that in mind, I’m going to configure the interfaces connecting the switches together as layer 3 interfaces and give them an IP address. To be more efficient, I’ll also configure OSPF on the interfaces to use the point-to-point network type in order to remove the need for a designated router, like this: Each switch in the underlay should have a loopback interface for later, when we talk about the overlay: Next, OSPF needs to be configured. There’s really nothing wrong using another routing protocol like EIGRP here, but since the CCNA only focuses on OSPF, I’ going with that. I want all IPs on the switch to run OSPF, so I’ll use the network 0.0.0.0 0.0.0.0 area 0 shortcut to enable all interfaces: The underlay’s focus is to ensure routing is working so there isn’t much else to add to the configuration aside from a standard switch setup like configuring AAA or NTP. Some solutions require features like multicast routing, but that’s above the CCNA level. To save some typing time, I went ahead and configured the other switches in the topology just like I showed you with SW01. At this point, we can see that all the switch interfaces have formed an OSPF adjacency: When I look at the routing table, I see that SW01 has learned each switch’s loopback address and is load balancing the route across two interfaces because of ECMP: SW01#show ip route ospf | b 192.168.255 Okay—we’re done! The underlay is now all set and ready for the overlay configuration. Basically, an overlay is a “virtual network” that’s tunneled over your underlay devices. This allows the SDN Controller to have strict control over the traffic running through the network. The type of tunnel being used varies depending on the exact SDN solution, but generally it is Virtual Extensible LAN (VXLAN) being used. VXLAN is a way of tunneling Layer 2 traffic over Layer 3, this allows you to connect VLANs across routed networks, but the details are above the CCNA level. The overlay is where the advanced configurations like security or QoS gets introduced into the network. The underlay has no visibility into the tunneled networks so it can’t effectively do things like filtering traffic. Routing for the overlay is usually handled by BGP or EIGRP. Going with link-state protocols is a bad idea because they require all devices in an area to have the same LSAs. Plus, you can’t easily improve the routing table with summaries, etc. Dynamic Multipoint Virtual Private Network (DMVPN) is a very popular type of overlay that runs over the WAN. In this topology, each branch connects to the hub router through DMVPN using the 10.100.123.0/24 network, allowing us to run an IGP across the Internet to provide that all-important, consistent routing factor. DMVPN actually offers lots of advantages, but for now, check out Figure 22.24 for a simple example of an overlay. Figure 22.24 DMVPN topology The network fabric is actually the simplest thing in this chapter to understand. It’s really just a shorthand term for all the layer 3 network devices—the routers, switches, firewalls, wireless controllers access points involved in a solution. We can refer to the network as a fabric when we’re talking about SDN because the network details are abstracted by the SDN Controller. Put another way, a fabric is a simple, high-speed, layer 3 network. The motivation behind this trend is that IP networks scale better than layer 2 networks because we don’t need to work a bunch of complex engineering magic to get around STP limitations. Also, layer 3 fabric isn’t usually so risky when it comes to misconfigurations because the SDN Controller dynamically builds and maintains the underlay and overlay networks for you! The rest of our time in this chapter is going is going to be spent on DNA Center. When we wrap it up, you’ll be well up to speed on all the various services it serves up. Basically, the whole point of DNA Center is to be your one-stop shop for managing all networking and troubleshooting needs. In that vein, DNA Center provides full network monitoring just like we talked about in the NMS section, only more. In addition to the SNMP monitoring and storage for statistics, DNA Center captures a complete snapshot of your network for up to a week—pure gold when troubleshooting network snags of any stripe! DNA Center even offers troubleshooting advice to help you resolve complex issues by taking advantage of AI/Big Data analytics to help you make decisions. The server has a robust NCM component that can not only do configuration apply templates, it takes things much further by allowing you to automatically configure switches just by taking them out of the box, connecting the network interfaces, and powering it up! As if that wasn’t enough, DNA Center is also an actual SDN Controller, fully capable of building out underlay and overlay networks in order to support Cisco’s Software Defined Access feature. And Cisco is continuously adding new features and application integration to the solution. For example, DNA Center can replace APIC-EM by managing IWAN, a legacy SD-WAN solution through an SDN application. The server can also centrally manage the WLCs in your network and will be able to eventually manage other Cisco solutions like SD-WAN or ACI down the road. Figure 22.25 shows an example of the DNA Center dashboard, plus a sweet summary of everything going on the network. Figure 22.25 DNA Overview Nice, huh? Now let’s walk through some of the powerful features that DNA Center brings to the table and contrast them with how we’d trudge through these same tasks in traditional network management. To make our lives easier, DNA Center can dynamically search the network for the devices to add so we don’t have to add them all manually. The Discovery feature works by querying IP ranges you specify or by logging into a device and following its CDP/LLDP information throughout your network. Once DNA Center has detected devices, it’ll try to access them with SNMPv2, SNMPv3, Telnet, SSH, HTTP(S), and Netconf to gain control of the device and add it to the inventory. Discovery jobs can be scheduled to run as often as you want to ensure all your Cisco devices are managed by DNA Center. You can also create multiple jobs in case you need to use different connection options in other parts of your network. Figure 22.26 shows what the discovery page looks like. Figure 22.26 DNA discovery So while it’s true that other NMS solutions can usually discover nodes in the network, DNA Center again takes things a step further by serving up a lot of robust options for protocol support. Another cool factor comes down to licensing… When you buy a solution like SolarWinds or Prime Infrastructure, you’ve also got to pony up for licensing to be able to add nodes. And SolarWinds charges you for every little element you add, even a measly
network interface. Just imagine you have four switches in a stack and each one of them has
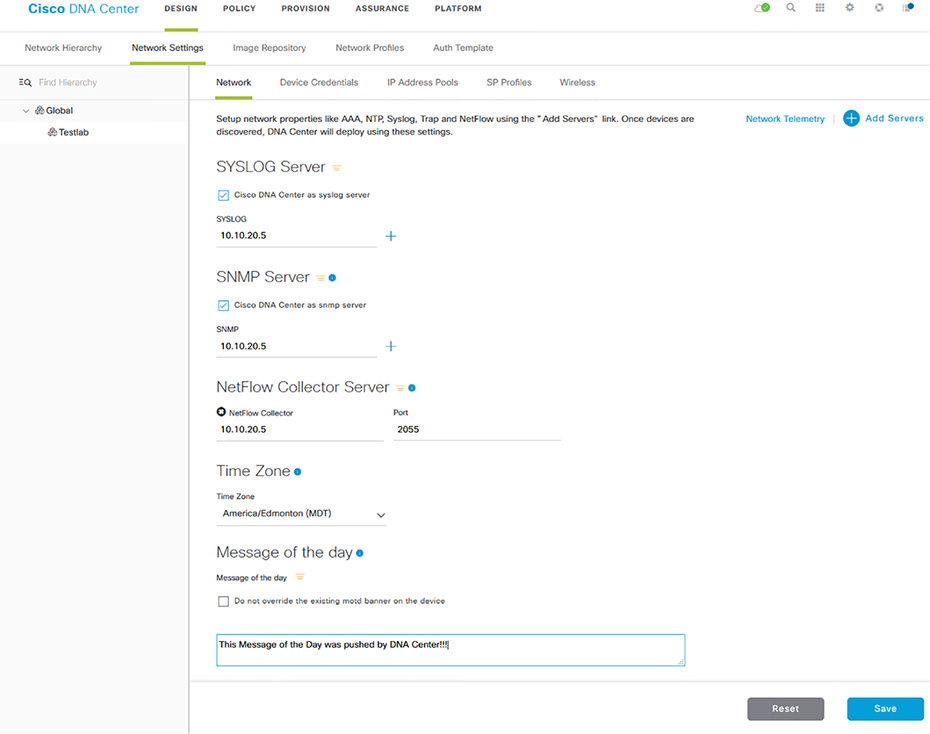
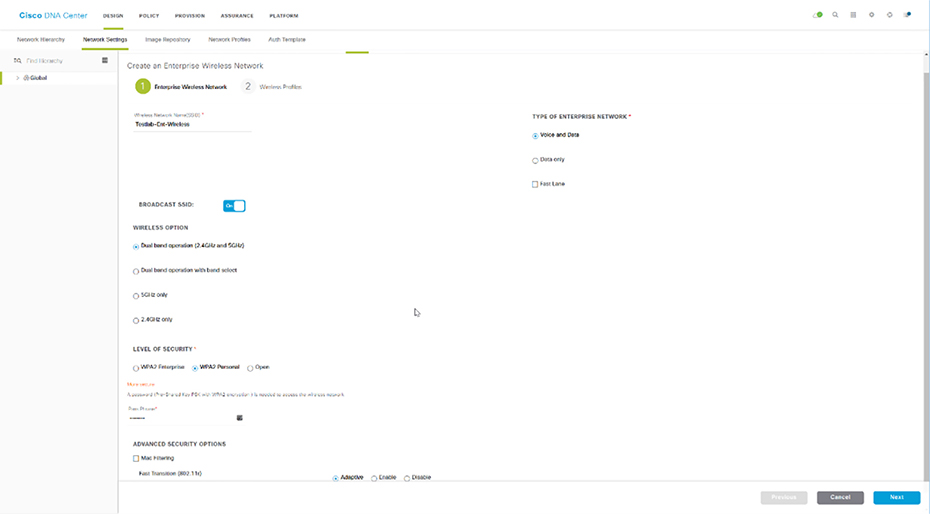
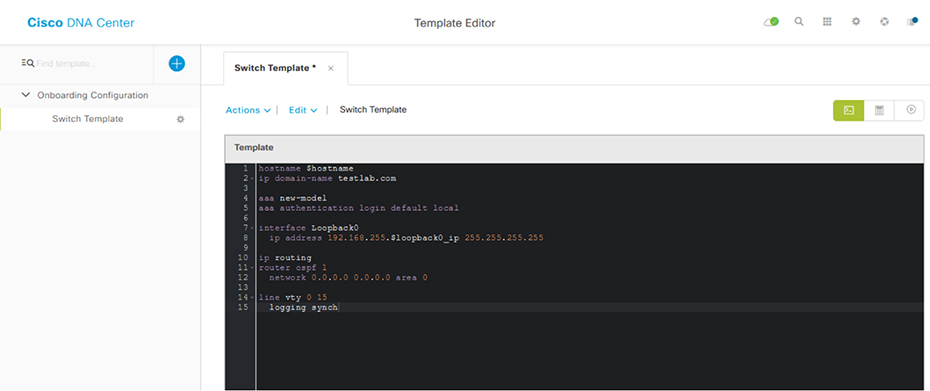
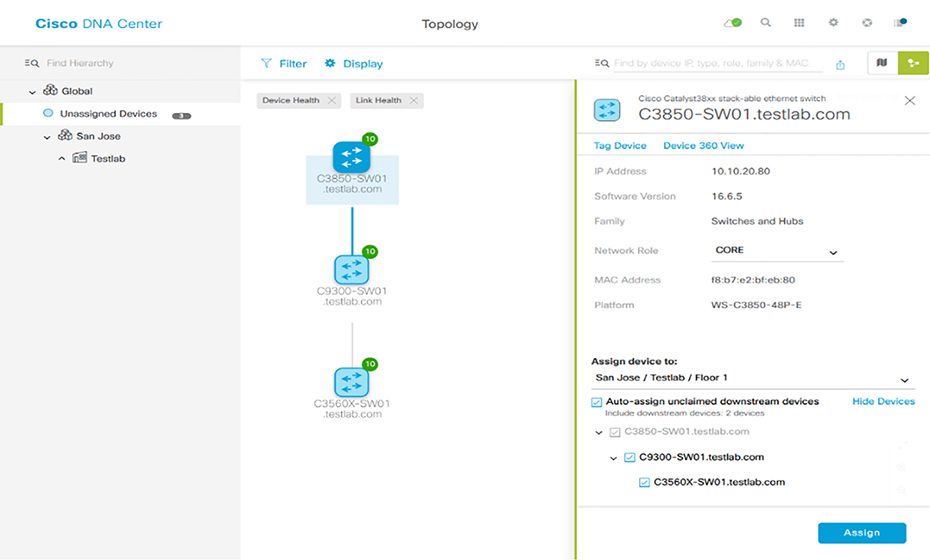
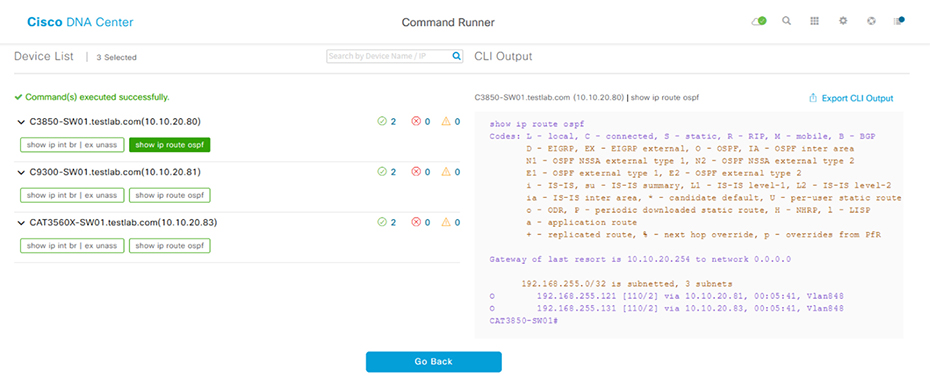
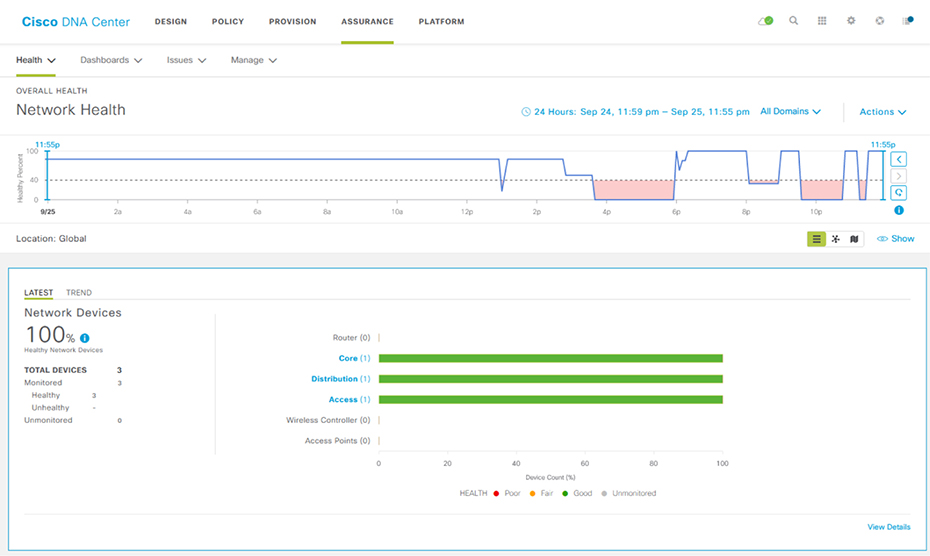
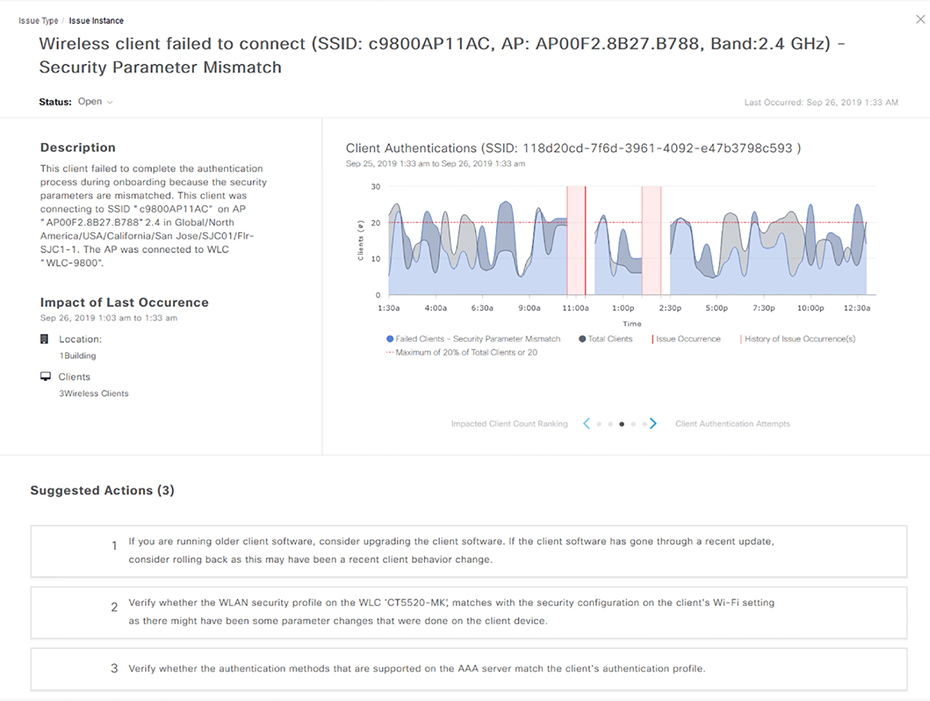
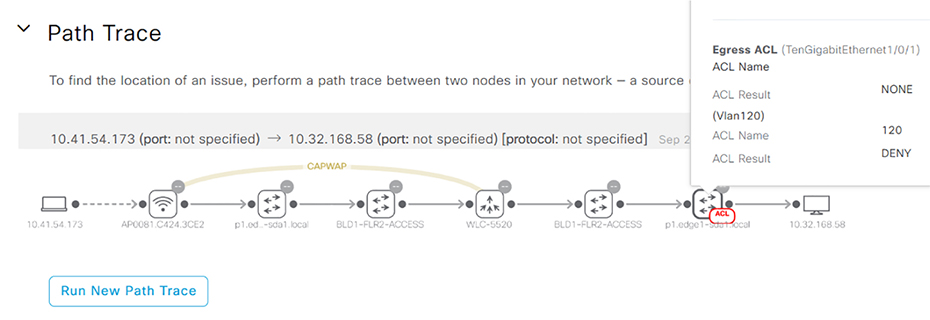
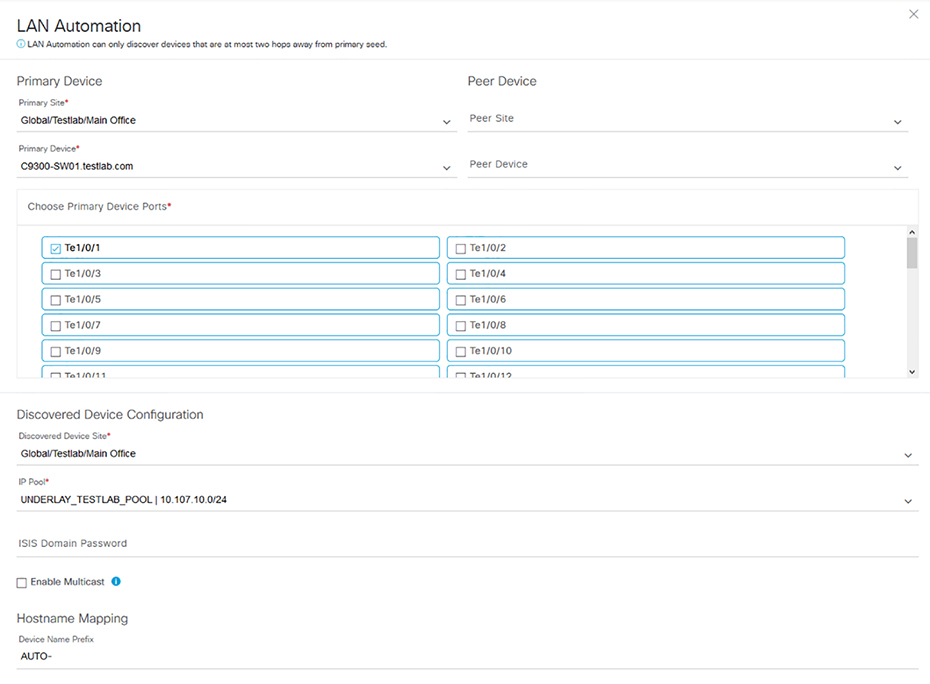
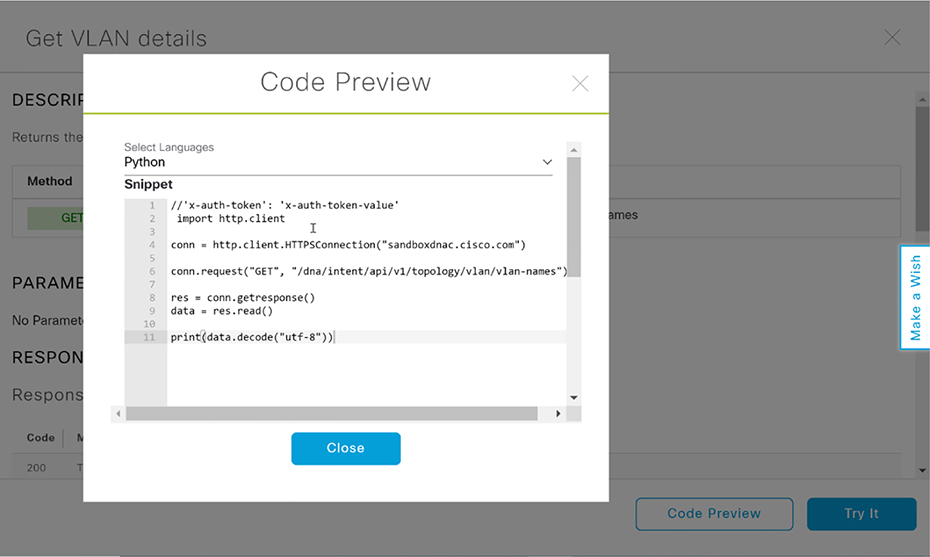
48 interfaces. That comes to a whopping 192 licenses required to add all those interfaces into SolarWinds for monitoring! Because of this, most SolarWinds deployments focus only on adding vital interfaces like uplink ports. But with DNA Center, life is so much better because each device has the proper license installed locally, which is something you can take care when you order the device from your Cisco partner. Contrast all of the above if you aren’t using an NMS. You’d have to manually keep track of your network devices with either an open source solution or maybe just an Excel spreadsheet that you edit when you make changes to your network! A wonderful benefit DNA Center brings is allowing us to organize our networks into sites and locations using the Network Hierarchy feature as pictured in Figure 22.26 Figure 22.27 DNA Network Hierarchy This gives us another troubleshooting advantage, provides site survey information to Wireless Controllers, and also provides configuration consistency across various locations. Common settings like Authentication, Syslog servers, NTP Servers, or the Message of the Day can be automatically pushed to network devices when they’re added to the inventory. This feature ensures that there’s no stale configuration on random routers after the NTP server has an IP change because we can just update the value for the DNA. Check out Figure 22.28 DNA Center can also fully manage your wireless environment so any WLC configurations, like when you add a new SSID, can be done in the Network Hierarchy tool. This makes it easy to create wireless configurations to apply to multiple WLCs. Take a look at the Wireless settings in Figure 22.29 Figure 22.28 DNA Network Settings Figure 22.29 DNA Wireless Settings A traditional NCM like SolarWinds has a similar feature to Network Hierarchy called Compliance. It allows you to define which configuration should appear on a network device, with the NCM alerting you if the device doesn’t have that configuration. The difference here is that the compliance feature won’t usually push the configuration to ensure consistency. NCMs rarely allow you to group network devices in a hierarchy. Instead, they typically make you manage each device independently. NCMs generally can’t centrally control your wireless controllers either since that requires deep vendor knowledge to make happen. Whereas, DNA Center uses that in-depth knowledge to offer plenty integrations into Cisco devices beyond just wireless! One caveat is that DNA Center doesn’t yet support device configuration backups. Because of this we still need to use SolarWinds or Prime Infrastructure to handle device backups. But there’s some rapid development going on with DNA Center so maybe a nice backup feature will be available by the time you read this sentence. It kind of goes without saying, but if you’re doing all this manually, you’d have to be logging into all your network devices almost constantly to verify that the configuration is still current and meeting your needs. Configuration changes over time as you troubleshoot issues or execute changes on devices. When you need more specific configuration pushed to network devices, you can apply Template features to a Network Hierarchy location. The Template feature allows you to type out the IOS configuration you want applied and to make things easier it also supports the Apache Velocity scripting language. Apache lets you make your templates more powerful by adding more functionality into your configuration with some cool little tools like: Variables Variable can be defined anywhere in the configuration by adding a dollar sign in front of a word. In the screenshot example, I created a variable called loopback_ip so I can have a different loopback interface IP on each network device. Enable Mode By default, DNA Center will assume everything in the template is a configuration command. If you need to push an enable command like clock set you can put the command between #MODE_ENABLE before the command and #MODE_END_ENABLE after it like this: Interactive commands Most commands in IOS don’t prompt the user for additional input but some, like the banner motd or the crypto key generate rsa general-keys commands, do. If you need to push such a command, you can put #INTERACTIVE at the top and #ENDS_INTERACTIVE at the bottom. This can get a little confusing, so I’m going to give you an example to bring it all home to you. For the interactive portion, I put a <IQ> after the command, and followed by the expected prompt values, you’d enter your response after the a <R>. To further clarify things, check out this output using the crypto key to generate rsa general-keys command: Okay—now you can see here that the CLI is asking us if we want to replace the keys with a yes or no prompt. To add this to a template we do the following: The yes/no answers are captured by the <IQ> tag (IQ standing for Interactive Question), and the response is captured by the <R> tag. You don’t need to know how to make templates for the exam, but it’s good to see the functionality is there. Have a look at a template in Figure 22.30 Figure 22.30 DNA Switch Template Templates work pretty much the same with DNA Center and other NCM solutions, with the only real difference being found in the scripting engine capabilities. We usually do this manually in a sort of log by keeping text files with configurations that the network team can copy and paste into the router as they need them. DNA Center likes to build a layer 3 diagram using the network devices it knows about. This is great because we get to reference a dynamic network diagram when troubleshooting instead of only relying on some Visio diagram that’s probably way out of date! It creates its diagrams with the information provided by CDP and LLDP, and it also follows the MAC and ARP tables to figure out what’s connected. If the map isn’t entirely accurate, you can tweak it manually. DNA Center also needs to know the topology so it can inform other features like SD-Access. Figure 22.31 offers a snapshot of what the topology map looks like. Figure 22.31 DNA topology Good to know is that while NMS solutions can create network maps, they’re often created manually by the network team. For instance, SolarWinds has a network map creator used to arrange the network devices into the network topology you want to see in the dashboard. The thing is, doing this manually means maintaining a network topology made in Visio, and as implied, these almost always get out of date fast. As far as I know, no one has ever met anyone chomping at the bit to obsessively make sure the documentation is current! To everyone’s relief, DNA Center tries to improve life by dynamically creating the network topology for us. It discovers network devices and adds them to the map in an intelligent way. True—you’ll definitely still need to customize the map to make sure its accurate, but it does the heavy lifting for you. Another thing that will scatter everyone on your team is when you need to upgrade a device’s firmware. This is painfully boring: You must find and download the proper IOS image for your device, copy the image onto the device, set the boot statement, reboot, and then… WAIT. Now while upgrading a router or two doesn’t sound so bad, things can get really get out of control if some security vulnerability is discovered within the IOS you’re using. Yep—just like that, now you’ve got a hundred routers you need to upgrade—fast! Upgrading is usually a big part of onboarding a new router too since the IOS that ships on a router is probably not the same version you actually want to be using on everything. Breathe easy because DNA Center can allow help you standardize the IOS versions you’re using on all your network devices by making sure new network devices are automatically upgraded to the version you want. This feature allows us to download images directly from Cisco.com or manually upload them and it also points out the suggested IOS release for the platform. Here’s an example of the repository used by the upgrade feature in Figure 22.32 Figure 22.32 DNA upgrade repository DNA Center will move the image onto the device using SCP or HTTPS, which is a heck of a lot more efficient than trying to use TFTP across the network. The example in Figure 22.33 shows DNA Center pushing an image to my Cisco switch. Figure 22.33 DNA upgrading devices What’s more, when you schedule an upgrade, DNA Center will go through a bunch of checks to make sure the device is going to support it. Here’s a list of the Device Upgrade Readiness Pre-checks: Time for our comparison: NCMs can push IOS images to Cisco devices too, but they generally don’t have as many sanity checks and safety precautions that DNA Center does. For instance, SolarWinds basically just pushes a copy tftp command to the device to download the firmware, and depending on your script, it’ll also change the boot statement and reboot for you. And of course, SolarWinds doesn’t have direct access to cisco.com to download the firmware for you, so you’ll need to download the file manually and store the file on the server. Doing this manually is fairly labor intensive because not only do you have to download the file, you’ll probably need to set up a TFTP/FTP/SCP server to transfer it. Then you’ll have to manually log into the device to start the upgrade. One of the beautiful benefits of central management is that you can take advantage of the fact that DNA Center can access many devices at once to do get something done. The command runner tool lets you to run a bunch of commands against devices in your inventory and store the results. This comes in handy when you need to quickly verify information across your network devices, like when you want to be sure all your routers can see a new OSPF route! Another pro is that the output can also be exported as a text file in case you want to store it or use it in a document. Configuration commands are not supported though, so you’ll need to use the template feature if you want to push changes to the device. Have a look at Command Runner here in Figure 22.34 Figure 22.34 DNA Command Runner Both DNA Center and NCMs have similar functionality for this feature. Both can push commands to several devices and present the output to you all tied up in a bow. If you aren’t using a solution, though, there you would be, connecting to each device, one at a time and saving the output on a Notepad or a email to send later—ugh! Sadly, blaming the network when it usually isn’t at fault is rampant in this field. A huge amount of your time is going to be spent troubleshooting network issues based on vague, outdated, and incorrect information. Let’s say a manager comes up to you at lunch saying he couldn’t connect to the corporate wireless a few days ago on his laptop but it works fine now. How would you troubleshoot that one? Well, you could check ticketing to find out if there was an outage at the time that could explain the snag. If you don’t have any tickets to rummage through, maybe your team members will remember something, right? Of course, you could also log into the wireless controller or Cisco ISE if you’re using it for wireless security and check there for any logs, but it’s pretty hard to find relevant logs from a few days ago and even harder to correlate them! What about trying to replicate the issue on your laptop? That’d be a tough one unless the issue consistently pops up. You’d be stuck trying to connect at random times in the day in different locations to try to hit the issue. But all that was before you were armed with DNA Center’s Assurance feature… This amazing tool actually gives you access to a time machine! It stores loads of network information for a week—everything from logs, network health issues seen on the network, and connection results—all stored and ready for you. Check out an overview of network health in Figure 22.35 Figure 22.35 DNA Network Health The Assurance feature also correlates issues and provides suggestions on what the cause probably was, even offering troubleshooting tips about the steps you can try. This is so good because it makes it possible to troubleshoot glitches that slipped by your radar since users can just get used to it taking three tries to connect to wireless before it works so they never even mention it! Figure 22.36 gives you a picture of the wireless troubleshooting page. DNA Center’s Assurance feature is unique, and it’s no small thing. NMS solutions can give you a lot of great information, but only DNA Center can carry out full analytics to give us a solid network time capsule snapshot right now. And doing this manually turns you into a gumshoe relentlessly grilling users for information and stuck doing a bunch tests to possibly hit on issues. You may even be reduced to mindlessly fishing through configurations hoping something jumps out at you! Figure 22.36 DNA wireless clients The path a given user’s network traffic takes through the network isn’t always so straightforward today. Back in the day, traceroute was a go-to way to determine the path a user is taking to get to their destination. But it won’t show you that that wireless traffic is going through a CAPWAP tunnel or that a site is connected through a VPN or a DMVPN. Traceroute also won’t reveal the layer 2 switches that the packet must travel through. Path Trace is an evolution of the APIC-EM Path Trace feature that was on the previous CCNA. It takes advantage of the fact that DNA Center knows everything about all the network devices in your network and gives you a visual representation of the path taken from source to destination. The tool reveals the true path tunnels take and shows you if any ACLs on network devices will block your traffic. You can even specify which ports you want to test. Check out Path Trace in action in Figure 22.37. Figure 22.37 DNA Path Trace This is another feature that’s unique to DNA Center and APIC-EM if you happen to have that in your network. Solarwinds has something similar called NetPath, but it works by using agents you deploy throughout your network. DNA Center uses the firsthand information it collects from the network and as said can detect ACL issues. SolarWinds can’t do that. An important point here is that the things Path Trace does can’t really be done manually either. Sure, you can run some utilities like tcptraceroute or hping3 on Linux, but these methods have limitations regarding UDP traffic and they won’t serve up a graphical display of the path traffic takes! Quality of Service can be tough to implement and maintain. DNA Center includes the successor to APIC-EM’s EasyQoS feature, which lets you to simplify your QoS policies by grouping applications into three categories instead:
You can move applications into whichever category works for your network. After all, if you work for YouTube, then YouTube may very well be business relevant! The QoS Policy is shown in Figure 22.38 Figure 22.38 DNA QoS Policy DNA Center will take your Application Policy and convert it into a QoS one that handles all the components for you. All you need is to adjust the DSCP and bandwidth allocations for your connections and you have a consistent QoS policy applied across your network. The Service Provider profiles are pictured in Figure 22.39. Figure 22.39 DNA Service Provider Profiles By the way, this is another feature unique to DNA Center. NCMs can push QoS policies that you create, but they aren’t designed to let you to easily manage your end-to-end QoS policies like DNA Center does. And here again, doing this manually can be majorly complex task that needs to be planned out very carefully. Every network device, including routers, switches, wireless controllers, and even firewalls can all be part of the QoS policy and therefore must be adjusted. Up until now if we wanted to add a new network device to DNA Center, we would’ve had to make sure the device could reach the server. We also needed to have authentication, SSH, and SNMP set up so the server could connect to the new device. LAN Automation eases the pain by allowing new devices to be set up automatically via Cisco Plug and Play (PNP). This feature works by creating a DHCP server on the upstream network device, which then passes an IP address and the PNP server information on to the new Cisco device when it boots. From there, DNA Center automatically sets up basic routing and other things that should go on an underlay device like multicast. Once it’s done, the new device will appear in DNA Center in the proper site. LAN Automation is shown in Figure 22.40. Figure 22.40 DNA LAN automation Here we have yet another feature that’s unique to DNA Center. Because of the deep integration required to make PNP work, other NCMs just can’t compete in this area! To go about this manually, you’d have to manually put the configuration on the router before you ship it to its destination—the risk here being that if there are any configuration errors, a-troubleshooting you’ll go before the device can get online. Software Defined Access is really the flagship feature of DNA Center. Essentially, it lets you to make use of intent networking to state that the Marketing team doesn’t get to access the IT team’s resources—let DNA Center “figure it out.” The actual solution under the hood is extremely complex and uses a plethora of features that are well out of the scope for the CCNA. Even so, DNA Center makes it easy for even a junior to manage a network that would normally require a much more senior team to keep it up and running! Since SD-Access is Cisco proprietary, there’s no way for a NMS or NCM to do something similar. You can manually configure the network features that comprise SD-Access, but you won’t be able to easily manage it with a web interface! We already covered restful API in the previous chapter. Everything in DNA Center can be managed by REST. This makes it really easy to have your scripts contact DNA Center instead of having to individually connect to devices to get information. A neat feature is Code Preview. DNA Center lets you test drive Restful API through the web interface so you can get a feel for the kind of information it will give you. The web interface can even generate Restful API code snippets for you in several languages including Python! Check out the Code Preview feature in Figure 22.41. Figure 22.41 DNA Restful API In this chapter, we covered how to traditionally manage a network using a Network Monitoring System (NMS) and a Network Configuration Manager (NCM). We also talked in a bit of detail about how a router actually sends packets because one of the goals of SDN is to separate the control plane and the data plane so that the intelligence of the network lives in the SDN Controller. You learned about several network architectures that we can see in controller-based networks before I explained what a network fabric is what components it uses. We closed up the chapter by going through some common DNA Center services and how they work, while comparing them with NMS/NCM solutions as well as if you were to tackle the job manually. SDN Architecture Software Defined Networking (SDN) solutions tunnel traffic across the underlay devices using an overlay. The underlay provides connectivity for the tunnels to be able to be formed. The overlay provides the actual services to the fabric. The fabric is simply a term for all network devices that use the SDN solution. Controller-based Architecture Rather than managing your network devices individually, you can use a controller-based solution that allows you to centrally manage everything instead. This improves efficiency since you can configure a large number of devices at once and also reduces the risk of configuration errors because your changes aren’t applied immediately and can be reviewed. It also ensures configuration for all your network devices is consistent. Controllers also provide a great single point to monitor or script against since it knows about most or all of your network fabric. SDN Controllers communicate with the network using a southbound interface towards the devices and a northbound interface to permit access to the SDN Controller. DNA Center DNA Center is the successor to APIC-EM and provides SDN and controller-based features to your network. DNA Center can ensure your configuration is consistent and make sure QoS is working properly and is set up on all devices in the network. The assurance feature provides a unique time machine to view issues that happened up to a week ago. You can find the answers in the Appendix. What’s the Northbound interface used for? (Choose one.)
What’s the network underlay?
What’s an advantage of controller-based network vs. traditional networks? (Choose three.)
What’s the name of an architecture that uses an access layer?
What are some protocols found in the management plane? (Choose three.)
What are some protocols found in the control plane? (Choose three.)
What are some protocols found in the data plane?
Which Southbound protocol is used by OpenDaylight?
Which Southbound protocol is used by ACI?
Which of these are protocols commonly used with the northbound interface? (Choose two.)
What’s the purpose of DNA Center’s EasyQoS feature? (Choose three.)
How long does DNA Center’s Assurance feature store network data in its snapshot?
Which feature does LAN Automation use to configure new switches?
Which protocol does Network Monitoring Systems primarily use to monitor network devices?
Which protocol does Network Configuration Manager primarily use to configure network devices? (Choose three.)
What kinds of switches are found in a CLOS architecture? (Choose two.)
What kinds of switches are found in a Campus architecture? (Choose three.)
What type of switching is done in a network fabric?
What can the Command Runner be used for?
What can the Code Preview feature be used for? (Choose three.)
![]() 1.1.e Controllers (Cisco DNA Center and WLC)
1.1.e Controllers (Cisco DNA Center and WLC)![]() 6.2 Compare traditional networks with controller-based networking
6.2 Compare traditional networks with controller-based networking![]() 6.3 Describe controller-based and software defined architectures (overlay, underlay, and fabric)
6.3 Describe controller-based and software defined architectures (overlay, underlay, and fabric)
![]() 6.4 Compare traditional campus device management with Cisco DNA Center enabled device management
6.4 Compare traditional campus device management with Cisco DNA Center enabled device management Networking itself really hasn’t changed all that much since the days when networks were first being rolled out. Of course it’s true that a modern-day Cisco router has an endless menu of new capabilities, features, and protocols compared to older routers, but we pretty much still configure one by logging into it and making changes manually.
![]() To find your included bonus material, as well as Todd Lammle videos, practice questions & hands-on labs, please see www.lammle.com/ccna
To find your included bonus material, as well as Todd Lammle videos, practice questions & hands-on labs, please see www.lammle.com/ccnaTraditional Network Monitoring Systems (NMS)
Configuring SNMP
C3750X-SW01(config)#snmp-server community testlabRO RO
C3750X-SW01(config)#snmp-server community testlabRW RW
To configure SNMP traps, I'll use the following command to tell the switch where to send the traps. Here's how that looks on my SolarWinds server at 10.20.2.115: C3750X-SW01(config)#snmp-server host 10.20.2.115 traps testlabTRAPS
C3750X-SW01(config)#snmp-server source-interface traps vlan 310
C3750X-SW01(config)#snmp-server enable traps ?
auth-framework    Enable SNMP CISCO-AUTH-FRAMEWORK-MIB traps
bridge            Enable SNMP STP Bridge MIB traps
bulkstat          Enable Data-Collection-MIB Collection notifications
call-home         Enable SNMP CISCO-CALLHOME-MIB traps
cluster           Enable Cluster traps<trimmed for brevity>
C3750X-SW01(config)#snmp-server enable traps
C3750X-SW01(config)#do sh run | in enable trap
snmp-server enable traps snmp authentication linkdown linkup coldstart warmstart
snmp-server enable traps flowmon
snmp-server enable traps transceiver all
snmp-server enable traps call-home message-send-fail server-fail
snmp-server enable traps tty
snmp-server enable traps license
snmp-server enable traps auth-framework sec-violation
snmp-server enable traps cluster

<trimmed for brevity>
Network Health
Central Syslog
CSR31(config)#logging trap debugging
CSR31(config)#logging host 10.20.2.115

Central SNMP Traps

Interface Information

Hardware Health
Network Information

Traditional Network Configuration Managers (NCMs)
CSR31(config)#aaa new-model
CSR31(config)#aaa authentication login default local
CSR31(config)#username ncm secret ncmPass
CSR31(config)#enable sec ncmEnable

Traditional Networking
Management Plane
Control Plane
Data Plane
Forwarding
Introduction to SDN

Northbound Interfaces
Southbound Interfaces
SDN Solutions
Separating the Control Plane
Controller-Based Architectures
Campus Architecture
Spine/Leaf Architecture

SDN Network Components
Underlay
MTU
SW01(config)#system mtu ?

 <1500-9198>  MTU size in bytes

SW01(config)#system mtu 9000
Global Ethernet MTU is set to 9000 bytes.
Note: this is the Ethernet payload size, not the total
Ethernet frame size, which includes the Ethernet
header/trailer and possibly other tags, such as ISL or
802.1q tags.
SW01(config)#do reload
![]() OSPF requires the MTU to match on both ends of the neighbor adjacency to work properly, so when the MTU is changed, it has to be changed on neighboring devices too. To get around this, you can apply the ip ospf mtu-ignore command on neighboring interfaces to fix OSPF without changing the MTU.
OSPF requires the MTU to match on both ends of the neighbor adjacency to work properly, so when the MTU is changed, it has to be changed on neighboring devices too. To get around this, you can apply the ip ospf mtu-ignore command on neighboring interfaces to fix OSPF without changing the MTU.SW01(config)#ip routing
Interface Config
SW01(config)#int g3/0
SW01(config-if)#no switchport
SW01(config-if)#ip address 10.1.21.1 255.255.255.0

SW01(config-if)#ip ospf network point-to-point

SW01(config-if)#int g3/1
SW01(config-if)#no switchport
SW01(config-if)#ip address 10.1.22.1 255.255.255.0
SW01(config-if)#ip ospf network point-to-point

SW01(config-if)#int g3/2
SW01(config-if)#no switchport
SW01(config-if)#ip address 10.1.31.1 255.255.255.0
SW01(config-if)#ip ospf network point-to-point

SW01(config-if)#int g3/3
SW01(config-if)#no switchport
SW01(config-if)#ip address 10.1.32.1 255.255.255.0
SW01(config-if)#ip ospf network point-to-point

SW01(config-if)#int g2/2
SW01(config-if)#no switchport
SW01(config-if)#ip address 10.1.41.1 255.255.255.0
SW01(config-if)#ip ospf network point-to-point


SW01(config-if)#int g2/3
SW01(config-if)#no switchport
SW01(config-if)#ip address 10.1.42.1 255.255.255.0
SW01(config-if)#ip ospf network point-to-point
SW01(config-if)#interface loopback 0
SW01(config-if)#ip add 192.168.255.1 255.255.255.255
OSPF Config
SW01(config-if)#router ospf 1
SW01(config-router)#network 0.0.0.0 0.0.0.0 area 0
SW01(config-router)#exit
Other Underlay Config
Verification
SW01#show ip ospf nei

Neighbor ID     Pri   State           Dead Time   Address         Interface
192.168.255.3     0   FULL/  -        00:00:38    10.1.32.3       GigabitEthernet3/3
192.168.255.3     0   FULL/  -        00:00:37    10.1.31.3       GigabitEthernet3/2
192.168.255.2     0   FULL/  -        00:00:37    10.1.22.2       GigabitEthernet3/1
192.168.255.2     0   FULL/  -        00:00:37    10.1.21.2       GigabitEthernet3/0
192.168.255.4     0   FULL/  -        00:00:34    10.1.42.4       GigabitEthernet2/3
192.168.255.4     0   FULL/  -        00:00:34    10.1.41.4       GigabitEthernet2/2
         192.168.255.0/32 is subnetted, 4 subnets
O        192.168.255.2 [110/2] via 10.1.22.2, 00:11:52, GigabitEthernet3/1
        [110/2] via 10.1.21.2, 00:12:02, GigabitEthernet3/0
O        192.168.255.3 [110/2] via 10.1.32.3, 00:04:32, GigabitEthernet3/3
        [110/2] via 10.1.31.3, 00:04:42, GigabitEthernet3/2
O        192.168.255.4 [110/2] via 10.1.42.4, 00:01:40, GigabitEthernet2/3
                       [110/2] via 10.1.41.4, 00:01:40, GigabitEthernet2/2
Overlay
Fabric
DNA Center Overview

Discovery
Network Hierarchy
Templates
#MODE_ENABLE
clock set Sept 17 2019 00:00:00
#MODE_END_ENABLE
CSR11(config)#crypto key generate rsa general-keys
% You already have RSA keys defined named CSR11.testlab.com.
% Do you really want to replace them? [yes/no]:
#INTERACTIVE
crypto key generate rsa general-keys <IQ>yes/no<R> yes
#ENDS_INTERACTIVE
Topology
Upgrades

Precheck
Description
Device management status
Checks if the device is successfully managed in Cisco DNA Center.
File transfer check
Checks if the device is reachable through SCP and HTTPS.
NTP clock check
Compares device time and Cisco DNA Center time to ensure certificates from DNA Center can be installed on the device.
Flash check
Verifies if there’s enough room on the device for the update. Some devices support the ability to automatically cleanup flash to try to fit the update file in by deleting unused files.
Config register check
Verifies the config registry value, ensuring the switch will boot properly if you forgot to fix the config register after a password recovery.
Crypto RSA check
Checks whether an RSA certificate is installed. This is required for SSH and HTTPs to work.
Crypto TLS check
Checks whether the device supports TLS 1.2.
IP Domain name check
Checks whether the domain name is configured, which is required for SSH and HTTPs to work.
Startup config check
Checks whether the startup configuration exists for the device.
Service Entitlement check
Checks if the device has valid license.
Interface check
Checks the status of the device’s management interface.
CDP neighbors check
Displays information about the connected routers and switches in the network discovered using CDP.
Running Config check
Checks the configuration that’s currently running on the device.
Spanning Tree Summary check
Checks the information about the Spanning Tree Protocol (STP).
AP Summary check
Displays the AP Summary associated with the Cisco Wireless Controllers devices.
Command Runner
Assurance
Path Trace
EasyQoS


LAN Automation
SD-Access
Restful API
Summary
Exam Essentials
Review Questions