
8
Monitoring and Logging Kubernetes Clusters and Applications
This chapter describes how to monitor Kubernetes cluster components and applications and get infrastructure-level, system-level, and application-level logs to serve as a source for log analytics or further troubleshooting. Together with the next two chapters about troubleshooting cluster components and applications and troubleshooting Kubernetes security and networking, it covers 30% of the CKA exam content.
In this chapter, we’re going to cover the following topics:
- Monitoring on a cluster node
- Monitoring applications on a Kubernetes cluster
- Managing logs at the cluster node and pod levels
- Managing container stdout and stderr logs
Technical requirements
To get started, you need to make sure your local machine meets the following technical requirements:
- A compatible Linux host. We recommend a Debian-based Linux distribution such as Ubuntu 18.04 or later.
- Make sure your host machine has at least 2 GB of RAM, 2 CPU cores, and about 20 GB of free disk space.
Monitoring on a cluster node
Monitoring is essential for Kubernetes administrators when it comes to getting a clear understanding of what’s going on in your Kubernetes cluster. You need to know all of the different metrics to help you get on track in terms of the health of your Kubernetes cluster components. You also need to make sure that your components are operating as expected and that all workloads that are deployed on your worker nodes are functional and have enough resources, such as CPU, memory, and storage. Moreover, you should also check whether any worker nodes are available and have sufficient resources to scale or schedule more workloads.
In Kubernetes, Metrics Server collects CPU/memory metrics and to some extent adjusts the resources needed by containers automatically. Metrics Server collects those metrics every 15 seconds from the kubelet agent and then exposes them in the API server of the Kubernetes master via the Metrics API. This process is described in the following figure:
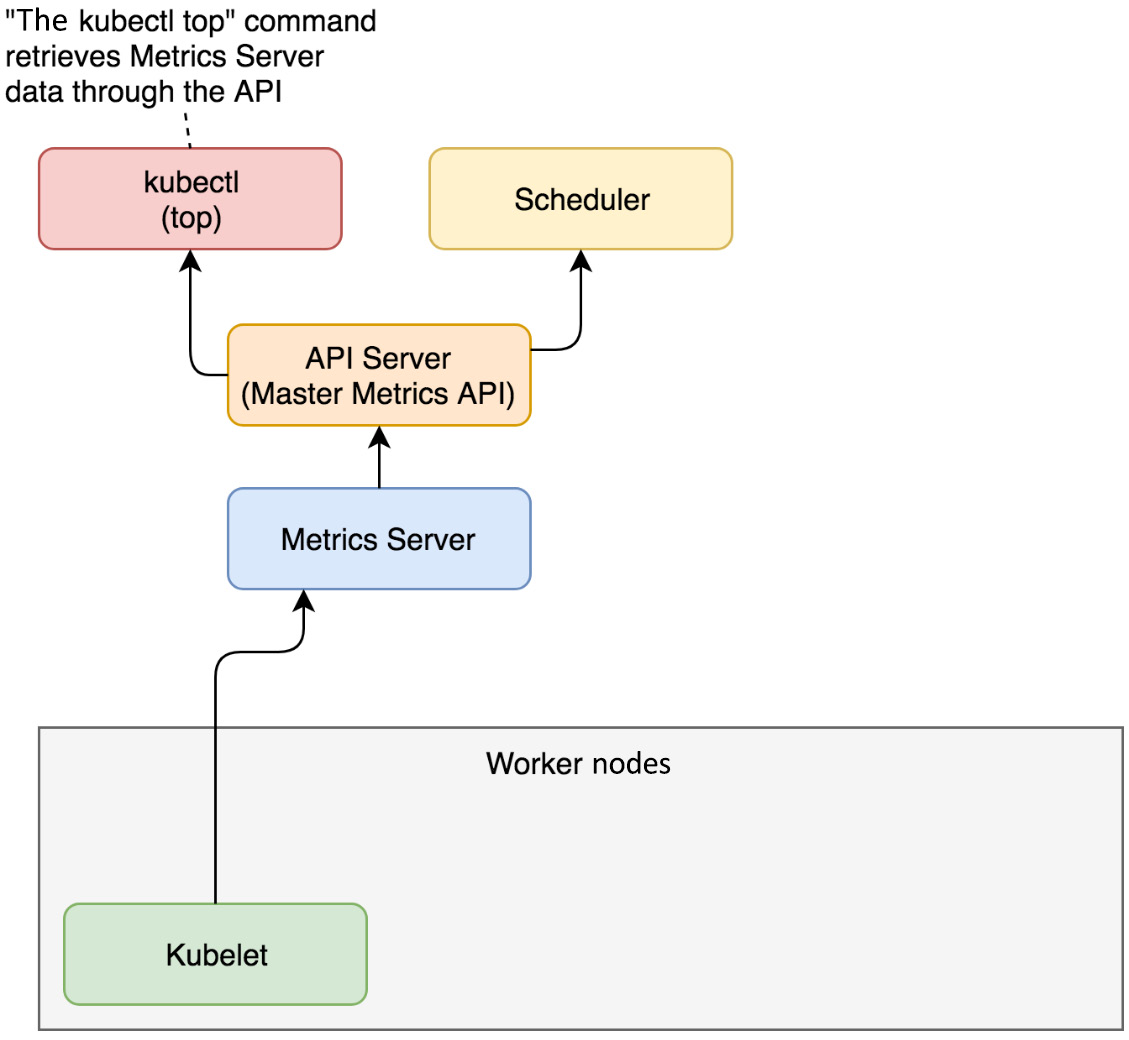
Figure 8.1 – How Metrics Server works in a Kubernetes cluster
Users can use the kubectl top command to access metrics collected by Metrics Server. At the time of writing this chapter, Metrics Server supports scaling up to 5,000 Kubernetes worker nodes, which is the maximum number of nodes that Kubernetes currently supports (Kubernetes v1.24 supports clusters with up to 5,000 nodes). For more details about large Kubernetes clusters, check out this official article: https://kubernetes.io/docs/setup/best-practices/cluster-large/.
Checking whether Metrics Server is installed
From your Kubernetes cluster, you can take the following steps to check whether you have Metrics Server available in your current cluster. You can start by setting up an alias for kubectl using the alias k=kubectl command and then use the k get command, as follows, to check out the worker nodes that are currently available:
alias k=kubectl
k get nodes
The preceding command will show the available worker nodes of your current cluster. The output is similar to the following:
NAME STATUS ROLES AGE VERSION
minikube Ready control-plane,master 5d v1.23.3
You can use the k top node command to check the metrics for the worker node called minikube, as follows:
k top node minikube
The output of the preceding command will show the resource usage of the minikube node if you have Metrics Server installed. Alternatively, you will see the following, which only appears when Metrics Server is not available in your current Kubernetes cluster, which means you need to install Metrics Server:
error: Metrics API not available
Alternatively, you can use the following command directly to see whether there will be any output:
kubectl get pods -n kube-system | grep metrics-server
The CKA exam will usually have Metrics Server pre-installed, so you could jump to step 3 to check out the use cases for the kubectl top command.
Installing Metrics Server in your current Kubernetes cluster
If you’re on a vanilla Kubernetes cluster, you can install Metrics Server by deploying a YAML definition or through Helm charts; the latter will require Helm to be installed. To get the latest release and instructions, you can go to their GitHub repo: https://github.com/kubernetes-sigs/metrics-server.
Using a YAML manifest file
You can use the kubectl apply -f command to deploy Metrics Server using the official YAML manifest file as follows:
kubectl apply -f https://github.com/kubernetes-sigs/metrics-server/releases/latest/download/components.yaml
Starting from the end of February 2022, there’s also a high-availability (HA) version that bumps up the replica count from one to two for Metrics Server. If you’re on a cluster with at least two nodes, you can use the following file:
kubectl apply -f https://github.com/kubernetes-sigs/metrics-server/releases/latest/download/high-availability.yaml
You can get more information about Metrics Server here: https://github.com/kubernetes-sigs/metrics-server/releases
Using Helm charts
To install Metrics Server using Helm charts, you can go to Artifact Hub and then find the Metrics Server Helm charts at https://artifacthub.io/packages/helm/metrics-server/metrics-server
Since Helm 3 is widely used nowadays, you will need to add the Metrics Server Helm charts repo to Helm:
helm repo add metrics-server https://kubernetes-sigs.github.io/metrics-server/
It will show the following to confirm that the repo has been added successfully:
"metrics-server" has been added to your repositoriesAfter adding the repo, you can install the Helm charts through the following command:
helm upgrade --install metrics-server metrics-server/metrics-server
The output of the preceding command will show you whether it’s been installed successfully.
Using minikube add-ons
If you’re using a minikube cluster, Metrics Server comes in the form of a built-in add-on that can be enabled and disabled via the minikube addons command. You can use the following to list the currently supported add-ons:
The output is similar to what is shown in the following screenshot:
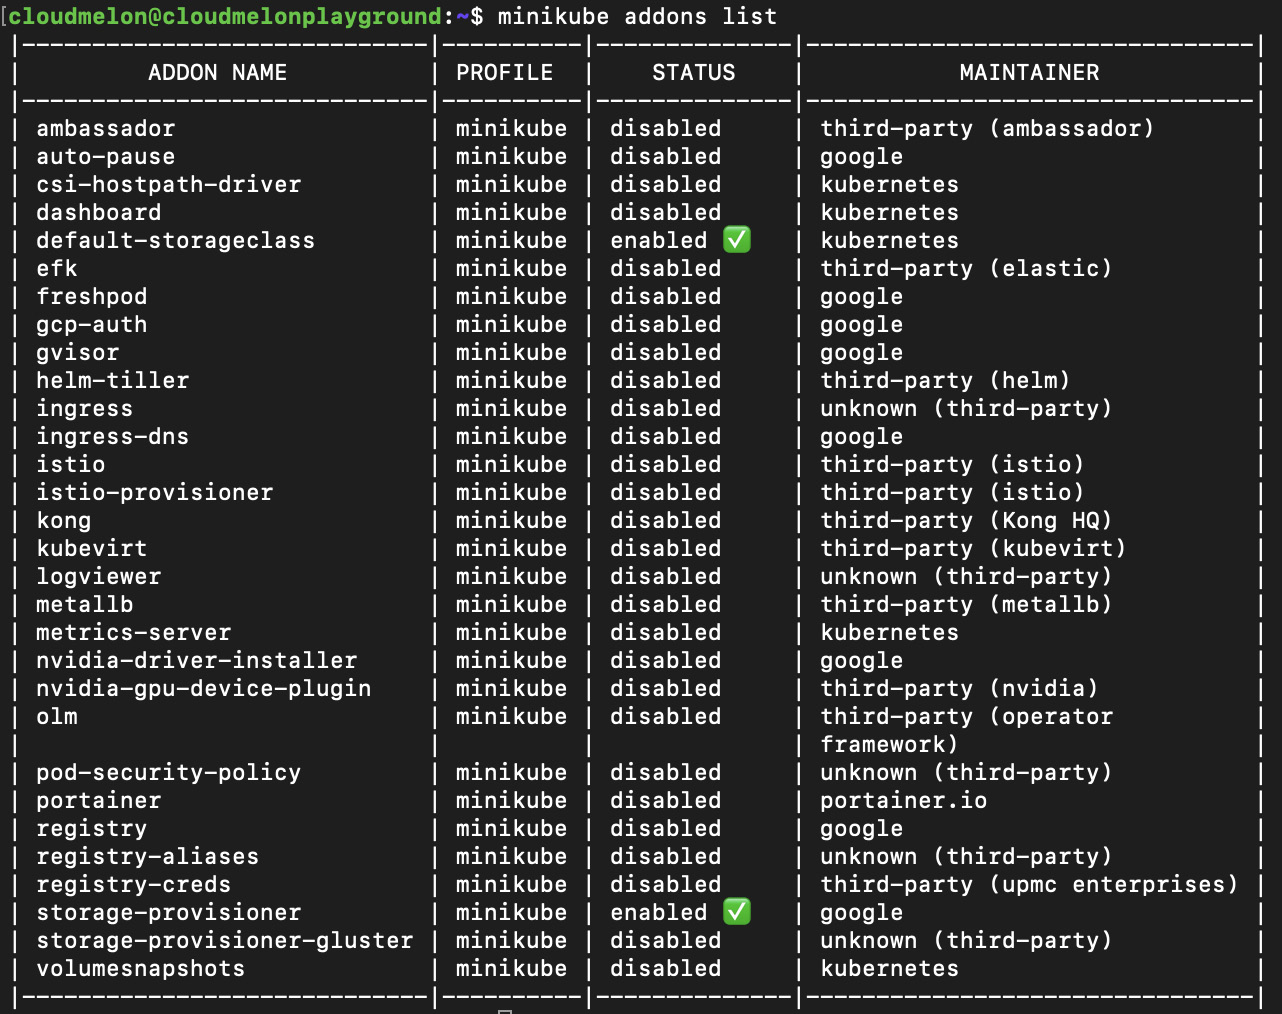
Figure 8.2 – minikube add-ons list
From the preceding screenshot, we can see the metrics-server add-on is disabled. You canalso use the following command to get a clearer view:
minikube addons list | grep metrics-server
The following output shows that currently, the minikube add-on is disabled:
| metrics-server | minikube | disabled | kubernetes
You can use the minikube addon enable command to enable Metrics Server:
minikube addons enable metrics-server
The following output shows that the Metrics Server add-on was successfully enabled:
▪ Using image k8s.gcr.io/metrics-server/metrics-server:v0.4.2
? The 'metrics-server' addon is enabled
Now if you use the kubectl get command, you’ll see that the Pods and Services related to Metrics Server are up and running in the kube-system namespace:
kubectl get pod,svc -n kube-system
The output should look like the following:
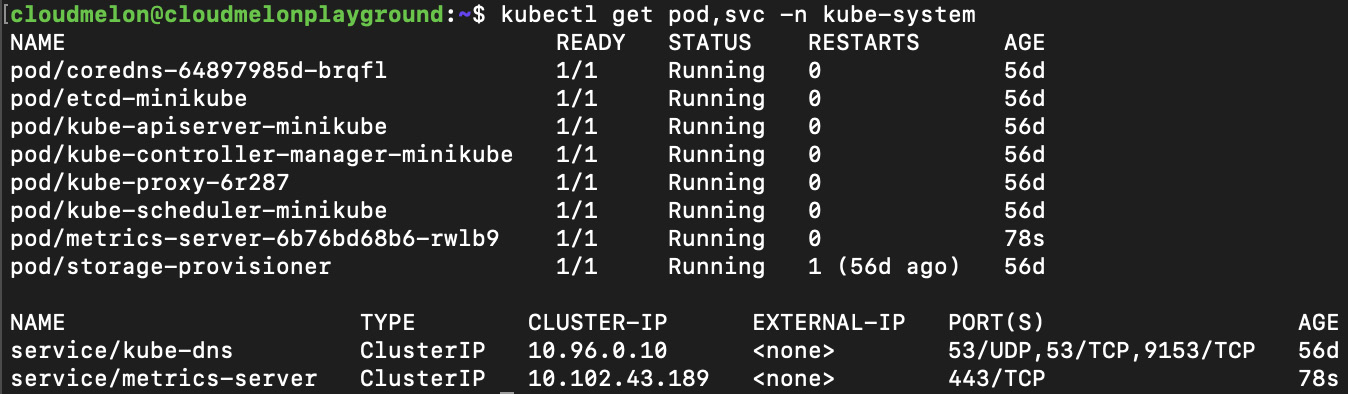
Figure 8.3 – Metrics Server Pods and Services in the kube-system namespace
Another command you can use is the following:
kubectl get pods -n kube-system | grep metrics-server
The output should look like the following:
metrics-server-6b76bd68b6-rwlb9 1/1 Running 0 17h
As you can see from the output, the Metrics Server pod is up and running, which means you can now use the kubectl top command. Let’s now take a look at what it does.
Checking out CPU/memory metrics
You can use the kubectl top command to top the worker node that you want to get metrics details from. The following is an example where we top a worker node called minikube:
k top node minikube
The output is as follows, where we can see the number of CPU cores and the amount of memory used:
NAME CPU(cores) CPU% MEMORY(bytes) MEMORY%
minikube 232m 11% 961Mi 24%
This also applies to the use case where your Kubernetes cluster has multiple worker nodes. Using the kubectl top node <node name> command will help you see the resource usage of that specific node.
Monitoring applications on a Kubernetes cluster
A standard end-to-end monitoring solution covers infrastructure monitoring and application monitoring. In Kubernetes, Metrics Server is not only used to monitor the Kubernetes worker nodes but also Kubernetes Pods and containers.
We can test out application monitoring by deploying a new pod in the default namespace as follows:
kubectl run nginx --image=nginx
After executing the preceding command, make sure that your nginx pod is up and running before going to the next section. To check out the status of the pod, you can use the kubectl get pod nginx command.
Monitoring the resource usage of an application
You can use the kubectl top pod <podname> command to check out the metrics collected for that pod, including the resource consumption of the pod:
kubectl top pod nginx
The output should look as follows, where you can see the CPU and memory usage of the pod:
NAME CPU(cores) MEMORY(bytes)
nginx 0m 9Mi
In our case, we deployed a single-container pod, but it’s important to know that we could also check out the CPU and memory usage for a multi-container pod by using the following command:
k top pod < pod name > --containers
Let’s use the same kubectl top command to show the metrics for the nginx pod and all its containers:
k top pod nginx --containers
The output should look like the following as it’s a single-container pod:
POD NAME CPU(cores) MEMORY(bytes)
nginx nginx 0m 9Mi
If there are multiple containers, it will list the name of the containers in that pod and show their CPU and memory usage respectively.
With that in mind, we could use kubectl top pod, adding the -A flag or –all-namespaces, to show all the metrics of all the Pods across different namespaces. The following command is used in this case:
k top pod -A
Alternatively, you can also use the full flag as follows:
k top pod --all-namespaces
The output should look like the following, where you have all the Pods listed along with their CPU and memory usage respectively:
NAMESPACE NAME CPU(cores) MEMORY(bytes)default nginx 0m 9Mikube-system kube-proxy-64jzv 1m 32Mikube-system kube-proxy-hplp5 1m 28Mikube-system kube-proxy-kvb96 2m 31Mikube-system kube-proxy-kvjwh 1m 28Mikube-system kube-proxy-rmw2r 1m 31Mikube-system kube-proxy-tcz5m 1m 26Mikube-system metrics-server-6576d9ccf8-z8mlg 6m 37MThere’s a good chance that the CKA exam will ask you what pod consumes the most compute resources in a list of pods, or any other task of this nature – that’s where the –sort-by flag comes into play. The --sort-by flag accepts either cpu or memory as a value, and as a result it will return the result asc or desc. The command looks as in the following examples:
kubectl top pod --sort-by=cpu
kubectl top pod –-sort-by=memory
It makes more sense when we have a large list of pods and you have requested to sort them by the memory or CPU resources consumed, from most to least. We can use the following command to do this:
kubectl top pod -A --sort-by=memory
The output should look as follows, with all the pods across all the namespaces in your current Kubernetes cluster listed according to resource usage:
kube-system metrics-server-6576d9ccf8-z8mlg 7m 37Mikube-system kube-proxy-64jzv 1m 32Mikube-system kube-proxy-rmw2r 1m 31Mikube-system kube-proxy-kvb96 1m 31Mikube-system kube-proxy-kvjwh 1m 28Mikube-system kube-proxy-hplp5 1m 28Mikube-system kube-proxy-tcz5m 1m 25Midefault nginx 0m 9MiThis command works in a similar way when using –sort-by cpu flag. The output lists the pods in the order of most CPU consumed to least.
Checking application details
You can use the kubectl describe pod <podname> command to find out status information regarding the allocated CPUs and memory usage and some other information, such as runtime versions, system information, capacity, labels, and annotations:
kubectl describe pod nginx
The output should look like the following:

Figure 8.4 – kubectl describe pod nginx
Note that there’s an Events section at the bottom of the preceding screenshot that shows a log of recent events related to this pod. We’ll take a closer look at the Events section:

Figure 8.5 – Events of the nginx pod
The events here include a series of events in Kubernetes, such as these:
- The pod gets scheduled to the worker node called minikube.
- The container image is pulled from the container registry.
- The kubelet agent provisions the pod containing an nginx container.
- Kubelet starts the pod and the nginx container starts to accept traffic.
Analyzing those events helps us to understand what’s going on during the pod provisioning process, and it could give us clues as to whether any exceptions happened and why, allowing us to come up with potential solutions. We’ll take a closer look at the events in the next section of this chapter.
If a pod is in a namespace other than the default namespace, you can specify the -n flag in the kubectl describe command to add the namespace. The following is an example using this command to describe a pod named coredns-64897985d-brqfl in the kube-system namespace:
kubectl describe pod coredns-64897985d-brqfl -n kube-system
The output should look like the following:
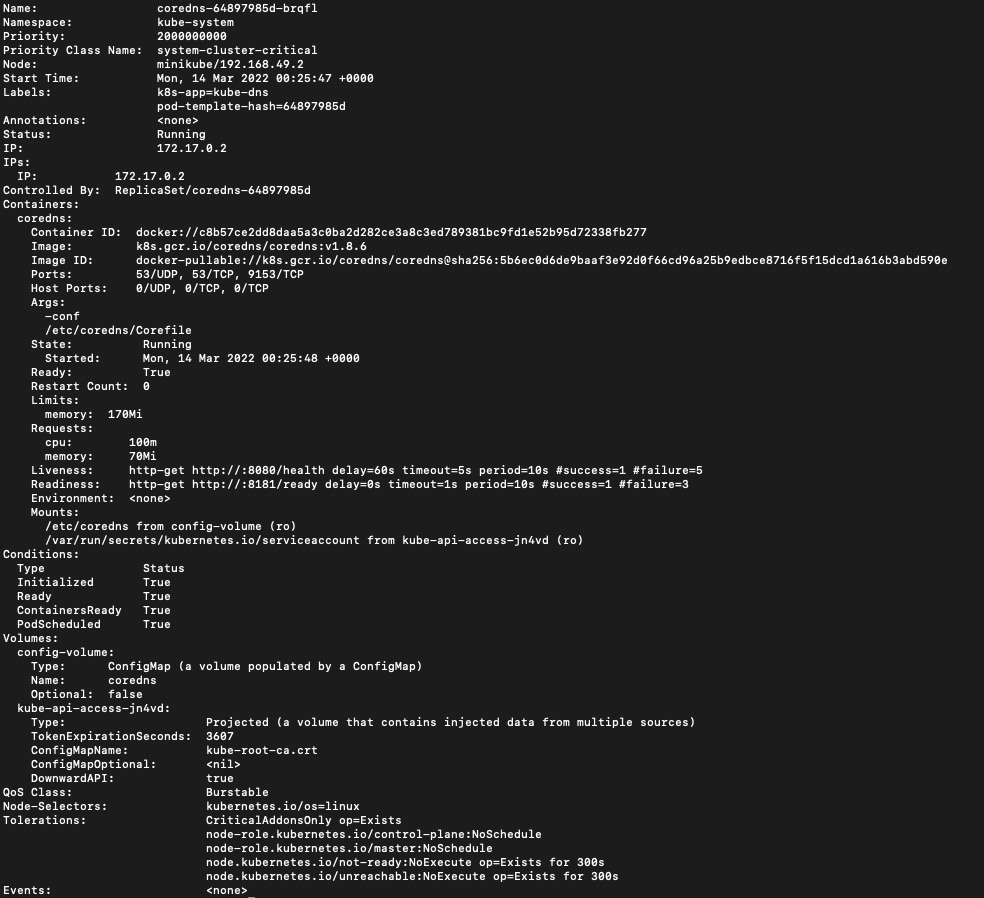
Figure 8.6 – kubectl describe coredns pod in the kube-system namespace
Even though the preceding screenshots contain similar chunks of information, the details differ from pod to pod. You could add > mypod.yaml to the end of the command to export the pod information for further analysis:
kubectl describe pod nginx > mypod.yaml
You will get a YAML file called mypod.yaml containing critical pod information.
Monitoring cluster events
We can get Kubernetes events by using the following command:
kubectl get events
We can get events logged in the current cluster, which includes events logged previously in the Events section, when we use the kubectl describe pod command. The following is a sample output after running the kubectl get events command:

Figure 8.7 – kubectl get events
You can use the following command to list the events sorted by timestamp:
kubectl get events --sort-by=.metadata.creationTimestamp
If you want to collect the events during a deployment, you can run the following command on the side:
kubectl get events --watch
The commands will give you a good idea of what’s going on during the deployment process if you’re not using Kubernetes Dashboard or any third-party monitoring frameworks such as Prometheus with Grafana Dashboard. Knowing about what happens at the application level by monitoring sometimes comes in handy, especially when it comes to troubleshooting. Often we get a better understanding by analyzing logs and tracking exceptions. Let’s take a look at how to manage logs at the cluster node and pod levels.
Managing logs at the cluster node and Pod levels
Logs are very handy when it comes to troubleshooting issues. The information collected in a log is usually helpful in understanding what has happened, figuring out why certain issues happened, and finding remediations to prevent them from happening again later on.
Cluster-level logging
In Kubernetes, the notion of cluster-level logging is widely recognized. This means logs are meant to be stored in a separate backend, so the lifecycles of those logs are independent of what’s been logged down to the worker node, pod, or even container level.
Kubernetes itself does not provide a comprehensive native logging framework, but it can be integrated with lots of third-party open source logging solutions in the community, such as Grafana Loki or the EFK stack, which includes Elasticsearch, Fluentd, and Kibana for log searching, querying, and tracing.
Logging in Kubernetes involves a set of patterns that are implemented by the community with different open source solutions. There are the following three patterns:
- Using a node-level logging agent that runs on every node: The agent is often in a DaemonSet so it will be evenly distributed on each node, and this agent pushes the logs to a backend. In this case, there are no code changes for the application.
- Using a dedicated sidecar container to log information from the application in the same Pod: This case can be in conjunction with a logging agent running on the node or streaming the logs out, and it is usually recommended to write log entries with the same formats to the same log stream for convenient processing.
- Directly streaming the logs from the application to an external backend: This can work with external object storage, as such storage supports lifecycle policies, which allows the setup of data retention policies and the archiving of old logs based on the policy. Most object storage also works with a search framework, where logs are indexed and so are easy to search and query.
To learn more about the Kubernetes logging architecture, check this article out: https://kubernetes.io/docs/concepts/cluster-administration/logging/
Checking out the node details
With native Kubernetes, you can use the kubectl describe node <nodename> command to find out the status information regarding the allocated CPUs and memory usage as well as some other information, such as runtime versions, system information, capacity, labels, and annotations. We can use the following command to describe a worker node named minikube:
kubectl describe node minikube
The output is similar to the following:
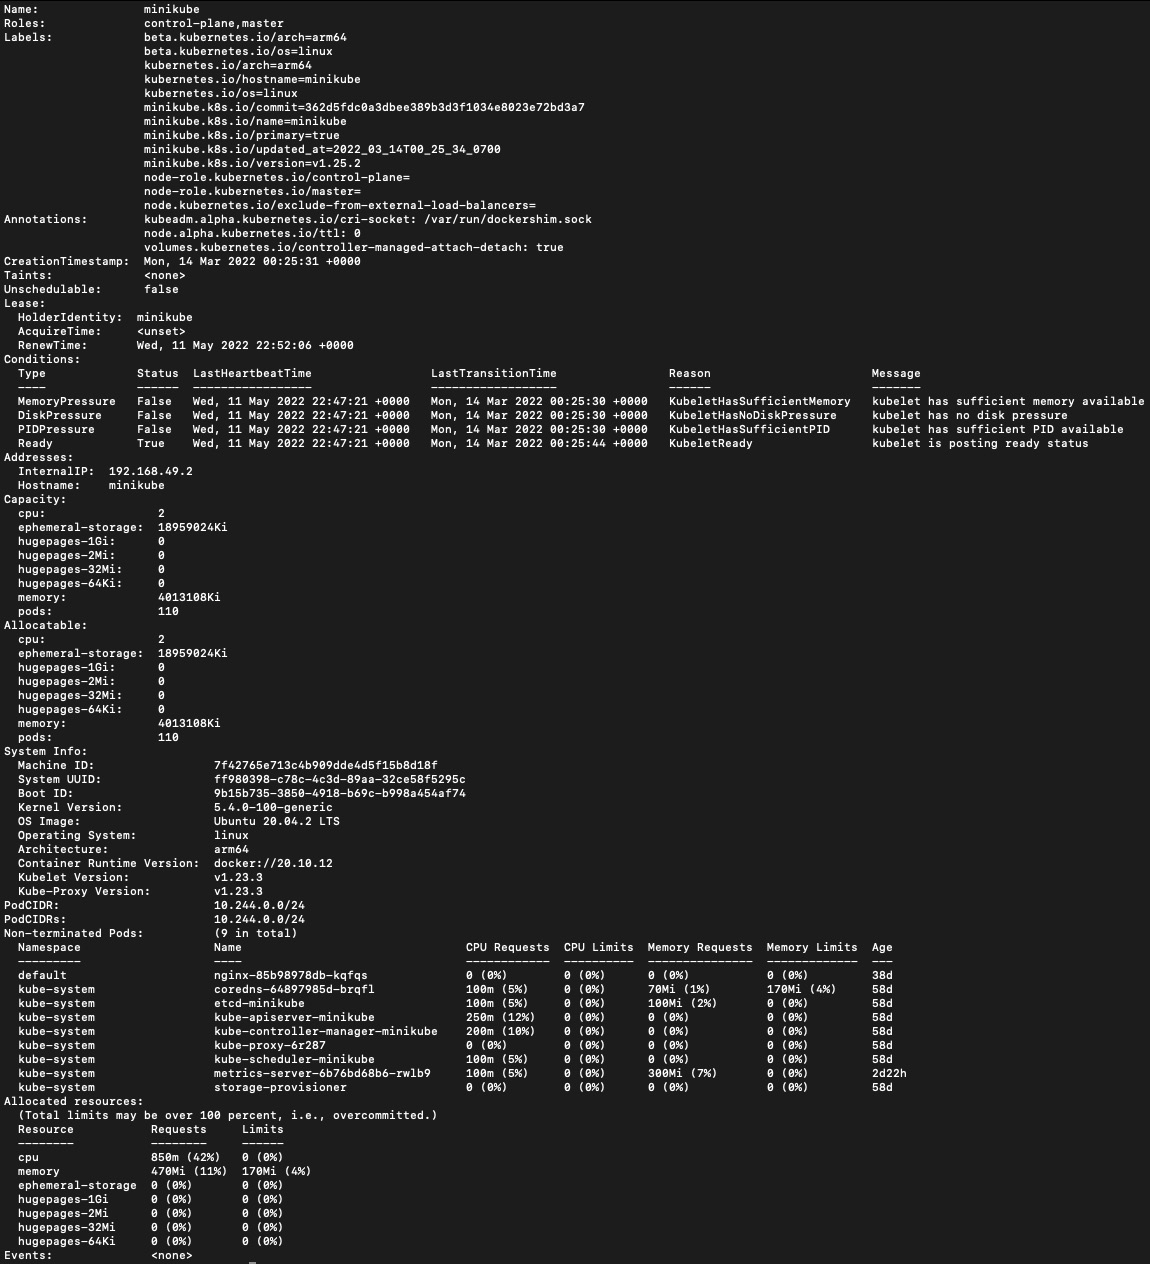
Figure 8.8 – kubectl describe node minikube
Gettting to know the node specification will give you an understanding of how your node was previously configured. Let’s now take a look at how to get some quick but handy information using the kubectl describe node command.
Checking the node status
With the kubectl describe command, we get some general information about a node. Notice that it also contains an events section that usually logs node events. To get more status information from a node, we usually use the following command, taking a node named minikube as an example:
kubectl get node minikube -o wide
The output is similar to the following:

Figure 8.9 – kubectl get node output
From the preceding screenshot, if you compare the kubectl get node command with the one with the -o wide flag, you’ll see that it gives extra information about the image and kernel version as well as the container runtime, which is quite handy when we need to get information quickly.
Managing container stdout and stderr logs
In the Unix and Linux OSs, there are three I/O streams, called STDIN, STDOUT, and STDERR. Here, we’ll talk about STDOUT and STERR in Linux containers, which are typically what the kubectl logs command shows to us.
STDOUT is usually a command’s normal output, and STDERR is typically used to output error messages. Kubernetes uses the kubectl logs <podname> command to log STDOUT and STDERR. It looks like the following when we use the command to log the nginx pod that we deployed in this chapter:
kubectl logs nginx
The output should look like the following:
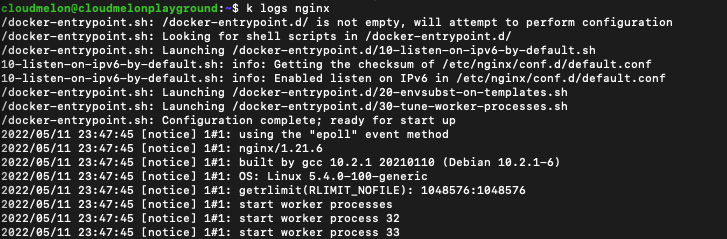
Figure 8.10 – kubectl logs nginx pod
Now, we’ll use a container to write text to the standard output stream with a frequency of once per second. We can do this by deploying a new pod. The following is an example of a YAML manifest for this pod:
apiVersion: v1kind: Podmetadata: name: loggerspec: containers: - name: packs image: busybox:1.28 args: [/bin/sh, -c, 'i=0; while true; do echo "$i: $(date)"; i=$((i+1)); sleep 1; done']You can use the kubectl logs command to retrieve the logs from the logger Pod as follows:
k logs logger
The log would look as follows:
0: Thu May 12 04:34:40 UTC 20221: Thu May 12 04:34:41 UTC 20222: Thu May 12 04:34:42 UTC 20223: Thu May 12 04:34:43 UTC 2022We can get into the pod to retrieve the specific container log by using the -c flag. Let’s check out the log for a container called packt in the logger pod using the following command:
k logs logger -c packt
The following output is the logs retrieved from the packt container:
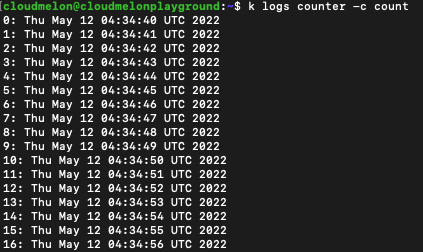
Figure 8.11 – Logs from the packt container
If you want to stream the logs, you can use the kubectl logs -f command, as follows:
kubectl logs -f logger
You should be able to see an output like the following:

Figure 8.12 – kubectl logs for the nginx pod
Use the following command if you want to return logs newer than a certain duration, such as within 1 hour:
kubectl logs --since=1h
You can modify the value after the –since flag as per your requirements.
Summary
This chapter covered monitoring and logging for Kubernetes on three levels – cluster, node, and pod. This chapter laid the groundwork for the next two chapters, where we will focus on troubleshooting cluster components and application failures, as well as exploring some other challenges around Kubernetes security restrictions and container networking by providing more specific troubleshooting use cases and end-to-end troubleshooting scenarios. Stay tuned!
Mock CKA scenario-based practice test
You have two virtual machines, master-0 and worker-0: please complete the following mock scenarios.
Scenario 1
List all the available Pods in your current cluster, identify the ones with the highest CPU consumption, and write their names to a max-cpu.txt file.
You can find all the scenario resolutions in Appendix - Mock CKA scenario-based practice test resolutions of this book.
FAQs
- Where can I find out about the latest updates on Kubernetes Metrics Server?
Kubernetes Metrics Server has a GitHub repository at https://github.com/kubernetes-sigs/metrics-server.
- Where can I find the latest information on Kubernetes cluster logging architecture?
Go to the official Kubernetes documentation at https://kubernetes.io/docs/concepts/cluster-administration/logging/.
- Where can I find the metrics for Kubernetes system components?
You can bookmark this page to get more information: https://kubernetes.io/docs/concepts/cluster-administration/system-metrics/.