
In this chapter, we will look at clustering algorithms or, as I like to call them, K-algorithms. Specifically, I’m referring to the K-nearest neighbor algorithm and the K-means algorithm. These algorithms are finding extensive use in classification systems and machine learning systems. These algorithms can become complex and mathematical. However, what we will do is look at the principles of these algorithms without the mathematical details of their implementation and simply use the concepts behind the mathematics to explain them.
K-Means Algorithm
The K-means algorithm is an important algorithm that is popular today because of an increased interest in artificial intelligence and machine learning. It is an algorithm that is used in something called graph clustering
. Graph clustering uses certain properties of the structure of data, for example, heterogeneity, to classify the data. This act of classifying the data based on groups of elements is also called clustering
.
To use the clustered data, algorithms that perform something known as cluster analysis
are applied to the data elements. What happens in cluster analysis is that data is grouped based on element descriptions and on the relationships between objects. Essentially, the points within a cluster have different properties.
To understand the K-means algorithm, we must understand the ways in which we classify types of data clusters. There are two types of data clusters that we must concern ourselves with: hierarchical clustering and partitioning clustering.
Figure 9-1 shows an example of hierarchical clustering, and we can imagine each point in the form of a circle labeled with a letter to be a data element. In practice, most hierarchical diagrams are usually more complex; however, this diagram will suffice for our purposes.
Figure 9-1.
Hierarchical clustering
In this diagram, each of the labeled circles is grouped next to each other because they are similar nodes. The nodes within a hierarchical cluster show the relationships between similar sets of data.
Without delving too much into the mathematical operation of hierarchical clustering, all you need to be aware of is that in hierarchical clustering, clusters of data that are close are identified and merged together, and the result is called a dendrogram
.
Figure 9-2 shows an example of a simple dendrogram that can be used to represent our hierarchical clustering diagram.
Figure 9-2.
Simple dendrogram to represent our cluster
Partitional clustering is the other type of clustering that you will need to know about; if we look at Figure 9-3, you will see what this type of clustering looks like. This is the type of clustering that the K-means algorithm concerns itself with.
Figure 9-3.
Partitional clustering
In the K-means algorithm, within the partitional cluster, there is a center point called the centroid
that gets points assigned to form a cluster around the closest centroid. Within the programming language (or pseudocode), you must specify the number of clusters designated as “K” that the algorithm will work with. This is the “K” part of the algorithm.
The algorithm usually chooses the centroid randomly, and the close points that are chosen usually take place based on some mathematical property called the Euclidean distance
.
We can now run through the algorithm step-by-step to get an idea of how it functions. Let’s imagine we set the K value as 2 (K = 2), and we have data points on a graph as in Figure 9-4. On this graph we have two centroids; one centroid is the triangle, and the other is the square.
Figure 9-4.
Hierarchical clustering
The K-means algorithm will try to determine which data point is closer to the triangle centroid and which data point is closer to the square centroid. The algorithm will determine this with the Euclidian distance by drawing a line on the graph. Everything on the left of the line will be closer to the square centroid, and everything to the right of the line will be closer to the triangle centroid. This is depicted in Figure 9-5.
Figure 9-5.
Using Euclidean distance
After the data point is assigned to a centroid, the centroid values are usually recomputed based on the data values of the associated data elements, and the average is taken. After the average is found, the centroid is repositioned as in Figure 9-6. This is where the “means” part of the algorithm comes from because to take the mean is to find the average.
Figure 9-6.
Recomputed centroid
This process keeps iterating until no point must move closer to any centroid and the algorithm stops running.
The K-means algorithm finds uses in unsupervised machine learning applications as well as classification applications. In the next section, we will look at the K-nearest neighbor algorithm, which is the other K-algorithm we will discuss in this book.
K-Nearest Neighbor
In the previous section, we looked at the K-means algorithm, so in this section we will look at the K-nearest neighbor (KNN) algorithm, which is a powerful tool in modern computer science applications, particularly machine learning
.
The K-nearest neighbor algorithm can get mathematically intensive, so it is best to explain the algorithm with an example. Since the KNN algorithm excels at classification, let’s look at a classification example for the algorithm.
Let’s imagine we have a classification system that classifies shapes into circles or squares. Now, put these shape data points on a graph and see where they fall according to the shape, as in Figure 9-7.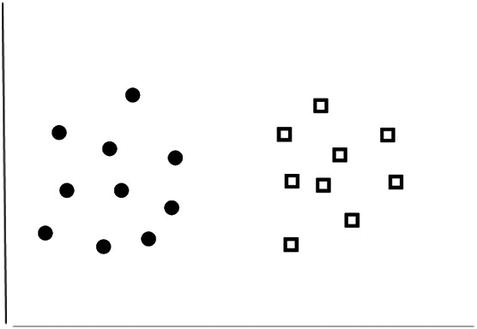
Figure 9-7.
Shape classification
Let’s say we put a new shape into the mix, like an octagon
, as in Figure 9-8.
Figure 9-8.
Octagon introduction
Since the octagon is a new shape, how can we determine whether it is a square or a circle? Let’s say we set the K value to 5. Within the K-nearest neighbor algorithm, the K values determine the number of nearest neighbors to consider in the classification process.
With a value of K=5, the shape will be assigned based on the number of neighbors it is closest in value to, as in Figure 9-9.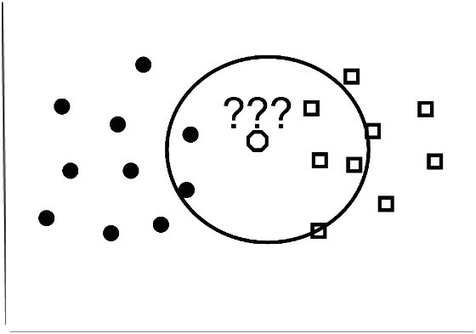
Figure 9-9.
Classification
Since the classification process with K=5 determines that the octagon has three square neighbors and two circle neighbors, the octagon will thus be classified as a square since three out of five of the neighbors are square. This is how the KNN algorithm performs classification.
Machine Learning
After our look at the K-algorithms, you may be curious about machine learning. Machine learning is a branch of computer science that ties back into the foundations of the subject from mathematics. This is because machine learning uses statistics to perform its operations.
In its present form, machine learning
uses computers as tools that employ statistical methods to analyze data and make intelligible decisions and predictions. To do this machine learning, systems essentially gather a lot of data and convert it into the information that we desire. A machine learning system will take data and analyze it to use it to train machine learning algorithms that will then be used to solve some problems.
Knowing this, we can say that machine learning systems essentially use artificial intelligence to learn from data by being trained with it. It is important to note that artificial intelligence (AI) and machine learning are not the same thing. AI refers to computing systems that can perform intelligent tasks, whereas machine learning systems can learn how to do tasks on their own with limited or no supervision.
When a machine learning system learns from a labeled input to the system, called a dataset
(the training data), this is known as supervised learning. In a supervised learning system, it is expected that the machine learning algorithm will produce a specific answer such as in the classification problem we explored earlier in the KNN section.
When the dataset is not labeled and there is no specific outcome expected from the algorithm, we call this unsupervised learning
. While this may seem like a waste of time, unsupervised learning allows us to explore patterns in data we did not consider previously or may not have been aware of.
There is also reinforcement learning
, where learning is done with feedback to increase performance over time using feedback from previous attempts at performing a task.
Neural Networks
A powerful tool to hit the realm of machine learning is the use of neural networks. A neural network
is a network of neurons that exist in biological systems. Neurons within biological organisms communicate with each other and are the basic working unit of the brain.
In an effort to increase the abilities of artificial intelligent systems, the artificial neural network (ANN) was devised to mimic the brains of biological organisms. These ANNs are networked to solve problems and, similar to biological brains, have the neurons within the neural network arranged in layers.
Each neuron within the network is connected to every other neuron in the preceding and subsequent layer. The neurons within the layers are called nodes or units
. Figure 9-8 shows us what an ANN may look like.
An ANN typically is comprised of an input layer, one or more hidden layers, and an output layer. The input layer takes in information and introduces it into the network but performs no computation; its primary function is data transfer
.
The hidden layer is where the calculations take place. Within the hidden layer of the neural network, computations are performed, and these nodes serve as a bridge from the input layer to the output layer.
Within the output layer, computations may also take place, and these nodes transfer data from within the neural network back into the outside world.
This structure of a neural network shown in Figure 9-10 is known as a feed-forward neural network based on the flow of data within the network. These feed-forward networks
may be called a single-layer perceptron
if there is no hidden layer or a multilayer perception
if there is one or more hidden layers.
Figure 9-10.
An example artificial neural network
Neural networks
form the basis of many modern clustering and classification systems and drive artificial intelligence.
Deep Learning
While on its own machine learning
is powerful and can be used to perform many analytical and predictive tasks, when it is combined with neural networks, we see the emergence of an even more powerful system.
Deep learning systems are machine learning systems that utilize neural networks to perform machine learning. This allows for a nonlinear learning process as the neural networks are arranged in a hierarchical manner.
Deep learning systems are accurate and allow artificially intelligent systems to sometimes exceed human performance. These systems utilize a lot of data and powerful computing platforms to achieve their results. These deep learning systems have a large depth of layers through which data must pass, which is to say they have more than one hidden layer.
There are many applications of deep learning
in everyday life. Voice recognition systems, self-driving vehicles, and medical research are just a few examples.
Conclusion
In this chapter, we looked at two of the K-algorithms: K-nearest neighbor and K-means. We also briefly delved into machine learning and neural networks.
With the completion of this chapter, we have covered the core algorithms you will meet as a developer or student. These algorithms will serve you well for the lifetime of your computer science career. In the next chapter, we will look at a topic that isn’t part of DSA per se but is a subject that I think belongs in a DSA book as it will help your understanding of some aspects of DSA. We will look at the concept of randomness.