CHAPTER 4
SPEAKER SYSTEMS
Several different types of speaker systems are in use, each with its own characteristics that must be taken into consideration during flying and stacking. Environment dictates how the speakers should be used to obtain the best results. Sometimes it may be necessary to get as much power from the speakers as possible by taking advantage of acoustic coupling. Other situations may require maximum dispersion of the cabinets. A cabinet's dispersion characteristics are normally governed by the dispersion characteristics of the mid- and high-frequency bands because the lower frequencies are omnidirectional.
TYPES OF SPEAKERS 
A multitude of speaker cabinets are designed for all types of sound reinforcement. The most common types of cabinets for concert sound reinforcement are three-way active cabinets. Each cabinet is divided into three distinct parts that are driven by different signals, as follows:
1. Low band. The low band of the cabinet is for the lower frequencies, typically 0 to 250 Hz. The designs of the low chambers vary a great deal; 18-or 15-inch speakers are loaded in either a folded horn or reflex ported design.
2. Mid band. The range of the mid band varies among cabinets. Some cabinets have a front-loaded horn design or infinite baffle; others have a front-loaded horn with phase plugs. Mid speakers are either 10 or 12 inches, and they cover frequency ranges from 250 to 1,200 Hz. Cabinets with phase plugs have a wider frequency response, anywhere up to 4,000 Hz.3.
3. High band. The components that cover the higher frequencies are horns with compression drivers. The compression drivers use an alloy or titanium diaphragm to provide fidelity and extended high-frequency response. The frequency range of the high-band section depends on the crossover point of the mid band. The high band generally runs from mid band crossover frequency all the way up. Exceptions have tweeters for the ultrahigh frequencies.
In addition to three-way active cabinets, sub-low cabinets sometimes are used. Their frequency range is generally 0 to 63 Hz.
STACKING SPEAKERS
Speakers should be situated to provide good, even coverage to the audience with minimum obstruction. When stacking a speaker system, make sure the deck is solid and level. Often a scaffold that appears to be solid and level sinks or bends with the concentrated weight of a speaker system, causing the speaker stack to lean. The scaffolding should be inspected before, during, and after stacking to ensure safety. Speaker stacks for outdoor concerts must be secured so that they cannot blow over. Sub-low cabinets should be stacked directly on the floor so that the cabinet can couple with the ground. Other speaker cabinets should be above head height so that the sound from the cabinets can disperse.
FLYING SPEAKERS
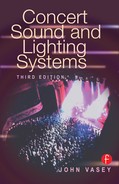
Speakers are flown to provide wide coverage with no sight-line obstructions in arena-style venues. Speakers also are flown to provide front-row sound for people seated in the balconies. Most modern speaker cabinet designs incorporate flying hardware. Positioning cabinets in a flown array depends on where people are seated (Figure 4–1).
DELAY SYSTEMS
USE
Delay systems are used to maintain clarity and level over a large area. Although a large number of cabinets can be used for power, clarity is lost after a certain distance. In indoor venues where there is a great deal of reverberation, the reverberant signal may make the amplified signal unintelligible in the higher frequencies, necessitating additional horns to maintain clarity.
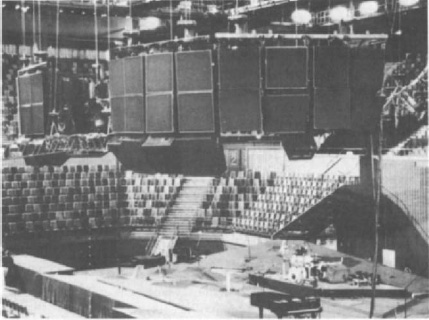
Figure 4–1. Flown speakers. Speakers are flown to provide wide coverage with no sight-line obstruction.
The delay system must blend in with the sound from the main system and not sound like a separate system. The audience should hear only a loud and clear sound that appears to come from the stage area.
SETTING DELAY TIME
The equation for setting the amount of delay time in a delay system is the distance in meters divided by 340 and multiplied by 1,000, which equals time in milliseconds. Measure the response of the main system at the delay system position first, then tune the delay system to bring up the overall response to equal that of the main system. Often this means that minimal or low frequencies are not needed. The average speed of sound is 340 meters per second, which increases with heat and humidity. The actual speed depends on atmospheric pressure and air density, so the equation provides only a rough estimate. Once the rough time is set, it can be tuned exactly with a pulse, that is, a single click; the time can be set so that the click appears to come from the main speaker stacks.
CENTER CLUSTERS
Center clusters sometimes are flown between stereo clusters to achieve powerful, even coverage of a venue. A center cluster can be used exclusively for vocals so that the audience hears the voices as coming from between the stereo clusters.
DISTRIBUTED SYSTEMS
A distributed system is used for low-level amplification to a large number of people. The distributed sources of sound should be placed at specified distances and on the same arc so that they can share a common signal, which is delayed for each arc of cabinets. Every source of sound requires individual level control so that it can be adjusted to suit the surrounding area. This can be done by means of adjusting either the amplifiers or the relevant crossovers.
ANALYZING SPEAKER SYSTEMS
A spectrum analyzer is used to measure the entire spectrum of sound as a person hears it and displays it on a series of light-emitting diodes (LEDs) that match the layout of a graphic equalizer. Analyzer response must be set to suit each application. For reading a musical program, fast attack and slow decay are suitable; for acoustic measurements with pink noise, slow attack and slow decay are best. Divisions of the audio spectrum are shown in Figure 4–2.
PINK NOISE
To measure the performance of a speaker system with an analyzer, a source of sound, pink noise, is required. Pink noise is noise with equal amounts of energy in all frequencies that has been passed through a filter to bring the energy to the level heard by the human ear (Figures 4–3 to 4–8).
USING THE ANALYZER
Sound varies among the thousands of seats in an auditorium. The speakers should be positioned to give as uniform a response as possible, and the crossovers should be set before the equalizer is touched. To analyze the speaker system without room interference, the measurement microphone should be positioned one and one-half times the height of the speaker stack, although sometimes this is not practical. Most clubs and concert halls have a very live sound because their large number of reflective surfaces improves room gain. In large halls this gain can be as much as 30 dB but is not uniform. The high frequencies are attenuated more than the low frequencies by molecular air absorption. Analyzing at the back wall naturally shows a loss of high frequencies, and trying to equalize them back in would make the sound painful everywhere else in the room. The initial measurement should be near and in front of the speaker stack and then at various positions in the room to give an overall view of the necessary adjustments that must be made (Figure 4–9).

Figure 4–2. Divisions of the audio spectrum.

Figure 4–3. White noise. White noise has equal energy in each frequency band according to a linear scale and therefore has a rising response on a logarithmic scale.
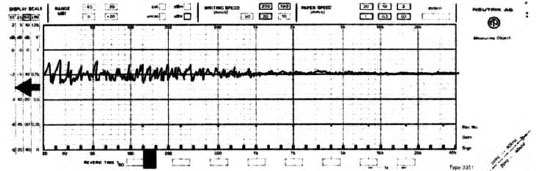
Figure 4–4. Pink noise. Pink noise has a flat response when the spectrum is divided according to the way the ear hears (logarithmically) and is therefore used in acoustic measurements.
Figure 4–5. Speakers wired in series. Speakers and drivers arc-wired in series to match impedance to the type of amplifier being used.

Figure 4–6. Speakers wired in parallel. Speakers and drivers are wired in parallel to match impedance to the type of amplifier being used. In some cases, two pairs of speakers are wired in series, and each pair is wired in parallel to match the impedance for optimum use of available amplifier power.

Figure 4–7. Cross section of a speaker shows arrangement of speaker parts. (Courtesy JBL Professional.)

Figure 4–8. Cross section of a compression driver shows arrangement of high-frequency horn driver parts. (Courtesy JBL Professional.)
Some hints for using an analyzer are as follows:
1. Try to maintain the average curve of equalization around the zero mark, and generally cut obtrusive peaks rather than boost all others to preserve headroom in the system.
2. In stereo systems, no matter how much equalization is needed, avoid boosting a particular frequency or band of frequencies on one channel and cutting the same frequencies on the other channel. No matter how much the frequency response has improved, a considerable phase shift has been introduced that will create a noticeable image shift.
3. Try to avoid sharp response changes. Compromise by setting one frequency at 0 and the adjacent frequencies at –2 rather than at +2 and –4. Carry a tape of a piece of music you know well and use this as the final judge of the system's response to the music.
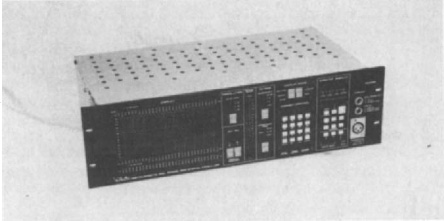
Figure 4–9. Spectrum analyzer. This unit is used to measure the entire spectrum of sound as one hears it and displays it on a series of LEDs.
If you are equalizing a room and the analyzer shows marked deviation from flat (more than 5 dB), moving the speakers or the listening position may be the answer rather than destroying the overall equipment response. The measurement microphone may have ended up at a node or antinode, that is, at a point of minimum or maximum pressure at a low frequency. The measurement microphone sums the acoustic energy from the speakers and the reflected sound from the room surfaces. That summation can cause a peak or a dip through cancellation, and the resultant curve is a disaster. Fortunately the ear is not as clinical as the analyzer and generally misses the aberrations in sound that it does not want to hear. Set the analyzer to an intelligent compromise between what the analyzer says and what the ear wants to hear.
For one-night gigs, in which time is limited, place the measuring microphone in a central position and put the pink noise through each stack and through a check at the mixing position. The farther back you go, the more reverberation and less direct sound you receive. A drop in high frequencies due to absorption and a huge rise in lower frequencies from the back wall also occur. Take all these variables into account when selecting a mixing position. Finally, after equalizing for a flat response, make subtle changes to make it sound right—music is highly subjective, and spectrum analyzers do not always share your taste.