
14. Alternative Models of Governance
In this book, we have primarily limited ourselves to an examination of the governance practices of publicly traded corporations. Many features of this system are imposed on the firm either by legislative, regulatory, and listing requirements or by market pressures exerted by public shareholders and other providers of capital.
In this chapter, we consider four alternative models of governance: those adopted by family-controlled businesses, venture-backed companies, private equity–owned companies, and nonprofit organizations. Each of these types of organizations must deal with its own set of challenges related to ownership, control, and purpose. As a result, the solutions they elect are somewhat different from those discussed throughout this book and provide a useful contrast for stakeholders in public and private organizations alike.
Family-Controlled Corporations
Family-controlled corporations are those in which a founder or founding-family member maintains a presence in the firm as a shareholder, director, or manager. The level of control that the founder or family exerts varies based on ownership level, voting rights, and personal involvement at the managerial or board levels.
According to research by McKinsey & Co., family-controlled businesses account for a large portion of global economic production, approximately 70 to 90 percent of gross domestic product. While the majority of family-controlled businesses are private, several publicly traded corporations exist. Approximately one-third of the Fortune Global 500 companies are founder- or family-controlled. Family control among large corporations is highest in emerging markets (60 percent). However, even in developed economies such as Europe, family control over large corporations remains high (40 percent).1
In the United States, family control is lower, although still significant. Founding families are present at the management or board level in approximately one-third of S&P 500 companies and hold 18 percent of outstanding equity.2 The largest family-controlled corporations by revenue—both public and private firms—include Wal-Mart, Ford Motor Company, Cargill, and Koch Industries (see Table 14.1).3
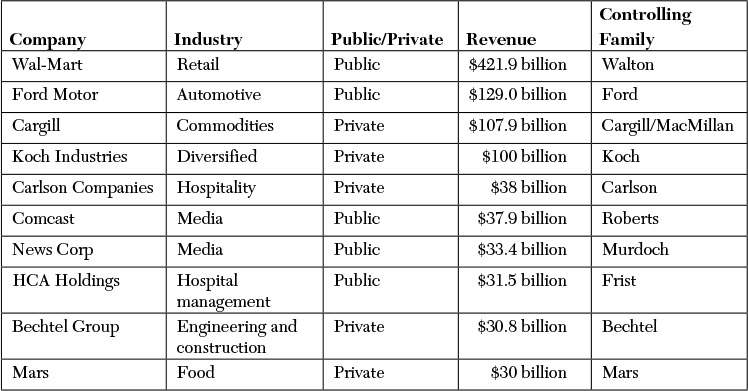
Source: Karlee Weinmann and Aimee Groth, “The 10 Largest Family Businesses in the U.S,” Business Insider (November 17, 2011).
Table 14.1 Largest Family Businesses in the United States
Several reasons exist why family-controlled businesses might have lower agency problems than a typical public corporation. Founders and founding-family members tend to have a large financial stake, lessening the divide between ownership and control that is central to agency risks. In addition, they tend to have a personal stake in the company (some see it as their “legacy”) and are concerned with its performance beyond their tenure. As such, founders and founding-family members might exert more vigilant oversight over management, strategy, and risk; design more rational compensation packages, and encourage a focus on long-term performance.
On the other hand, family ownership can be negative if family members use the corporation to extract private benefits or seek to influence outcomes beyond their legal voting rights. We saw evidence that this occurs in some large, family-controlled pyramidal business groups in emerging economies, particularly those where capital markets are underdeveloped (see Chapter 2, “International Corporate Governance”). Furthermore, the concentration of family wealth in one company might make controlling members risk-averse and therefore less willing to pursue promising but risky investment that can contribute to long-term value creation.
Research evidence illustrates both positive and negative aspects of family control. Anderson and Reeb (2003) found that family firms perform better than nonfamily firms and that performance improves further when the family member serves as CEO. They attributed the results in part to family members viewing themselves as “stewards of the firm.” They concluded that “in well-regulated and transparent markets, family ownership in public firms reduces agency problems without leading to severe loss in decision-making efficiency.”4 Fahlenbrach (2009) found that companies controlled by a founder-CEO invest more in research and development, have higher capital expenditures, and make more focused mergers and acquisitions. He also found that they exhibit superior long-term stock price performance.5
Villalonga and Amit (2006) found that the presence of the founding family has a positive impact on firm value when the founder serves as chairman or CEO but a negative impact when a descendent of the founder serves in one of these roles. That is, the nature of the agency problem might depend on the relationship between the family member and the firm.6
Research by McKinsey & Co. suggests that family ownership contributes positively to firm culture. They found that 90 percent of nonfamily managers report that family values are present in the organization, and 70 percent believe these values are part of day-to-day operations. Among family businesses, top management rate their personal sense of “emotional ownership” of the company 4.1 on a scale of 1 to 5. McKinsey found that family firms also rank highly on worker motivation and leadership.7 Consistent with this, Mueller and Philippon (2011) found that family-controlled businesses have better labor relations, in part because management is in a position to make credible long-term promises.8
Somewhat surprisingly, evidence suggests that family-controlled businesses are not well prepared for management succession. PricewaterhouseCoopers (2014) found that 44 percent of private family businesses have no succession plan in place. Among those that do, only 30 percent report that their succession plan is robust and well-documented.9 Pérez-González (2006) found that family businesses make worse succession decisions and that firms where the incoming CEO is related to the founder or to a large shareholder by blood or by marriage exhibit worse future operating performance.10
Finally, the research evidence on financial reporting quality and transparency among family-controlled businesses is mixed. Ali, Chen, and Radhakrishnan (2007) found that family-controlled firms report higher-quality earnings and are more likely to warn about an earnings downturn. They concluded that this is “consistent with the notion that, compared to nonfamily firms, family firms face less severe agency problems, leading to less opportunistic behavior in terms of withholding bad news.”11 Wang (2006) also found that family ownership is associated with higher earnings quality.12 By contrast, Anderson, Duru, and Reeb (2009) found that family-controlled companies have less transparent disclosure and exploit this opacity to extract private benefits at the expense of minority shareholders.13 Similarly, Anderson, Reeb, and Zhao (2012) found that inside executives within family-controlled firms are more likely to take advantage of private information and sell shares prior to the announcement of negative news than those within nonfamily firms.14 To this same end, Lins, Volpin, and Wagner (2013) found that family firms responded to the financial crisis of 2008–2009 by taking actions to preserve family control over the organization, even though these moves were detrimental to minority shareholders.15
Given the inconsistent evidence, it might be the case that the personal attributes of family members determine whether they are more or less likely to engage in self-interested behavior that is harmful to outside shareholders.
Venture-Backed Companies
Venture-backed companies are small, high-growth companies that rely on venture capital firms for initial and early-stage equity financing. Venture-backed companies tend to cluster in rapidly changing industries—such as technology, life sciences, and alternative energy—where potential returns and the likelihood of failure are high. Because of their risk, venture-backed companies in their early stages lack access to common sources of financing—such as bank loans and other public or private debt and equity—and instead turn to venture capital firms that specialize in high-risk investing. The venture capital firm reduces its own risk exposure by investing in a diversified portfolio of such companies with the expectation that a few highly successful investments will offset losses in other parts of its portfolio and result in an appropriate risk-adjusted return.
Venture capital firms receive their capital from institutional and retail investors. The venture capital firm establishes a limited partnership, with its investors as limited partners and the firm itself as general partner. A venture capital firm typically manages multiple funds (or portfolios) simultaneously, each with a 10-year average life. Investments are made in the first few years following the establishment of the fund, and capital is returned to the investor when portfolio companies are acquired or go public in an initial public offering (IPO). The venture capital firm receives in compensation a percentage of the profits generated (typically 20 percent), known as “carried interest.”
According to the National Venture Capital Association (NVCA), more than 800 venture capital firms operated in 2013, up from 370 two decades prior. Venture capital firms managed a combined $193 billion, and the average fund size was $110 million (see Table 14.2).16
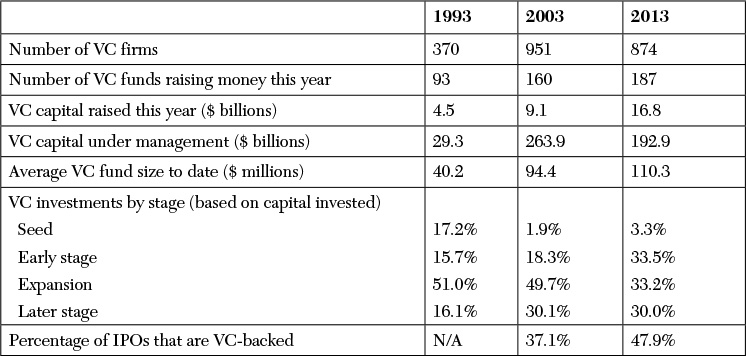
Source: Thomson Reuters, “2014 National Venture Capital Association Yearbook,” National Venture Capital Association (March 2014).
Table 14.2 Venture Capital Summary Statistics
Data demonstrates the high-risk nature of venture capital investing. According to the NVCA, only 14 percent of nearly 11,700 venture-backed companies first funded between 1991 and 2000 eventually went public, 33 percent were acquired, 18 percent are known to have failed, and 35 percent are still private or of unknown status.17
The unique nature of venture capital investing influences the governance choices of venture-backed firms. Venture-backed firms tend to be tightly controlled by their funders. A typical venture-backed company has a median board size of four, two of whom are members of the venture capital firm. Only 15 percent of the time does the CEO also serve as chairman.18
The boards of venture-backed companies are less independent than is the board of a typical publicly traded corporation. Immediately prior to IPO, only 56 percent of venture-backed company directors are independent. Many venture-backed companies do not convene formal audit, compensation, or nominating and governance committees until the period leading up to an IPO. Even then, when these committees are first established, they generally are not fully or majority independent.19 (We expect this because they are privately held, and all major shareholders have board representation.)
Compensation among venture-backed companies is heavily weighted toward equity-based awards. According to Compensia, 97 percent of high-growth technology companies award their executives and employees stock options, and 85 percent offer restricted stock. On average, 21 percent of shares are available for future award under equity-based compensation plans, representing a considerable level of dilution (“stock overhang”).20 Immediately prior to IPO, the venture capital firm owns 54 percent of the total equity outstanding, the CEO 15 percent, the top five managers 26 percent, and total directors and officers 63 percent.21
Finally, venture-backed companies remain tightly “controlled” even following an IPO. Venture capital–backed firms are characterized by a high number of antitakeover protections. A 2015 study by law firm Proskauer found that 77 percent of newly issued IPO companies have a staggered board, 15 percent have multiple classes of stock, 66 percent restrict shareholder access by written consent, 69 percent restrict shareholder rights to call a special meeting, and 72 percent have supermajority voting requirements.22 This raises questions about potential agency conflicts between equity holders and managers in newly listed venture-backed firms.
Research suggests that venture capital firms generally have a positive influence on the governance choices of their portfolio companies. Hellman and Puri (2002) found that venture capital companies contribute to the professionalization of startup companies. Venture-backed companies are more likely to replace the founder with an outside CEO. They are also more likely to introduce employee stock option plans and influence human resource policies, including recruitment and selection practices.23 Celikyurt, Sevilir, and Shivdasani (2014) found that companies that retain members of the venture capitalist firm on the board post-IPO are characterized by higher levels of research and development investment, innovation, and deal activity. They concluded that venture capitalists “play a significant role in mature public firms and have a broad influence in promoting innovation.”24 Hochberg (2012) found that venture-backed firms have lower levels of earnings management.25 Despite the prevalence of antitakeover protections among venture-backed companies, Daines and Klausner (2001) found no evidence that these protections are adopted to entrench management. Instead, they are most commonly adopted among companies “where the firm’s investments are relatively transparent, information asymmetries less likely, and where bidder competition is most likely to provide a target with bargaining power.”26 It might be that antitakeover protections are adopted at IPO to preserve preexisting commitments and long-term business relationships.27
Furthermore, research indicates that governance quality and company performance are positively associated with the reputation of the firm that provides venture funding. In an examination of startup companies that received first-round funding, Wongsunwai (2007) found that companies backed by top-quartile venture capital firms subsequently had larger, more independent boards and greater venture capital firm involvement at the board level. Among a subset of companies that reached IPO, those backed by top-quartile venture capitalists had higher earnings quality, as measured by abnormal accruals and future restatements.28 Similarly, Krishnan, Ivanov, Masulis, and Singh (2011) found that companies backed by high-quality venture capitalists demonstrate superior long-term operating and stock-price performance. They found that venture capitalists with the highest reputation tend to stay on the board and hold their shares longer post-IPO and that their continued involvement with the company positively influences performance.29
Private Equity-Owned Companies
Private equity firms are privately held investment companies that invest in businesses for the benefit of retail and institutional investors. The structure of private equity is similar to that of venture capital: The firm itself is organized as a limited liability company, while its investment capital is deployed through limited partnerships with the private equity firm acting as general partner.30 This structure allows the private equity firm to manage multiple funds, each with its own portfolio of assets. It also allows the firm to avoid liability to creditors if an investment in one of the funds fails.
Private equity firms invest in publicly traded businesses, privately held firms, and subsidiaries spun off from larger corporations. Their targets are generally mature companies that generate substantial free cash flow to support a leveraged capital structure. After they are acquired, portfolio companies can undergo a complete change in management, board of directors, operating strategy, and capital structure. If successful, the private equity firm sells the company, either back into the public markets through an IPO or to a strategic buyer that is interested in the improved operations. The private equity firm retains a percentage of the profit in carried interest (typically 20 percent) and returns the remaining proceeds to investors.
Private equity has seen considerable growth as an asset class since the 1980s. According to data from Private Equity Analyst, over $1.2 trillion in capital was committed to private equity between 2000 and 2008, compared with $233 billion between 1990 and 1999 and only $48 billion between 1984 and 1989.31
Tables 14.3 and 14.4 provide summary statistics of private equity transactions over time. Approximately 17,000 private equity–sponsored corporate buyouts occurred globally between 1985 and 2007. Twenty-seven percent of acquisition targets are publicly traded companies, 23 percent are independent private companies, 30 percent divisions of corporations, and 20 percent secondary purchases from other private equity companies.32

Data for 2007 represents a partial year (through June 30). LBOs by type and location calculated as a percent of combined enterprise value.
Source: Kaplan and Strömberg (2008).
Table 14.3 Private Equity Summary Statistics
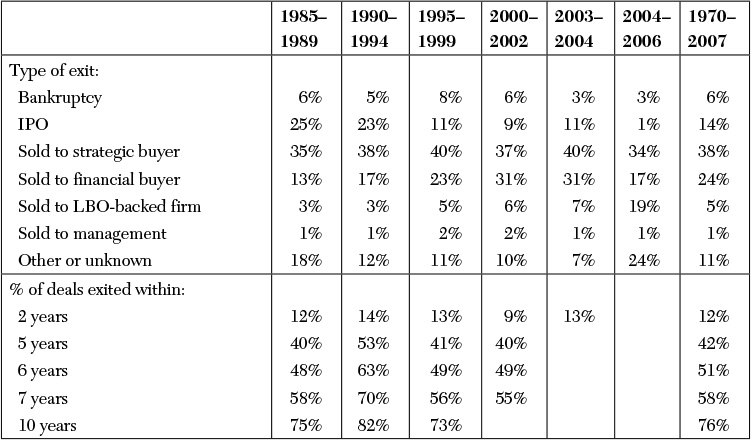
Data for 2007 represents a partial year (through June 30).
Source: Kaplan and Strömberg (2008).
Table 14.4 Exit Characteristics of Leveraged Buyouts
Private equity firms invest in a company for an average of six years, at the end of which they are either sold to a strategic buyer (38 percent), financial buyer (24 percent), other private equity company (5 percent), or management (1 percent); go public (14 percent); or file for bankruptcy (6 percent).33
Private equity deals are known for their leverage. Leverage is used to increase returns on invested capital and reduce taxes. (For this reason, some critics of private equity refer to their activities as “financial engineering.”) Based on a sample of buyouts of previously publicly traded companies, Guo, Hotchkiss, and Song (2011) calculated that the average debt-to-capital ratio of a target company nearly triples post-acquisition, from 25 percent to 71 percent. Leverage is achieved through a mix of public, private, and bank debt.34
Because private equity–backed companies are not publicly traded, they are not required to adopt the governance standards of the New York Stock Exchange. As a result, their governance structure tends to be very different from that of a publicly traded corporation. The board of directors is relatively small (five to seven individuals). The composition of the board is heavily represented by insiders (executives of the portfolio company and members of the private equity firm) that own a majority of the firm. The private equity partners are closely involved in strategic and operating matters, and the focus of board meetings is on business, financial, and risk-management issues more than compliance and regulatory issues.
Survey data suggests that a directorship at a private equity–owned portfolio company requires a significantly greater time commitment than at a publicly owned corporation. According to one report, the average private equity director spends nearly three times the number of hours in his or her role as a public company director—54 days versus 19 days per year, on average.35 A private equity director also potentially adds more value. Acharya, Kehoe, and Reyner (2008) surveyed a small sample of individuals who served concurrently on the boards of a large U.K.-based corporation (in the FTSE 100 or FTSE 250 Index) and a private equity–owned company. Three-quarters believed that private equity boards added more value; none reported that public boards did. On average, they rated private equity boards more effective at strategic leadership, performance management, and stakeholder management; they rated public boards more effective in succession planning and governance (audit, compliance, and risk management).36
Executive compensation in private equity is also larger and more heavily weighted toward equity incentives. Leslie and Oyer (2009) found that the CEOs of private equity–owned companies receive almost twice the equity, 10 percent lower salary, but more cash compensation, including bonus, than their counterparts at comparable public corporations.37 Cronqvist and Fahlenbrach (2013) examined how CEO compensation changes among a sample of companies that transition from public to private ownership. They found that base salary and annual cash bonus increase and that the CEO’s equity stake in the company approximately doubles. Performance targets are redesigned away from qualitative and nonfinancial performance measures to profitability measures.38
A survey of mid-sized private equity–owned companies also illustrates the heavy use of equity compensation. PricewaterhouseCoopers (2013) found that a typical portfolio company CEO holds approximately 2 percent of the company’s equity on a fully diluted basis. The next four most highly compensated executives hold an additional 2.9 percent combined. Twenty-one percent of shares are kept in reserve for future grant. Equity grants comprise a mix of performance and time-vested awards—typically in a ratio of two-to-one. Performance awards are contingent upon exit multiples, internal rates of return upon exit, and financial targets.39
Research demonstrates that private equity companies are successful in generating large returns. However, it is not clear the extent to which returns are driven by operating improvements rather than leverage and tax reduction, nor is it clear how private and public equity returns compare on a risk-adjusted basis.
Phalippou and Gottschalg (2009) calculated that private equity investments produce a risk-adjusted return net-of-fees 6 percent per year below that of the S&P 500.40 By contrast, Harris, Jenkinson, and Kaplan (2014) found that private equity funds outperform the S&P 500 by 3 percent annually.41
Guo, Hotchkiss, and Song (2011) found that leverage accounts for a significant portion of private equity returns.42 Acharya, Gottschalg, Hahn, and Kehoe (2013) found that private equity investments outperform public benchmarks even after controlling for leverage and that private equity–owned companies exhibit better sales growth and margin expansion than publicly traded peers. They also found some evidence that the nature of improvement is related to the skills and background of the lead deal partner.43 Davis, Haltiwanger, Handley, Jarmin, Lerner, and Miranda (2014) found that in the manufacturing sector, private equity owners more aggressively redirect investment from less-productive to more-productive plants. They calculated that while legacy plants exhibit a higher rate of job loss than peers, private equity owners invest more aggressively in new operations and that, in aggregate, they create more jobs than they eliminate. The authors concluded that they see “private equity as agents of change in the sense that buyouts accelerate retrenchments at some target firms, while accelerating expansion at others.”44 Still, the research on private equity remains mixed.
Nonprofit Organizations
A nonprofit organization is an organization that is tax-exempt under rule 501(c) of the Internal Revenue Code. Approximately 1.5 million nonprofits operate today in a wide range of activities that include education, social and legal services, arts and culture, health services, civic and fraternal organizations, and religious organizations; labor unions; and business and professional associations. In 2012, nonprofit organizations reported aggregate revenues of $1.6 trillion and assets of $4.8 trillion (see Table 14.5). Charities related to health, education, and human services (for example, those that provide food, shelter, and assistance) are the most numerous and largest by revenues and assets; religious and educational institutions receive the largest share of total donations (see Table 14.6).45
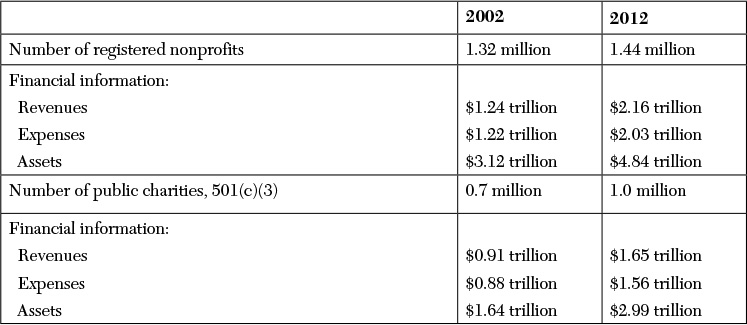
Does not include organizations that are not registered with the Internal Revenue Service, such as religious congregations and nonprofits with annual revenue less than $5,000. Financial data is provided for nonprofits required to file Form-990 with the IRS, approximately 35 percent of registered organizations.
Source: McKeever and Pettijohn (October 2014).
Table 14.5 Nonprofit Organizations in the U.S.
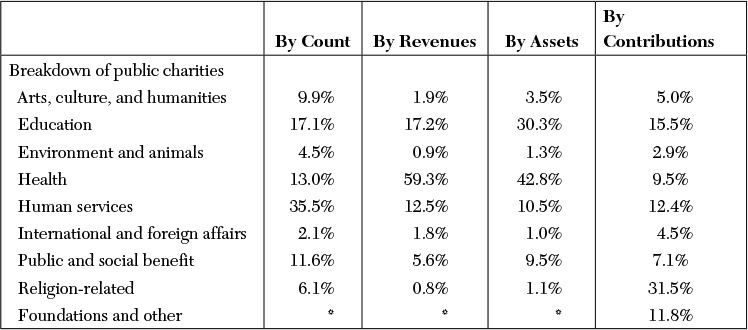
Data for 2012 except charitable contributions, which are for 2013. Foundations are not reported as a separate category in columns labeled with an (*).
Source: McKeever and Pettijohn (2014).
Table 14.6 Nonprofit Organizations by Count and Activity
Nonprofits are granted tax-exempt status by the U.S. government to encourage the pursuit of charitable and social activities unrelated to commerce.46 As such, they have a stakeholder—rather than shareholder—orientation, and this influences their governance system.
The board of directors (or board of trustees) is responsible for oversight of the organization, including reviewing strategy, finances, and performance; hiring and firing the CEO; and setting compensation. They are also subject to the same duties of care and loyalty that govern public company boards. Because nonprofits are stakeholder oriented, the board must establish the metrics by which organizational success is measured. While financial measures play a role in organizational success, the board must determine nonfinancial and qualitative measures to assess whether the organization is meeting its mission.
The board tends to be larger than the average for-profit board: approximately 16 members compared with 12. Board members meet 7 times per year. Nonprofit boards have greater female representation but not a considerably different racial mix. The CEO rarely serves as dual chairman, doing so only 3 percent of the time. The CEO sits on the board only 54 percent of the time, often as a nonvoting member. Most directors are not compensated for their service. Most nonprofits require that board members make personal donations, and a significant number (42 percent) require that directors personally solicit funds on behalf of the organization. The policy of requiring directors to donate or raise money is known as a “give or get” policy.47 (See Table 14.7 for summary statistics on nonprofit boards. We provided comparable data for for-profit boards in Chapter 5, “Board of Directors: Structure and Consequences.”)
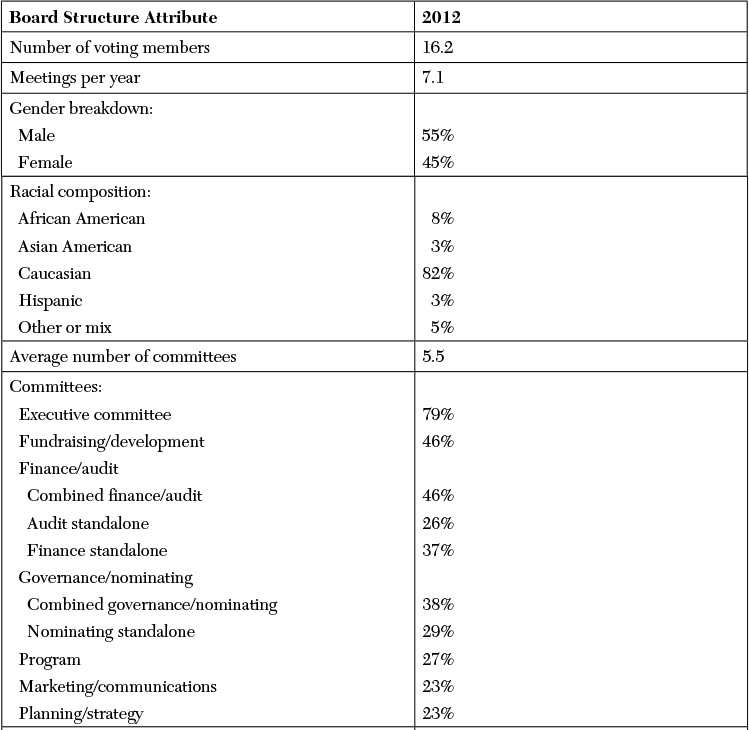

Sample includes organizations with a median operating budget in excess of $1 million.
Source: BoardSource (September 2012).
Table 14.7 Nonprofit Board Structure and Practices
Considerable board work takes place at the committee level. The average board maintains between five and six standing committees, and these may include an executive committee (which generally meets prior to full board meetings to review major issues and make preliminary decisions); a fundraising committee; a finance and/or audit committee; a governance/nominating committee; and committees for programs, marketing, and strategy. Of note, nonprofit boards typically do not have a compensation committee.
Executive compensation among nonprofit organizations is significantly lower than among for-profit companies. According to a survey of approximately 4,000 mid-sized and large charities, the CEO earned median compensation of $130,400 in 2012. The maximum compensation awarded among the sample that year was $3.7 million. Compensation is highest among nonprofits involved in arts, culture, and education and lowest among religious-based organizations.48
Nonprofits are not subject to the audit and internal control requirements of the Sarbanes–Oxley Act. As such, the board of directors must determine whether to conduct an audit and the level of internal controls required to safeguard funds. In some cases, external stakeholders—such as a government agency providing grant money—require audited financials.
Survey data suggest that nonprofits face several governance-related challenges. A survey by BoardSource (2012) found that most nonprofits operate with a board of directors that is not fully staffed: 46 percent of respondents report that they are currently recruiting between one and three members, 26 percent between four and six members, and 5 percent more than six members; only 23 percent report being fully staffed. A significant minority (47 percent) report that it is difficult to recruit new members.49
A survey by the Rock Center for Corporate Governance at Stanford University, BoardSource, and GuideStar (2015) found that many board members do not fully understand their obligations as directors.50 Directors place considerable emphasis on their fundraising obligations and significant minorities do not fully understand the strategy, mission, or performance of their organization. For this reason, some experts recommend that nonprofits adopt a bifurcated board structure, in which fiduciary oversight and fundraising obligations are separated.51 The survey also found that many nonprofits lack formal governance processes. Forty-two percent do not have an audit committee, 69 percent do not have a succession plan in place for the current CEO, and 36 percent never perform board evaluations.
Research demonstrates that governance quality varies across organizations. Aggarwal, Evans, and Nanda (2012) found that board size is positively associated with the complexity of the organization and the number of programs it pursues. Furthermore, they found that increasing complexity is associated with worse CEO pay-for-performance sensitivity and, in some areas, worse organizational performance.52 O’Regan and Oster (2005) found that board size and executive director control (indicated by the power to nominate board members) are positively associated with organizational performance. Long-tenured directors and directors on multiple boards are also associated with positive performance. These suggest informational benefits of greater board experience.53
Baber, Daniel, and Roberts (2002) found that managerial compensation among nonprofits is positively associated with total revenues and program spending, indicating that boards give management incentive to grow the size of the organization.54 Frumkin and Keating (2010) found no association between compensation and donation revenue but did find a negative association between compensation and the administrative expense ratio, suggesting that nonprofit executives are given incentives to reduce administrative costs.55 Little research exists to explain whether or how nonprofits rely on nonfinancial performance metrics to set compensation or monitor performance. Given the paucity of information on nonfinancial performance metrics among nonprofits, it is unlikely that they are widely used to evaluate the executive director; if they are used, it is likely that they are used informally.
Finally, research suggests that nonprofits with weaker controls and governance mechanisms are more likely to exhibit agency problems. Core, Guay, and Verdi (2006) found that nonprofits holding “excess” endowment funds (funds larger than are necessary to finance current and future expenses) are subject to greater agency problems; they spend a lower percentage of funds on direct program costs and pay higher compensation to the CEO, officers, and board members.56 Krishnan, Yetman, and Yetman (2006) found that many nonprofits systematically understate fundraising costs and that in cases where this occurs, management incentives encourage understatement. They found that the use of an outside accountant reduces the likelihood of misreporting.57 Similarly, Krishnan and Yetman (2011) found that nonprofit hospitals that receive higher donations revenue are more likely to shift costs away from administrative categories in order to appear more efficient.58
Petrovits, Shakespeare, and Shih (2011) found that nonprofits with weak internal controls receive lower future support from donors.59 Yermack (2015) found that donors react to weak governance oversight by adding restrictions to gifts.60 Harris, Petrovits, and Yetman (2015) found that donation revenue and government grants are positively associated with visible indicators of governance quality, including formal written policies such as a conflict-of-interest policy, independent audits and an audit committee, an independent board, and accessible financial information. They comment that “mandatory disclosure of governance policies of nonprofit organizations provides an interesting contrast to mandatory adoption of governance policies for publicly traded companies.”61
Endnotes
1. McKinsey & Company, “Perspectives on Founder- and Family-Owned Businesses” (October 2014). Accessed April 11, 2015. See Perspectives_on_founder_and_family-owned_businesses.pdf.
2. Ashiq Ali, Tai-Yuan Chen, and Suresh Radhakrishnan, “Corporate Disclosures by Family Firms,” Journal of Accounting and Economics 44 (2007): 238–286. Also see Ronald C. Anderson and David M. Reeb, “Founding-Family Ownership and Firm Performance: Evidence from the S&P 500,” The Journal of Finance 58 (2003): 1301–1328.
3. Karlee Weinmann and Aimee Groth, “The 10 Largest Family Businesses in the U.S.,” Business Insider (November 17, 2011).
4. Anderson and Reeb (2003).
5. Rüdiger Fahlenbrach, “Founder-CEOs, Investment Decisions, and Stock Market Performance,” Journal of Financial and Quantitative Analysis 44 (2009): 439–466.
6. Belen Villalonga and Raphael Amit, “How Do Family Ownership, Control, and Management Affect Firm Value?” Journal of Financial Economics 80 (2006): 385–417.
7. McKinsey & Company (2014). Also see “Business in the Blood,” The Economist 413 (November 2014): 59–63.
8. Holger M. Mueller and Thomas Philippon, “Family Firms and Labor Relations,” American Economic Journal: Macroeconomics 3 (2011): 218–245.
9. PricewaterhouseCoopers LLC, “Up Close and Professional: The Family Factor Global Family Business Survey (2014). Accessed October 30, 2014. See www.pwc.com/familybusinesssurvey.
10. Francisco Pérez-González, “Inherited Control and Firm Performance,” American Economic Review 96 (2006): 1559–1588.
11. Ali, Chen, and Radhakrishnan (2007).
12. Dechun Wang, “Founding Family Ownership and Earnings Quality,” Journal of Accounting Research 44 (2006): 619–656.
13. Ronald C. Anderson, Augustine Duru, David M. Reeb, “Founders, Heirs, and Corporate Opacity in the United States,” Journal of Financial Economics 92 (2009): 205–222.
14. Ronald C. Anderson, David M. Reeb, and Wanli Zhao, “Family-Controlled Firms and Informed Trading: Evidence from Short Sales,” Journal of Finance 67 (2012): 351–386.
15. Karl V. Lins, Paolo Volpin, and Hannes F. Wagner, “Does Family Control Matter? International Evidence from the 2008–2009 Financial Crisis,” Review of Financial Studies 26 (2013): 2583–2619.
16. Thomson Reuters, “2014 National Venture Capital Association Yearbook,” NVCA (March 2014). Accessed April 12, 2015. See http://nvca.org/research/stats-studies/.
17. Ibid.
18. Wan Wongsunwai, “Does Venture Capitalist Quality Affect Corporate Governance?” Working paper (February 4, 2007). Accessed April 12, 2015. See http://www.gsb.stanford.edu/sites/default/files/documents/WanWongsunwai_VCqualityandCG_Feb2007.pdf.
19. PricewaterhouseCoopers LLC, “Governance for Companies Going Public What Works Best” (2013). Accessed April 12, 2015. See http://www.pwc.com/us/en/transaction-services/publications/companies-going-public.jhtml.
20. Compensia, “Bay Area 150: Equity Compensation Practices” (October 2009). Accessed April 12, 2015. See http://www.compensia.com/surveys/BayArea150_Equity_1009.pdf.
21. Robert Daines and Michael Klausner, “Do IPO Charters Maximize Firm Value? Antitakeover Protection in IPOs,” Journal of Law, Economics, and Organization 17 (2001): 83–120.
22. Proskauer LLP, “2015 IPO Study” (March 17, 2015). Accessed April 13, 2015. See http://www.proskauer.com/publications/special-report/proskauers-exclusive-study-analyzes-2014-ipos-03-17-2015/.
23. Thomas Hellmann and Manju Puri, “Venture Capital and the Professionalization of Start-Up Firms: Empirical Evidence,” Journal of Finance 57 (2002): 169–197.
24. Ugur Elikyurt, Merih Sevilir, and Anil Shivdasani, “Venture Capitalists on Boards of Mature Public Firms,” Review of Financial Studies 27 (2014): 56–101.
25. Yael V. Hochberg, “Venture Capital and Corporate Governance in the Newly Public Firm,” Review of Finance 16 (2012): 429–480.
26. Daines and Klausner (2001).
27. Michael Klausner, “Fact and Fiction in Corporate Law and Governance,” Stanford Law Review 65 (2013). Accessed May 6, 2015. See http://ssrn.com/abstract=2297640. Also see William C. Johnson, Jonathan M. Karpoff, and Sangho Yi, “The Bonding Hypothesis of Takeover Defenses: Evidence from IPO Firms,” Journal of Financial Economics (2015). Accessed May 6, 2015. See http://ssrn.com/abstract=1923667.
28. Wongsunwai (2007).
29. C. N. V. Krishnan, Vladimir I. Ivanov, Ronald W. Masulis, and Ajai K. Singh, “Venture Capital Reputation, Post-IPO Performance, and Corporate Governance,” Journal of Financial and Quantitative Analysis 46 (2011): 1295–1333.
30. Two exceptions are Blackstone and KKR, which are publicly traded; their investments are still made through limited partnerships.
31. Private Equity Analyst data. See http://dowjones.com/privateequityventurecapital/product-pea.asp. As cited in Robert S. Harris, Tim Jenkinson, and Steven N. Kaplan, “Private Equity Performance: What Do We Know?” Journal of Finance 69 (2014): 1851–1882.
32. Steven N. Kaplan and Per Strömberg, “Leveraged Buyouts and Private Equity,” Journal of Economic Perspectives 22 (2008): 1–27.
33. Ibid.
34. Shourun Guo, Edith S. Hotchkiss, and Weihong Song, “Do Buyouts (Still) Create Value?” Journal of Finance 66 (2011): 479–517.
35. Viral Acharya, Conor Kehoe, and Michael Reyner, “Governance and Value Creation: Evidence from Private Equity,” McKinsey & Company (January 2, 2009). As cited in Fir M. Geenen and Sohail Malad, “Corporate Governance and Value Creation: Private Equity Style,” Harlingwood Equity Partners (November 2009). Accessed April 13, 2015. See http://www.harlingwood.com/docs/corporate_governanceand_value_ceation.pdf.
36. Viral Acharya, Conor Kehoe, and Michael Reyner, “The Voice of Experience: Public versus Private Equity,” The McKinsey Quarterly (December 2008). Accessed April 13, 2015. See http://www.mckinsey.com/insights/corporate_finance/the_voice_of_experience_public_versus_private_equity.
37. Phillip Leslie and Paul Oyer, “Managerial Incentives and Value Creation: Evidence from Private Equity,” EFA 2009 Bergen Meetings Paper, Social Science Research Network (January 27, 2009). Accessed May 6, 2015. See http://ssrn.com/abstract=1341889.
38. Henrik Cronqvist and Rudiger Fahlenbrach, “CEO Contract Design: How Do Strong Principals Do It?” Journal of Financial Economics 108 (2013): 659–674.
39. PricewaterhouseCoopers LLC, “2013 Private Equity Portfolio Company Stock Compensation Survey: Driving Portfolio Company Performance in a Changing Private Equity Environment” (2013). Accessed April 12, 2015. See http://www.pwc.com/us/en/private-equity/publications/private-equity-stock-compensation-survey.jhtml.
40. Ludovic Phalippou and Oliver Gottschalg, “The Performance of Private Equity Funds,” Review of Financial Studies 22 (2009): 1747–1776.
41. Harris, Jenkinson, and Kaplan (2014).
42. Guo, Hotchkiss, and Song (2011).
43. Viral V. Acharya, Oliver F. Gottschalg, Moritz Hahn, and Conor Kehoe, “Corporate Governance and Value Creation: Evidence from Private Equity,” Review of Financial Studies 26 (2013): 368–402.
44. Steven J. Davis, John Haltiwanger, Kyle Handley, Ron Jarmin, Josh Lerner, and Javier Miranda, “Private Equity, Jobs, and Productivity,” American Economic Review 104 (2014): 3956–3990.
45. Brice S. McKeever and Sarah L. Pettijohn, “The Nonprofit Sector in Brief 2014,” The Urban Institute (October 2014). Accessed April 14, 2015. See http://www.urban.org/research/publication/nonprofit-sector-brief-public-charities-giving-and-volunteering-2014.
46. Nonprofit organizations are required to pay taxes on profit earned through business activities unrelated to their basic purpose (known as “unrelated business income,” or UBI). They are also required to pay sales tax on applicable purchases.
47. These figures are for nonprofit organizations with a median annual operating budget of $1 million and therefore can be thought of as representative of a typical “large” organization. See BoardSource, “Nonprofit Governance Index 2012: Data Report 1, CEO Survey of BoardSource Members” (September 2012). Accessed August 18, 2014. See https://www.boardsource.org.
48. Charity Navigator, “2014 CEO Compensation Study” (October 2014). Accessed April 14, 2015. See http://www.charitynavigator.org/index.cfm?bay=studies.ceo#.VS70GF3F-EI.
49. BoardSource (2012).
50. Stanford Graduate School of Business, Rock Center for Corporate Governance at Stanford University, BoardSource, and GuideStar, “2015 Survey on Board of Directors of Nonprofit Organizations” (April 2015). Accessed May 6, 2015. See http://www.gsb.stanford.edu/faculty-research/centers-initiatives/cgri/research/surveys.
51. Michael Klausner and Jonathan Small, “Failing to Govern?” Stanford Social Innovation Review 3 (2005): 42–49.
52. Rajesh K. Aggarwal, Mark E. Evans, and Dhananjay Nanda, “Nonprofit Boards: Size, Performance and Managerial Incentives,” Journal of Accounting and Economics 53 (2012): 466–487.
53. Katherine O’Regan and Sharon M. Oster, “Does the Structure and Composition of the Board Matter? The Case of Nonprofit Organizations,” Journal of Law, Economics, and Organization 21 (2005): 205–227.
54. William R. Baber, Patricia L. Daniel, and Andrea A. Roberts, “Compensation to Managers of Charitable Organizations: An Empirical Study of the Role of Accounting Measures of Program Activities,” Accounting Review 77 (2002): 679–693.
55. Peter Frumkin and Elizabeth K. Keating, “The Price of Doing Good: Executive Compensation in Nonprofit Organizations,” Policy and Society 29 (2010): 269–282.
56. John E. Core, Wayne R. Guay, and Rodrigo S. Verdi, “Agency Problems of Excess Endowment Holdings in Not-for-Profit Firms,” Journal of Accounting and Economics 41 (2006) 307–333.
57. Ranjani Krishnan, Michelle H. Yetman, and Robert J. Yetman, “Expense Misreporting in Nonprofit Organizations,” Accounting Review 81 (2006): 399–420.
58. Ranjani Krishnan and Michelle H. Yetman, “Institutional Drivers of Reporting Decisions in Nonprofit Hospitals,” Journal of Accounting Research 49 (2011): 1001–1039.
59. Christine Petrovits, Catherine Shakespeare, and Aimee Shih, “The Causes and Consequences of Internal Control Problems in Nonprofit Organizations,” Accounting Review 86 (2011):325–357.
60. David Yermack, “Donor Governance and Financial Management in Prominent U.S. Art Museums,” Social Science Research Network (March 28, 2015). Accessed May 6, 2015. See http://ssrn.com/abstract=2586622.
61. Erica Harris, Christine M. Petrovits, and Michelle H. Yetman, “The Effect of Nonprofit Governance on Donations: Evidence from the Revised Form 990,” Accounting Review 90 (2015): 579–610.