Chapter 8: Generating Custom Reports
Moodle Workplace provides a custom report builder that allows administrators to create custom site-wide reports that are then distributed to users, such as managers and trainers, so that they can review and manage employee training programs.
The report builder sources data from many features in Moodle Workplace to provide reports on areas such as training completion, certification statuses, and seminar session attendance. In this chapter, you will learn how to create these reports and make them available to different users in your organization.
First, you will become familiar with the built-in reporting tool and how data is processed in both system reports and custom reports. Then, you will deal with the data and record sources that are supported and learn how to utilize these in your own reports.
Second, you will learn how to build reports with various customization options, such as conditions, filters, aggregation, groupings, and sorting. You will then learn about using the scheduling mechanism to automatically distribute reports to your users and how to configure audiences to grant access to reports.
Finally, you will become familiar with Moodle Workplace's data store, an alternative to saving records permanently beyond their lifetime in courses.
So, by the end of this chapter, you will know how to manage reports and how to make these reports available to different audiences in your organization. This chapter comprises four main parts:
- Exploring the reporting tool
- Selecting data and recording sources
- Building reports
- Exploring the Workplace data store
Exploring the reporting tool
You might not have realized it, but you have already been using reports in the last four chapters! How? Well, Moodle has done something very smart: it uses internal reports for key features in Moodle Workplace. For example, the list of active programs is a report. Active or archived certifications? Another two reports. The overview of all job assignments? You guessed it, yet another report. Every time you see a table list view in any of the Moodle Workplace tools, it is highly likely to be a built-in system report.
Moodle Workplace distinguishes between two types of reports:
- System reports: Embedded, pre-defined reports that are part of Moodle Workplace. System reports cannot be modified or removed since various Workplace features rely on them.
- Custom reports: User-generated reports made available to other users.
This chapter exclusively deals with custom reports, so let's see how reporting works in Moodle Workplace. The following diagram illustrates the high-level elements of the reporting workflow:

Figure 8.1 – Reporting workflows
Moodle Workplace supports two types of reporting data sources: a Workplace database and a so-called Workplace data store. The database is where all Workplace data is stored, excluding files. The data store is an alternative, xAPI-compatible data source that keeps track of permanent records in Workplace as well as external sources.
The most flexible reporting tool would let you select individual fields from every entity in the underlying database. However, this would require users to be familiar with the entire database model, which contains well over 100 tables and even more relationships between them. Instead, Workplace offers a range of record sources to simplify the usage of the report builder. A record source contains a pre-defined set of fields that are available when building a report.
Based on the selected record source, a certain amount of data will be available, which can be reduced by the following mechanisms. Configuring data fields lets the report creator decide which columns are being made available—for example, employee name, course name, and completion status. Applying conditions lets the report creator decide which rows will be made available—for instance, all records from the manufacturing division. Access to reports is granted via job assignments—for example, all department managers.
The viewer of the report then has the ability to reduce the amount of data further via filters. A filter, which has to be configured by the report creator, allows the selection of one or more criteria—for instance, by organization.
Important Note
A report isn't static; it is an interactive view of the data.
The next section is dedicated to each building block of the reporting workflow. Let's get started with the first (and main) part of the diagram: data and record sources.
Selecting data and record sources
In this section, we will deal with the input options for the report builder—you will learn what they are and when to use each option. Moodle Workplace supports two types of data sources: the Workplace database and the Workplace data store.
The Workplace database is the underlying database where Moodle Workplace stores its data. Courses, users, job assignments, programs, and other data—such as information about learning resources added by authors, forum posts contributed to by learners, and system settings configured by the administrator—are mostly stored in the Workplace database.
The Workplace data store contains historical information and snapshots of past events, such as course completion. We will dedicate an entire section to the data store at the end of this chapter.
The decision of what data source is used in a report is specified in the report source. A report source defines the primary type of data that will be used in a report. The set of available report sources includes data such as user profile information, course completion, certification statuses, and seminar session details. Additional report sources can be created by Moodle developers programmatically.
Let's have a look at the report sources available in Moodle Workplace. You access the management of programs via Site administration | Reports | Manage custom reports or directly via the Report builder icon in the Workplace launcher:
Figure 8.2 – The Report builder icon in the Workplace launcher
You will see a list of available reports—actually, what you will see is a report. A report of reports! In our example instance used throughout, we have already created a number of reports, as shown:
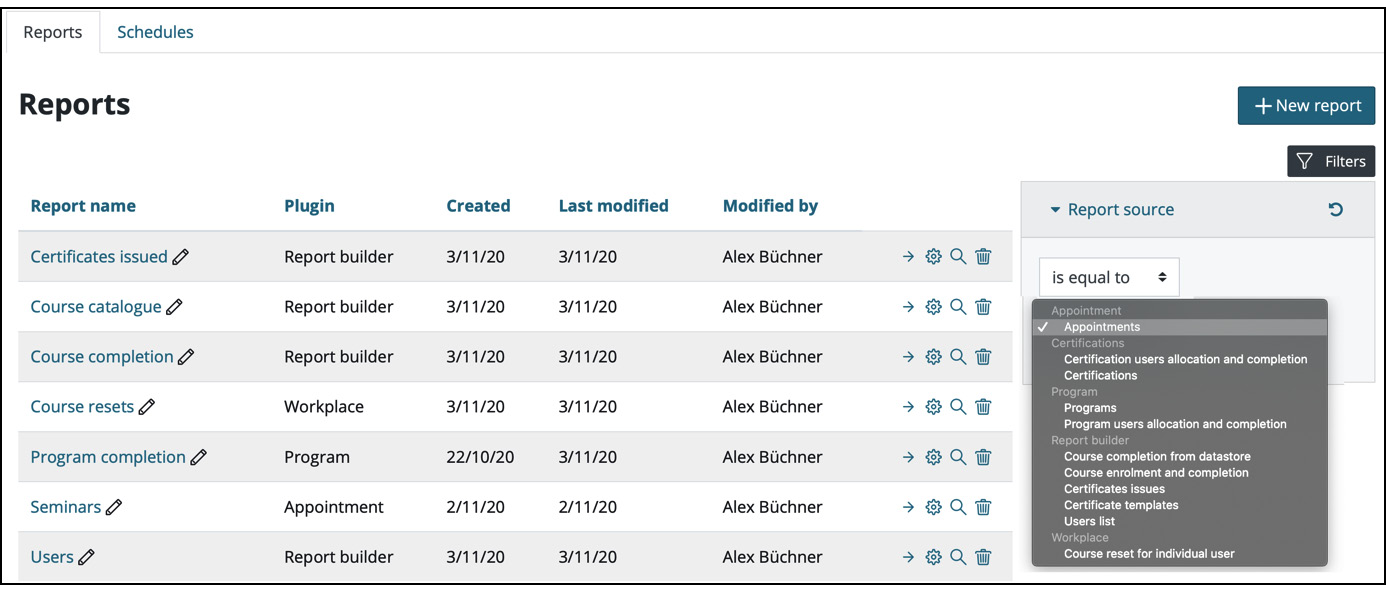
Figure 8.3 – A report of reports
The self-explanatory fields shown in the report table are Report name, Plugin, Created, Last modified, and Modified by. The standard actions/icons available are edit content, edit details, preview, and delete. There is a single filter available on the right that lets you limit the number of reports shown by selecting a report source.
Important Note
Each report has one report source.
The selected report source cannot be changed once a report has been created. To use a different report source, a new report must be created.
To create a new report, select the + New report button on the Reports page. You will then be greeted with a pop-up screen, as shown:

Figure 8.4 – Report details
A report contains the following two compulsory settings: Report name (displayed whenever the report is being made available to users) and Report source (defines where the data for the report will come from). The following report sources are currently available in Moodle Workplace:
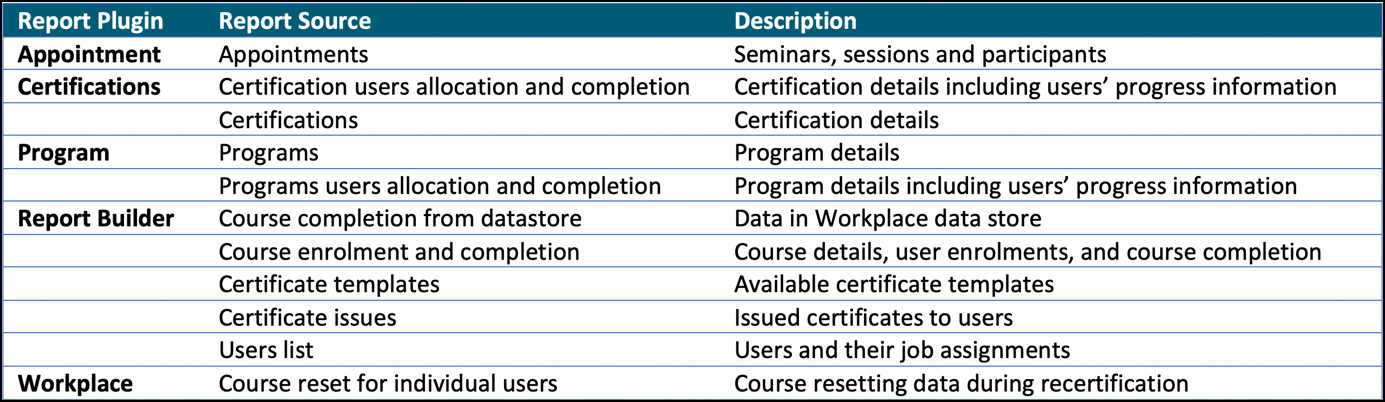
Figure 8.5 – Report sources
You can expect the number of record sources to go up in the upcoming releases. Since report sources are pluggable, additional report sources will be made available by Moodle developers, too.
There is one last setting when creating a new report: Add default configuration. When enabled, the report will already be populated with several pre-defined columns, conditions, and filters. When you get started, it is recommended that you leave this option ticked since it simplifies the building of reports, which we are going to cover next.
Building reports
In this section, we will deal with all the various facilities the report builder has on offer. You will learn what these are and how to apply them in real-world scenarios.
The report generator allows you to build and customize your own reports with a drag-and-drop option, instant preview, inline column editing, groupings, and aggregation. The following annotated screenshot shows the key elements of the Workplace report generator:
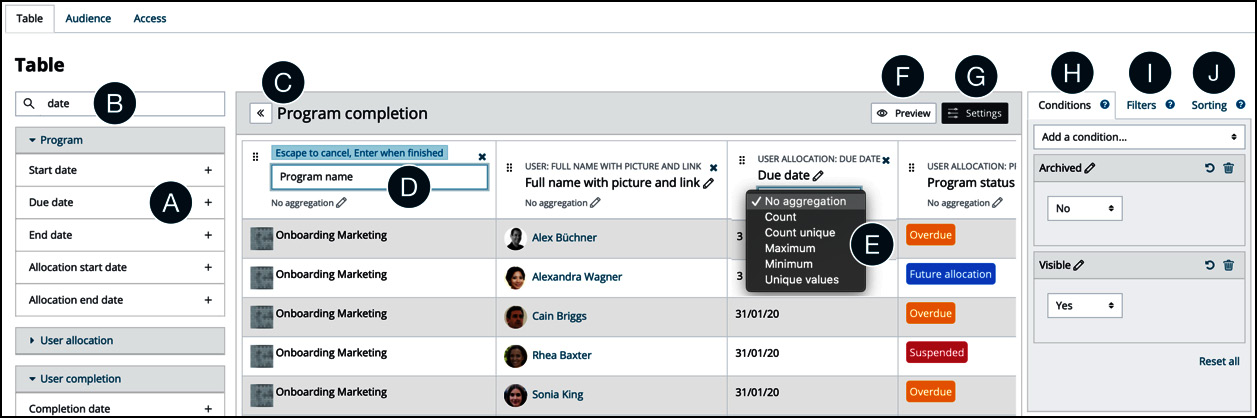
Figure 8.6 – Report generator key elements
The following actions are available in the report generator:
- A – The data field panel: List of data fields, grouped by entities
- B – The data field panel search: Live search for fields (not for entities)
- C – The data field panel toggle: The showing and hiding toggle of the data field panel
- D – The preview panel: Inline editing of column names and headings
- E – The preview panel selection: Selection of the field aggregation method
- F – The preview panel toggle: The Preview toggle
- G – The settings panel toggle: The open and close toggle of the Settings panel
- H – The settings panel tab: The Conditions tab
- I – The settings panel tab: The Filters tab
- J – The settings panel tab: The Sorting tab
Underneath the preview table, you might have spotted the Current query option. Once expanded, this shows the underlying SQL query that is generated based on the configuration of your report. For the database boffins among you, it might be helpful to map the report elements to their SQL counterparts:
- Selected data fields: SELECT … FROM …
- Conditions: WHERE
- Aggregation: GROUP BY
- Sorting: ORDER BY
Now that you have had a first glimpse of the report creation interface, let's take a closer look at the various elements, which can be grouped into two categories: configuring fields (columns) and configuring settings (rows).
Configuring fields
In this sub-section, we will deal with all available options to customize the columns in a report.
In the left-hand side panel of the Moodle Workplace report generator, you will see all available fields for the selected report source, which have been grouped into entities. Each entity can be expanded or collapsed for better usability. You can also search for field entries to limit the number of displayed items. These items have been labeled A and B in the previous screenshot.
To add columns to the report, click on the selected field in the list on the left. The column will be added automatically as the rightmost column in the table. You can then rearrange the column order via the standard Move handle. To remove a column, click on the standard delete icon.
There are three fields types available that can be added as columns to a report:
- Text fields: For example, surname, department, or course name
- Image fields: For example, program icon or user picture
- Actions: For example, sending a message to a user or viewing a progress report
Most text fields reflect a value from the underlying Workplace database. However, some text fields are preprocessed by the report generator to support additional functionality:
- Hyperlinked text fields: Mainly to direct viewers directly to entries—for example, to a user profile or a course.
- Highlighted text fields: To visualize a status. You have already come across these status fields in programs and certifications.
- Calculated text fields: To provide a numeric value—for instance, the number of courses in a program or the course progress for each user as a percentage.
- Grouped text fields: To provide multiple data points as a single cell—for example, the courses in a set of a program. The values are available one per line or comma-separated.
Custom fields, such as custom user profile fields or custom course fields, are fully supported by the report generator. They will appear in the list of available fields, such as any built-in variable. In the following screenshot, you can view a sample report (accessed via the Preview button) using the Course enrolment and completion report source containing two built-in fields (Course name and Username) plus a custom course field called Duration:

Figure 8.7 – Sample report preview
Viewers also have the option to download the table data in various formats, namely CSV, XLSX, HTML, JSON, ODS, and PDF. You can reduce or rearrange the options in that list in Site administration | Plugins | Data formats | Manage data formats. The XLSX format is useful if you wish to visualize data using Excel's charting tools.
You might wonder how you can display multiple usernames in a single cell. Well, you achieve this by using the aggregation operation, which is dealt with in the next sub-section.
Understanding aggregation and grouping
The Moodle Workplace report generator supports the aggregation and grouping operations at a column level. Depending on the data field selected, different methods are at your disposal, which are shown here:

Figure 8.8 – Report generator aggregation methods
There is no system behind what methods are available for which field type. For each data field, a set of possible aggregation methods is offered by Moodle Workplace. The exception is the last entry in the previous list—Unique values—which technically isn't an aggregation method but a grouping operation.
Important Note
Data is grouped by the Unique values aggregation method.
A more detailed view is shown in the following table, which provides descriptions for each aggregation method and the SQL function used internally:

Figure 8.9 – Report generator aggregation methods
An aggregate function calculates on a set of values and returns a single value. For example, Average takes a list of values and returns—you guessed it—the average. Because an aggregate function operates on a set of values, it is often used in combination with the grouping operator. The Unique values method divides the result set into groups of value, and the aggregate function returns a single value for each group. Have a look at the following report, which contains two fields: Department and Certified (from the Certifications record source):
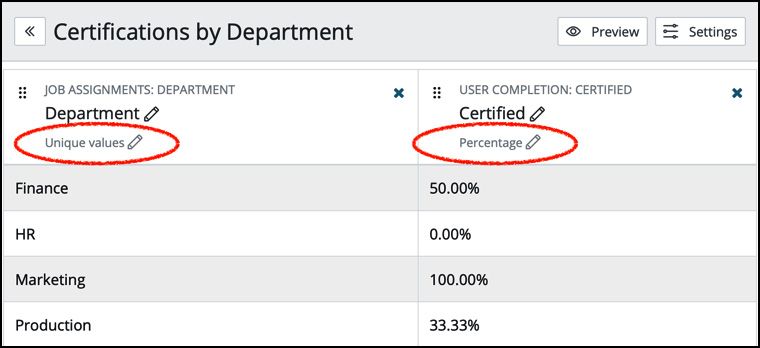
Figure 8.10 – Sample report using grouping and aggregation
The data has been grouped (Unique values) by Department and a percentage is calculated over all Certified values (1 is certified, 0 is not certified). That way, the report shows the certification level for each department. This combination is commonly used for data represented in graphs, where the grouped values represent the x axis and the aggregated values represent the y axis.
Now that we have exhausted all the options for customizing columns in a report, let's look at how to configure the second dimension in a table: rows.
Configuring settings
In this sub-section, we will deal with all the available options for customizing or limiting the rows in a report. This is done via the Settings panel on the right-hand side. Make sure you toggle the Settings icon to access the Conditions, Filters, and Sorting tabs. These configuration options will be described in the following three sub-sections.
Conditions
Conditions let you limit the number of data that is being presented to the report viewer.
Important Note
Conditions are a pre-defined set of criteria that are always applied when viewing a report. Conditions cannot be changed in viewing mode.
Depending on the selected report source, the list of available conditions might differ slightly from the list of available fields. Three interesting additional conditions for users are Has job in position, Has job in department, and Relation to the report viewer. The latter condition specifies which users should be listed in a report, relative to the person who is viewing it; the application of this is shown in the following screenshot:
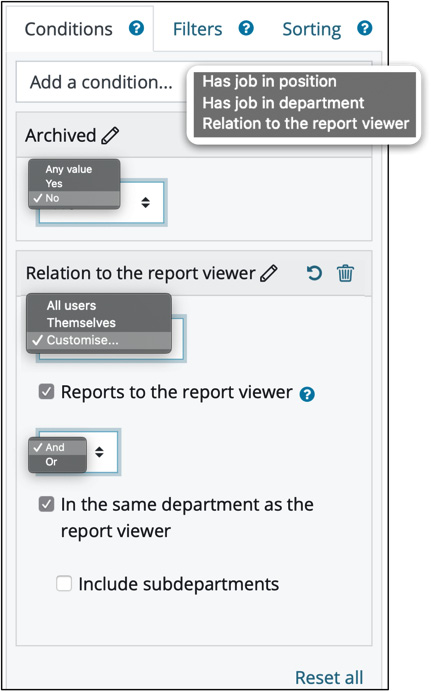
Figure 8.11 – Report generator conditions
The first condition specifies that archived programs will be excluded from the data presented to the viewer. The second condition is more sophisticated: the user entry listed in the data record has to report to the report viewer and has to be in the same department as the report viewer. The beauty of this feature is that you can create and maintain a single report that shows different results to different users, depending on their department and managerial duties. The Customise… option provides the following two user relations:
- Reports to the report viewer: For users with a managerial position, this option will include users who report directly to the user viewing the report.
- In the same department as the report viewer: Includes users who are members of the same department (optionally including sub-departments) as the user viewing the report.
If both of these options are selected, it is possible to combine them with the AND and OR Boolean operators to further refine the report content.
There is also a further relation called Themselves, which will limit the report to information relating to the report viewer.
Both relations take effect according to the user who is viewing the report, meaning it will return different results according to the report viewer and/or their own position within the organization.
Filters
The second mechanism for limiting the number of displayed records is filters. However, it is up to the report viewer to apply these.
Important Note
Filters are a pre-defined set of criteria that are not applied automatically but are available for report viewers.
The following two screenshots show the configuration of filters (left) and what the first two entries look like from a user's perspective when viewing the report (right):

Figure 8.12 – Report generator filters
You can add as many filters as you wish. Furthermore, the list of filters is not limited to the fields shown in the report. If you recall the report showing certification completion rates by department, you might add a filter to narrow the search down to individual positions, even though they are not shown in the report.
Sorting
The last of the three settings deals with the order in which the data is presented.
Important Note
Sorting defines the initial order that fields are being sorted in.
In the following screenshot, the data is ordered by Full name (in ascending order), Program status (in descending order), Due date (in ascending order), and Completion date (in ascending order):

Figure 8.13 – Report generator sorting
If we take another sneak peek at the underlying SQL query, the sorting is performed by the following ORDER BY clause:
ORDER BY c0_fullnamewithpicturelink ASC, c2_programid DESC, c2_certificationid DESC, c1_duedate ASC, c1_duedatelocked ASC, c3_completeddate ASC
When in viewing mode, the preceding order will initially be applied. Once a user has clicked on a column name, the data will be sorted by this field. When the same column is clicked again, the sort order will be reversed.
Limiting the number of custom reports
Your site administrator can restrict the number of custom reports that can be created per site and tenant, respectively, by adding the following settings to the config.php configuration file located in the main directory of your Moodle system ($CFG->dirroot), as shown:
$CFG->tool_reportbuilder_limitsenabled = true;
$CFG->tool_reportbuilder_sitelimit = <VALUE>;
$CFG->tool_reportbuilder_tenantlimit = <VALUE>;
Omitting the $CFG->tool_reportbuilder_limitsenabled configuration or setting it to false indicates that no limit should be applied to the number of custom reports that can be created. Enabling limits and setting the values to 0 will disable the creation of custom reports. Note that the tenant limit cannot exceed the site limit.
Now that we have completed the configuration of a report, the next step is to look at when the data is delivered to users.
Scheduling reports
By default, all reports are available as pull reports; that is, users have to proactively select and view a report. This section provides instructions on how to configure the automatic delivery of reports via the report scheduler, also known as push reports. Having users log in to see a report is less effective than having the report land directly in their email inbox.
To access the scheduler, select the Schedules tab of a report. You have probably already guessed it: the list of schedules is yet another system report with a pre-defined filter, as shown:

Figure 8.14 – Report scheduler
A schedule contains the following three elements, which we are going to cover in this section:
- Basic information (what and when)
- Recipients (who)
- Custom message
To create a new report schedule, select the + New Schedule button at the top right. You will then be presented with a pop-up window with the three sections mentioned in the preceding list.
Basic information
This part of the screen contains information about the schedule, including what report to send, in which format the report should be sent, and the timing settings, as shown:
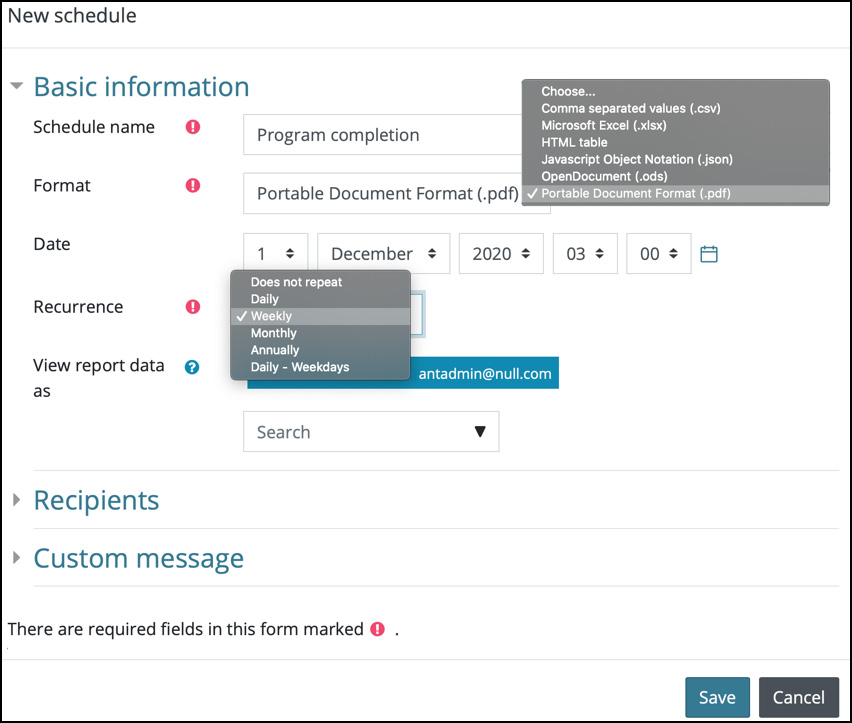
Figure 8.15 – Report scheduler—basic information
Schedule name is only used in the list of schedules. The Format dropdown lets you pick the file format of the report. The options are CSV, XLSX, HTML, JSON, ODF, and PDF. You can reduce or rearrange the options in that list in Site administration | Plugins | Data formats | Manage data formats.
The Date setting specifies when the report is to be sent for the first time. The Recurrence option lets you specify whether the report should be sent once (Does not repeat) or frequently. The repeating options are Daily, Weekly, Monthly, Annually, and Daily – Weekdays. The Moodle cron process triggers the execution of the report being sent.
The last setting in this section is View report data as. If a user is selected, the attached report data will be included as if viewed by this masquerading user; that is, all recipients will receive the same report. If left empty, the recipient of the report will be used; depending on the way the report has been configured, individual reports will be sent out. How do you specify who the recipients are? That is covered in the Audience part of the schedule, which will be covered in the Audience and access section later.
Recipients
In the Recipients section, you select who will receive the report by email. There are four settings available (which can be used in any combination)—by department, by position, individual users, and externals:
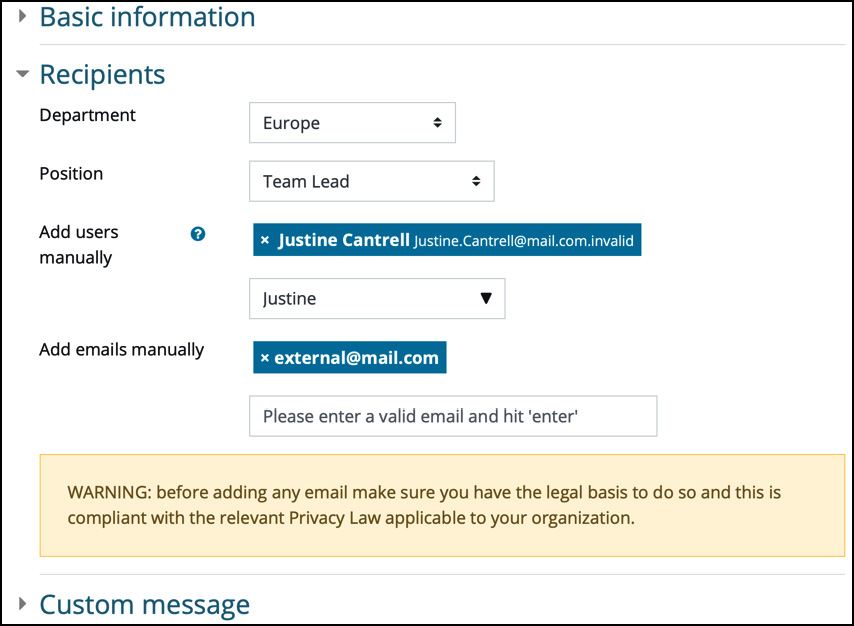
Figure 8.16 – Report scheduler—audience
You can choose Department and Position, respectively. Unfortunately, at the time of writing, there is no option to include sub-departments or sub-positions. You can also add users manually; these are users from the current tenant.
In addition to internal users, there is an option to include external users via the Add emails manually setting. When you add recipients manually, make sure you read the displayed warning message, which reads before adding any email make sure you have the legal basis to do so and this is compliant with the relevant Privacy Law applicable to your organization.
Now that we have specified who is going to receive the report, we will need to configure the accompanying message that will be sent out.
Custom message
The third and final part of a reporting schedule contains the custom message, which includes the two standard elements of any email message: Subject and Message. Currently, no placeholders are supported, so you will have to tailor the message text accordingly:

Figure 8.17 – Report scheduler—custom message
Make sure you save the schedule. To test what the message looks like, you should add yourself to the receiving audience and then use the Send action in the list of schedules.
You can create as many schedules for each report as required. You can further enable and disable each schedule using the toggle in the first column of the list of schedules.
To access the schedules of all reports, select the Schedules tab in the main Report builder menu. The list of schedules you see here is effectively the same as before but with the following differences:
- An additional column to list the report name
- An additional filter to filter by Report name
You can also create schedules from here using the same + New schedule button. The pop-up screen is the same as before but with one additional field where you need to select the report that the schedule is for. The selected record cannot be changed once a schedule has been created. To use a different report, a new schedule must be created. If a report is deleted, any schedules that make use of this report will also be deleted.
So far, we have covered what data a report contains (data and record sources, column fields, conditions, filters, aggregation, and groupings) and when the data is delivered to users. Next, let's look at who is allowed to view reports by restricting access to specific audiences.
Granting access to reports
By default, all users with permission to view tool/reportbuilder:read or manage the tool/reportbuilder:edit report can view all the custom reports defined in their tenant. Additionally, it is possible to specify the individual jobs that will be granted access to the reports. We are going to cover this in the next sub-section before adding links to reports to the main menu.
Audience and access
To specify which users should be able to access a report, select the Audience tab when editing the report. You can add as many job assignments to set the audience for the report as necessary via the Add job button. You then need to select the required position and department, as in the following screenshot:

Figure 8.18 – Report audience
In our example, all the marketing managers in Europe and all the sub-departments will be allowed to view the report, as well as all the team leads, regardless of their department.
To confirm which users have access to the report, switch to the Access tab at the top. You will then be presented with a table showing the full names of users, including a user picture, their position, and the department. A sample list of users is shown here:
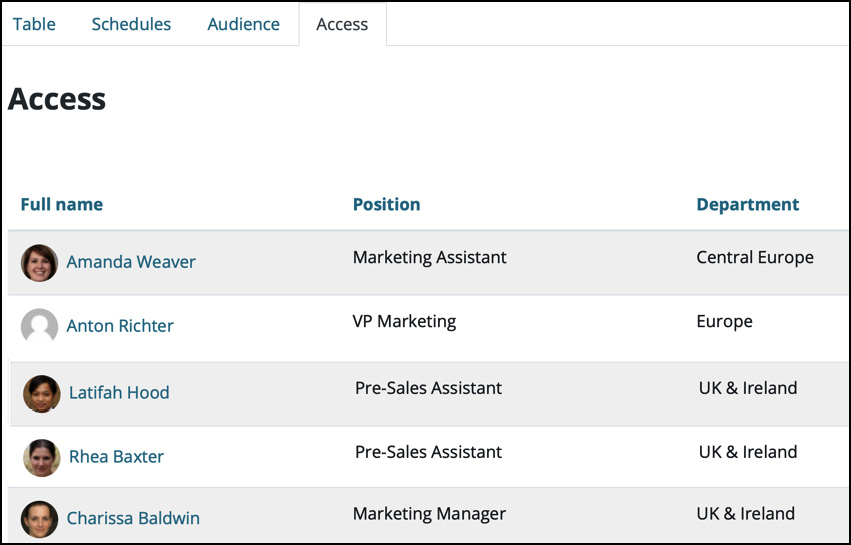
Figure 8.19 – Report access
You probably guessed that the list showing the users who are allowed to access the report is yet another system report.
In addition to granting user access to reports, it is also possible to specify which users should be listed in any given report. We already dealt with this in the Configuring settings sub-section when we introduced the Relation to the report viewer condition.
Now that we know how to grant access to the report, let's look at a neat way of how users can quickly and intuitively navigate to their reports.
Adding reports to the custom menu
Users who have been granted access can open a report via the Report builder icon in the Workplace launcher. A potentially attractive alternative is to add a link to the report on the main menu. That way, it appears to the user that the report is part of the learning management system.
Important Note
By using custom menus and reporting, you can extend the functionality of Moodle Workplace without using a single line of code!
To add a report to the main menu, you need to run through the following steps:
- Select Report builder in the Workplace launcher to get to the table of reports.
- Click on the preview icon (the magnifying glass) beside the report you wish to add to the main menu.
- Copy the URL of the report to the clipboard.
- Go to Site administration | Appearance | Theme settings.
- Scroll down to Custom menu items and add a menu item name and the copied URL to the list, separated with | (a pipe symbol).
The new menu item will appear in the menu for all users.
The following screenshot shows a sample entry and the resulting custom menu, including a sub-menu as well as a menu separator:
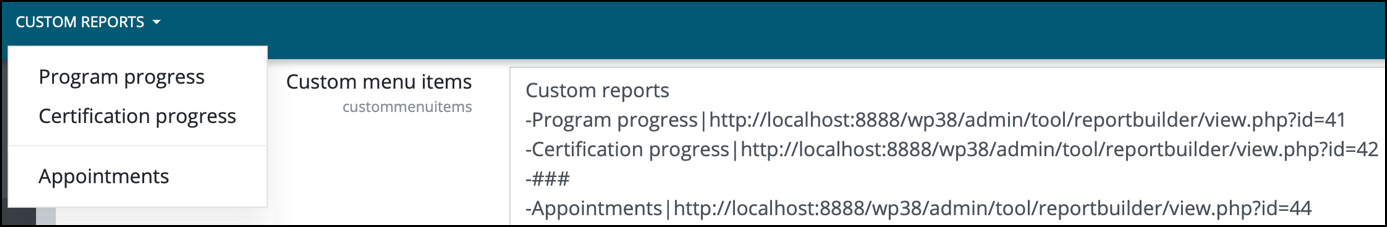
Figure 8.20 – Adding a report as a custom menu item
For more details on how to customize Moodle's menu, check out the help page in the Moodle documentation at docs.moodle.org/en/Theme_settings#Custom_menu_items.
This concludes the main section of this chapter on reporting. Finally, let's take a closer look at the Workplace data store, which we briefly mentioned earlier.
Exploring the Workplace data store
The Workplace data store is a permanent record store used to keep track of course completions. Additionally, the data store supports course completions that were carried out outside Workplace but have to be tracked in Workplace.
Initially, you need to enable the data store at Site administration | Reports | Data store settings. On the same screen, you can also specify which user and course fields can be stored in the data store:

Figure 8.21 – Data store settings
Once the data store has been enabled, the course completion data will be stored permanently, alongside specified user data. This information also supersedes course resets or user deletions. Additionally, it is possible to populate the data store with external data via the course completion CSV upload.
Any user who has the tool/datastore:uploadcoursecompletion capability can upload course completion data, which will be stored in the data store for users who belong to the same tenant as themselves. The CSV file import has been extended with two new fields to support the course completion data:
- coursecompleted: The short name of the course that has been completed. The course has to exist before the upload is started.
- coursecompleteddate: The date that the course was completed on. You need to use the YYYY-MM-DD ISO standard format, which will then be localized during the upload process. If this variable is omitted, the date of the day you are filling it out will be used.
Both variables have to have a numeric postfix to support multiple courses. The following is a sample CSV file that uploads three course completions for two users:
username,coursecompleted1,coursecompleteddate1
user1,crsNegotiations,2020-02-26
user1,crsMoneyLaundering,2020-01-01
user2,crsNegotiations
Once you have created your CSV file, go to Users | Accounts | Upload users in the Site administration section and follow the upload process using your CSV file.
As soon as records are stored in the data store, use the Course completion from datastore report source to create reports. When and why would you make use of the data store and its reporting facility? There are two scenarios where using the data store would be useful:
- When you have to incorporate the historical data of your learners in Workplace, you can add these records using the course completion upload facility.
- For auditing or other legislative exercises, data often has to be kept for longer than it is stored in the learning management system or after staff have left the company.
At the time of writing, the data store is in its infancy and it is expected that more xAPI-compatible operations will be made available in future releases.
Summary
In this chapter, you learned how to manage reports and how to grant access to different audiences in your organization.
We first dealt with the inner workings of the report builder and how data is processed. We then looked at different data and record sources, which you used to create new custom reports.
To customize reports, you applied conditions, filters, aggregation, groupings, and sorting. While these already provide a comprehensive and flexible set of operations, there is a crucial feature missing that would make the report builder even more useful—the ability to display aggregation and grouped data in a separate footer row (for example, to provide the sum of all attendees below a table). Currently, two separate reports are needed to provide this data, which is not ideal.
Once our reports were created and configured, we looked at different ways of how to schedule reports to be sent automatically to users and how to grant access to the reports. We concluded this chapter by using the built-in Workplace data store to handle permanent data that might exceed the lifetime of your courses or staff.
One last point—don't build reports unless they will be used. Just giving information to people doesn't work, unless there is an agreed expectation of action on the data within a report. It is too easy to assume someone will act upon a report, but if there isn't a process and agreement for them to act, the report has little value and potentially frustrates everyone involved.
With the skills you have acquired, you are now able to provide your colleagues with valuable data about their personal training progress and managers with data about their teams' learning development.
One report source we briefly mentioned but didn't go into great detail about is called Appointments, which deals with face-to-face training. In-person activities or classroom-based training will be the subject of the next chapter on seminar management.