© The Author(s), under exclusive license to APress Media, LLC, part of Springer Nature 2022
J. M. RhodesCreating Business Applications with Microsoft 365https://doi.org/10.1007/978-1-4842-8823-8_11

11. Overcoming Power Apps Delegation Issues with SharePoint and Excel Data Sources

Jeffrey M. Rhodes1  
(1)
Colorado Springs, CO, USA
 

In this chapter, we look at how to address a major issue for Power App developers – delegation. This is a huge challenge for the most common types of applications we develop, those with SharePoint data sources. Not being limited to 500 or 2000 records is a huge improvement for these applications.

For performance reasons, Power Apps will delegate processing to its data sources. Microsoft spells it out this way1:

Delegation is where the expressiveness of Power Apps formulas meets the need to minimize data moving over the network. In short, Power Apps will delegate the processing of data to the data source, rather than moving the data to the app for processing locally.

Things get challenging when we want to perform a task like Filter() with parameters that don’t support delegation. This chapter will demonstrate this issue and then show you a nice workaround.

Demonstrating Delegation Issues with Excel

Our data source starts as an Excel spreadsheet with links from my Music Genius application for iOS, MacOs, Google Play, and Windows Store.2 Figure 11-1 shows the first 16 rows of the 3522 in the file.

A table of 4 columns and 16 rows. The column headers are group, song, album, and link.

Figure 11-1

Music Genius Excel Data Source

We ensure our data is an Excel table3 and then upload this file to a SharePoint document library. We then use the Excel Online (Business) data source , as shown in Figure 11-2.

A screenshot of a data tab. The tab lists options such as add data with select a data source option. A cursor points to excel online and is highlighted.

Figure 11-2

Adding the Excel Online Data Source

Since there is no index column in the table, the Excel Online connector will create one for us. But we are not able to see it programmatically and thus can’t use it for our “getting around delegation” solution. But we could have added one and used the same solution as we will show later for SharePoint.

Figure 11-3 shows when there are no delegation issues.

A screenshot of an excel data source with no delegation issues. The source lists the names of 3 songs with the album, artist, and link.

Figure 11-3

Excel Example with No Delegation Issues

It might look like we have issues, since the number of items shows only 100. Here is the Text of that label:
"Number of Items: " & CountRows(MusicGallery.AllItems)
But Power Apps is just loading the number of rows needed by the gallery. If we scroll down, the number jumps to 200, 300, etc. That is because the Filter argument (StartsWith()) for the gallery’s Items property can be fully delegated to Excel:
Filter(Table1, StartsWith(Song, SearchBox.Text))
Similarly, I could have used the in operator and still been delegable:
Filter(Table1, SearchBox_1.Text in Song)
But when I add an Or to our filter, so that we can look for either the song or the group, we run into delegation issues:
Filter(Table1, SearchBox_1.Text in Song || SearchBox_1.Text in Group)
Figure 11-4 shows the delegation warning.

A screenshot of an excel data source with delegation issues. A cursor points to the delegation warning and the number of items, 500 is highlighted.

Figure 11-4

Delegation Warning with the Or Operator

Note that the Number of items changes to 500, which is the default Data row limit, as shown in Figure 11-5.

A screenshot of a settings panel. The options listed for the general option under settings are icon, background fill, icon fill, auto-save, and row limit.

Figure 11-5

Data Row Limit Setting in Power Apps

We can increase this value to 2000, but we are stuck beyond that. Power Apps goes ahead and grabs that number of records, but all filtering occurs with just those 500 or 2000 records.

Demonstrating Delegation Issues with SharePoint

Before we copy our spreadsheet into a SharePoint list and demonstrate the delegation issue, we skip forward toward our solution4 by noting that we need a numeric column other than the SharePoint list’s Id column in order to read our data source and load it into a collection. For that, we will need a Power Automate flow to run each time we create a SharePoint list item. We might as well create that first so we get this ID_Numeric column to load for each row we paste in.

We create the MusicGeniusLinks list with the columns to match the Excel spreadsheet (Group, Song, Album, Link) as well as the new ID_Numeric column. As shown in Figure 11-6, we create an automated cloud flow with the trigger of when an item is created.

A screenshot of build an automated cloud flow tab. The tab has a flow name, a checkbox for when an item is created, and a create option at the bottom.

Figure 11-6

Creating the Power Automate Flow to Update ID_Numeric

We choose the site address and the name of our list, add a step, and then search for SharePoint actions (Figure 11-7).

A screenshot of adjacent tabs. The tab titled when an item is created points to choose an operation box. A cursor points to the SharePoint option under operation.

Figure 11-7

Selecting SharePoint Actions

We search for Update so we can find the Update item action (Figure 11-8).

A screenshot of the SharePoint tab. A cursor points to the update item option under actions.

Figure 11-8

Updating the SharePoint Item

A screenshot of the update item tab. A cursor points to I D under dynamic content on the right. Arrows from I D point to I D and I D numeric of the item tab.

Figure 11-9

Adding ID to both the ID and ID_Numeric columns

We need to give values for each required column (shown by the * to the left of the column name). We choose ID for both the Id column5 AND the new ID_Numeric column.

Now that we have our flow set up, it is time to import our data. As shown in Figure 11-10, I like to copy the Excel rows and then go to grid view in SharePoint and then select the columns I want to paste.6

A screenshot of a tab with options and the new option highlighted. A cursor points to a box at the bottom to add a new item.

Figure 11-10

Pasting Excel Data into the SharePoint List

We then paste via Ctrl + V. This ends up taking quite a bit of time as our flow has to run for each of our 3522 rows. We can go back to Power Automate and check our run history to make sure all is working correctly (Figure 11-11).

A screenshot of a tab of a 28-day run history. The history has 3 columns and 7 rows. The column headers are the start, duration, and status.

Figure 11-11

Power Automate Flow Run History

Once the list is fully populated, we connect it as a data source in Power Apps. We get the same delegation success/failures based on how we Filter() as we had with Excel (Figures 11-3 and 11-4). But now we have another workaround. As we see in Figure 11-12, we have a LoadCollectionButton that contains all our code. We programmatically execute this code in response to the OnVisible event for our screen using this syntax:
Select(LoadCollectionButton)
We use the button because there are other times7 where we also want to reload the collection, such as when we click on a “Refresh” button and after we add, edit, or delete records from our data source.

A screenshot of Share Point data source issues. The Screens option under Tree view on the left is highlighted. On the right is a load collection button.

Figure 11-12

Selecting the LoadCollectionButton in the OnVisible Event

Let’s look at each section of our OnSelect code, starting with the Reset functionality in Listing 11-1.
// Thanks to Microsoft for this post and to Anthony Apodaca for finding/implementing it:
// https://powerusers.microsoft.com/t5/Building-Power-Apps/500-item-limit-in-CDM-entity-search-filter-need-to-switch-to-asp/m-p/22980#M9872
// Start Process
Refresh(MusicGeniusLinks);
// in case just added an item
// unload staging collections
Clear(colNumTemp);
Clear(colDummy);
Clear(colNumbersTable);
Clear(varCounter);
Clear(colIterations);
Clear(linksCollection);
Listing 11-1

Load Collection Code : Reset

We start with some comments and then Refresh our data source. This is needed in case we or another user recently added, edited, or deleted a record. We then clear all the variables/collections that we use in the code to come. linksCollection is our final output and what we will use in our filter. Since it is a collection internal to Power Apps, it does not have the same delegation restrictions as our Excel or SharePoint data sources.8

Next, we create our colNumTemp collection (Listing 11-2).
// Generate series. This can retrieve ~ 500,000 to 2 million records
Collect(
    colNumTemp,
    [
        1,
        2,
        3,
        4,
        5,
        6,
        7,
        8,
        9,
        10
    ]
);
Listing 11-2

Load Collection Code: Generate colNumTemp

This is basically an array of ten cells that will hold sets of records. We can go to File ➤ Collections in Power Apps to see a preview of how it looks (Figure 11-13).

A screenshot of a collections panel. A cursor points to the col Num temp option under collections. col Num temp has values from 1 to 5 on the right.

Figure 11-13

The first five items in the colNumTemp collection

Our next task is to generate another collection, colNumbersTable (Listing 11-3).
ForAll(
    colNumTemp,
    ForAll(
        colNumTemp,
        ForAll(
            colNumTemp,
            Collect(
                colDummy,
                {dummy: 1}
            );
            Collect(
                colNumbersTable,
                {Number: CountRows(colDummy)}
            )
        )
    )
);
// End Generate Series
Listing 11-3

Load Collection Code: Generate colNumbersTable

This is our first introduction to the ForAll() function.9 It has two parameters, the Table to be operated on and the Formula to use. Let’s start with the inside set of code:
        ForAll(
            colNumTemp,
            Collect(
                colDummy,
                {dummy: 1}
            );
This operates on the colNumTemp collection that we created earlier. For each value (1, 2, 3, etc.), it creates a colDummy collection, with a single item named dummy and a value of 1. Figure 11-14 shows how this looks in the preview mode.

A screenshot of the collections panel. col Dummy option under collections is highlighted. On the right, the dummy lists 5 items marked by 1.

Figure 11-14

The colDummy collection

The effect of naming the item changes the heading from Value (Figure 11-13) to dummy. Since we are using Collect rather than ClearCollect, each time that ForAll() loops, it will add records to the collection. Similarly, this code runs next:
            Collect(
                colNumbersTable,
                {Number: CountRows(colDummy)}
            )
This adds items to the colNumbersTable collection and creates a Number with a value of the number of rows in the colDummy collection (1 then 2 then 3, etc.). Figure 11-15 shows the result.

A screenshot of a collections panel. col Numberstable option under collections is highlighted. colNumberstable has numbers from 1 to 5 on the right.

Figure 11-15

The colNumbersTable collection

The result so far is that both colDummy and colNumbersTable have 10 rows. colDummy has a 1 in each item while colNumbersTable has 1, 2, 3, etc. But this was all inside two more ForAll() loops, as we see in the following.
ForAll(
    colNumTemp,
    ForAll(
        colNumTemp,
        <run code above>
    )
);

The inside loop runs ten more times, giving us 100 items in both colDummy and colNumbers. The outside loop runs ten times as well, leading to 1000 items in both collections.

Next up are some variables to keep us organized. Since they only need to live on the current screen, we use context variables, as shown in Listing 11-4.
// Obtain first and last record
UpdateContext(
    {
        FirstRecord: First(
            Sort(
                MusicGeniusLinks,
                ID,
                Ascending
            )
        )
    }
);
UpdateContext(
    {
        LastRecord: First(
            Sort(
                MusicGeniusLinks,
                ID,
                Descending
            )
        )
    }
);
// Begin iteration
UpdateContext(
    {
        Iterations: RoundUp(
            (LastRecord.ID - FirstRecord.ID) / 500,
            0
        )
    }
);
//Create new collection to temporarily store our first ID to capture
ClearCollect(
    varCounter,
    {min_Num: FirstRecord.ID}
);
Listing 11-4

Load Collection Code: Set Variables

Looking first at the FirstRecord variable , the Sort() function takes three parameters: the table, the formula, and an optional sort order (Ascending or Descending). Power Apps again delegates this operation to the data source (SharePoint in this case), but luckily SharePoint doesn’t impose the 500- or 2000-item cap in this case. Since we want the first record, we sort Ascending. Our formula is to do our sorting by the ID column. We then use the First() function to grab the first item. For LastRecord, we just change the sort to Descending, which puts the highest ID first.10

Our next challenge is to figure out how many Iterations we are going to need to read all our records. We use this formula:
RoundUp((LastRecord.ID - FirstRecord.ID) / 500, 0)
In our case, LastRecord.ID = 3522 and FirstRecord.ID = 1. This gives us 7.04 but we round up to 8 (with no decimal places).11 It is important that the divisor (500 here) either match or is smaller than the Data row limit (see Figure 11-5). Otherwise, delegation limits will kick in again.12 Figure 11-16 shows how we can see these variable values within the Power Apps environment.

A screenshot of a variables panel. Use the collection to avoid delegation under the variables highlighted. On the right are options to select a variable.

Figure 11-16

FirstRecord , LastRecord, and Iterations Variables

Our last variable, varCounter, stores which ID we are on. We name its value min_Num and set it to FirstRecord.ID. We can already guess that we will loop through sets of records and update this variable to keep track of where we are.

We are now ready to finally start reading all our data. Listing 11-5 shows our code.
/* Using a ForAll loop where column number is less than or equal to the number of iterations
Update iteration collection with current iteration number, min, and max numbers
Update counter collection */
ForAll(
    Filter(
        colNumbersTable,
        Number <= Iterations
    ),
    Collect(
        colIterations,
        {
            Number: Last(
                FirstN(
                    colNumbersTable,
                    CountRows(colIterations) + 1
                )
            ).Number,
            min_Num: First(varCounter).min_Num,
            max_Num: First(varCounter).min_Num + 499
        }
    );
    Patch(
        varCounter,
        First(varCounter),
        {
            min_Num: Last(
                FirstN(
                    colIterations,
                    CountRows(colIterations) + 1
                )
            ).max_Num + 1
        }
    )
);
// End iteration capture
Listing 11-5

Load Collection Code: Loop to Read Records

Recall that the ForAll() function requires a Table and a Formula. Our table is the result of this line:
Filter(colNumbersTable, Number <= Iterations)
Since Iterations is 8 in our case, this gives a table with 1 in the first item, 2 in the second, and on up to 8 in the eighth item. See Figure 11-15. For each value (1–8), we run this code:
Collect(
        colIterations,
        {
            Number: Last(
                FirstN(
                    colNumbersTable,
                    CountRows(colIterations) + 1
                )
            ).Number,
            min_Num: First(varCounter).min_Num,
            max_Num: First(varCounter).min_Num + 499
        }
    )
We build a new collection, colIterations , item by item. It has three columns: Number, min_Num, and max_Num. Let’s look at Number first:
Number: Last(FirstN(colNumbersTable, CountRows(colIterations) + 1)).Number

Working from the inside, the FirstN() function takes a table as the first parameter and the number of records to return as the second parameter. As we saw earlier, colNumbersTable has eight items in our case. colIterations starts with 0 rows and adds a row each time. So we read one record the first time, two the second time, and so forth. Since we get the Last() record and then grab its Number value, this will be 1, 2, 3, etc.

For min_Num, we refer back to Listing 11-4 to note that varCounter.min_Num means the ID of our FirstRecord variable. So this will be 1 the first time around. To get max_Num, we add 499 to it. It is important that this is one less than the value we used in defining our Iterations variable in Listing 11-4. That was 500 in our case.

All that is left is for us to update our varCounter collection variable so we can store the beginning and ending IDs for each set of records:
Patch(varCounter, First(varCounter),
        {
            min_Num: Last(
                FirstN(
                    colIterations,
                    CountRows(colIterations) + 1
                )
            ).max_Num + 1
        }
)
The Patch() function is used to update data sources, but that can be a collection as well. It has three parameters: the data source, which record to update, and the value(s) to be changed. varCounter is the data source and its first record is what to update. Since our formula for min_Num parallels that for the colIterations collection, we can refer to Figure 11-17 for insight into the values.

A screenshot of a collections panel. The collterations option under collections is highlighted. On the right, collterations has num, max n, and min n table.

Figure 11-17

The colIterations collection

The first time around, we are in the first row and max_Num will be 500. varCounter.min_Num will equal that value + 1 (e.g., 501).

The ForAll() loop will start again and jump to populate the next row of colIterations with the first five items showing in Figure 11-17.

With all this legwork out of the way, we can now load our linksCollection with the code in Listing 11-6.
/* Finally, with a ForAll loop we collect all our items
** Cannot use ID column to do delegations! **
We use ID_Numeric instead */
ForAll(
    colIterations,
    Collect(
        linksCollection,
        Filter(
            MusicGeniusLinks,
            ID_Numeric >= min_Num && ID_Numeric <= max_Num
        )
    )
);
Listing 11-6

Load Collection Code: Creating linksCollection

We start with some comments and then use our old standby, ForAll(). We loop through each record of colIterations (Figure 11-17) and use the Collect() to build our linksCollection in sets of 500 records. We see now why we created our Power Automate flow to populate the ID_Numeric column of SharePoint list. We use it to Filter() our list and get the records we want. Note that this filter is subject to delegation limits and thus our min_Num and max_Num values need match our Data row limit as discussed in Footnote 12. Here is how our filter line looks for the first two iterations of our ForAll() loop :
        Filter(MusicGeniusLinks, ID_Numeric >= 1 && ID_Numeric <= 500)
        Filter(MusicGeniusLinks, ID_Numeric >= 501 && ID_Numeric <= 1000)

The Final Result

Now that we have a linksCollection that contains all our data locally, we just need to change the Items property of our gallery to use that collection instead of our Excel or SharePoint data source:
Filter(linksCollection, SearchBox_2.Text in Song || SearchBox_2.Text in Group)
Figure 11-18 shows our completed app. Since our Excel file was sorted by Group, we test by searching for ZZ Top and notice that we are retrieving items 3478 and 3479, way above even the maximum 2000 record limit if we were querying SharePoint directly. Whew!

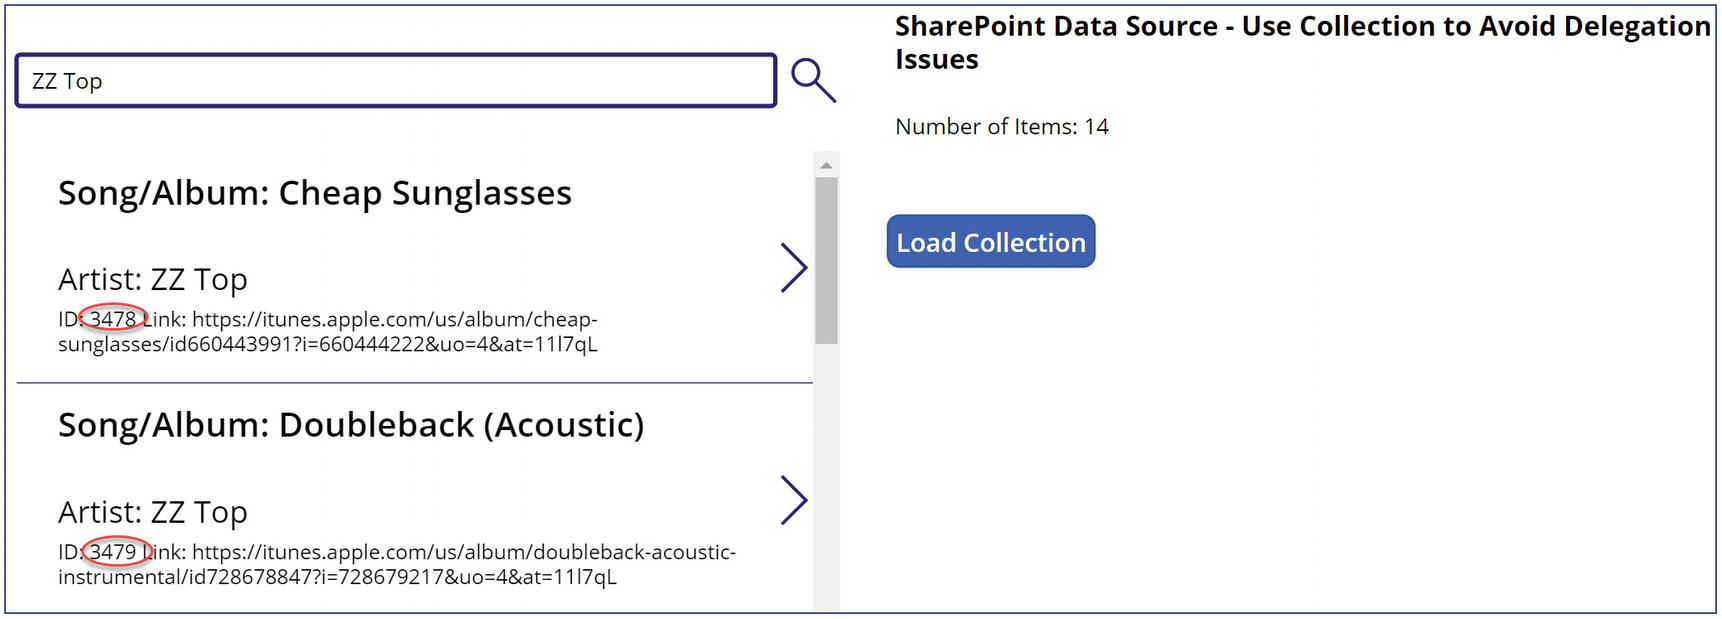
A screenshot of the SharePoint data source issues. I Ds 3478 and 3479 of song slash album are highlighted. Load collection button is on the right.

Figure 11-18

Power App showing records above the delegation limit

Summary

In this chapter, we learned how to use Power App collections and methods like Collect(), ClearCollect(), ForAll(), and Patch() to avoid the dreaded delegation issues with SharePoint or Excel data sources. While there is a bit of code, you will be able to breathe a sigh of relief once you have this nailed down. Otherwise, what looked to be the perfect solution to a key business problem instead could fail once you exceeded 2000 records. Once you have this technique at your disposal, you can then look closely at your data to decide when it makes sense to add this extra step to your applications.

..................Content has been hidden....................

You can't read the all page of ebook, please click here login for view all page.
Reset
18.222.252.11