© The Author(s), under exclusive license to APress Media, LLC, part of Springer Nature 2022
J. M. RhodesCreating Business Applications with Microsoft 365https://doi.org/10.1007/978-1-4842-8823-8_14

14. Visualizing Learning Management Data from SQL Server Using Power BI

Jeffrey M. Rhodes1  
(1)
Colorado Springs, CO, USA
 

I have done quite a bit of reporting over the years, from text-based reports with ToolBook applications, Crystal Reports from within VB 6 applications, SQL Server Reporting Services, and, one of my favorites prior to Power BI, Microsoft Report Viewer. In this chapter, I wanted to explore how a Report Viewer implementation might be adapted for Power BI. So I chose one of our own products, our Tracker.Net Learning Management System (LMS).1 It expands on our previous “direct to SQL Server” example. We have a simpler database structure and show how we can test our query in SQL Server Management Studio and then implement it directly within Power BI. We also look at the important topic of how to edit your drill-down interactions so they filter the other visuals rather than highlight their matching values.

Report in Tracker.Net

Let’s first take a quick look at the original interface. As shown in Figure 14-1, Tracker.Net allows a user with “Reporter ” access to select between Student, Lesson, Course, Class, Organization, and Division reports. Here we select all the lessons and then choose the Student Information* report.2

A screenshot of a tracker net window. Under the lessons tab, the reports tab is open. A file named student information is selected in the drop-down menu.

Figure 14-1

Selecting a Report in Tracker.Net

The user then selects the Display button to see the result in Figure 14-2. Microsoft’s Report Viewer control gives the interface with the layout controlled by its *.rdlc file.3

A screenshot of tracker net window. It has a table for the student information. 2 files of Jimi Hendrix and James McMurtry are selected.

Figure 14-2

Microsoft Report Viewer Display in Tracker.Net

Since I am using what Report Viewer calls ProcessingMode.Local , our .NET code connects to the database directly, runs our query (taking account of the selected lesson(s) and the report requested),4 and then sets the report’s DataSource property. Figure 14-3 shows how this looks in SQL Server Management Studio when grabbing all lesson data.

A screenshot of a window. It has a drop-down menu to track organizations, students, student lesson information, and lessons. Below them are 2 tables.

Figure 14-3

Query in SQL Management Studio

Notice how the query joins the Organizations, Students, StudentLessonInformation, and Lessons tables. Notice also how there are 333 total records. We will check this when we get to Power BI. Listing 14-1 shows the Standard Query Language (SQL) query :
SELECT TOP (100) PERCENT Tracker_Lessons.LessonID, Tracker_Lessons.LessonLongName, Tracker_Students.LastName, Tracker_Students.FirstName, Tracker_StudentLessonInformation.CompletionStatus, Tracker_StudentLessonInformation.FirstCompletionDate, Tracker_StudentLessonInformation.MostRecentCompletionDate, Tracker_StudentLessonInformation.ExpirationDate, Tracker_Lessons.LessonDescription, Tracker_Lessons.CurrencyDaysFlag_Critical, Tracker_Lessons.CurrencyDaysFlag_Alert, Tracker_StudentLessonInformation.RawScore, Tracker_StudentLessonInformation.ScaledScore, Tracker_StudentLessonInformation.RawScore / NULLIF (ISNULL(Tracker_StudentLessonInformation.MaxScore, 100), 0) AS PercentScore, Tracker_StudentLessonInformation.SuccessStatus, Tracker_StudentLessonInformation.CumulativeLessonTime, Tracker_StudentLessonInformation.StudentID, Tracker_Organizations.Organization, Tracker_Students.LastName + ', ' + Tracker_Students.FirstName AS StudentInfoLF, Tracker_Students.FirstName + ' ' + Tracker_Students.LastName AS StudentInfoFL, Tracker_Students.MiddleInitial, Tracker_Students.SocialSecurityNumber, Tracker_Students.Department, Tracker_Students.TelephoneNumber, Tracker_Students.Email, Tracker_Students.FaxNumber, Tracker_Students.Telephone2, Tracker_Students.CellPhone, Tracker_Students.Pager, Tracker_Students.Identifier0, Tracker_Students.Identifier1, Tracker_Students.Identifier2, Tracker_Students.Identifier3, Tracker_Students.Identifier4, Tracker_Students.Identifier5, Tracker_Students.Identifier6, Tracker_Students.Identifier7, Tracker_Students.Identifier8, Tracker_Students.Identifier9, Tracker_Students.Administrator, Tracker_Students.Reporter, Tracker_Students.DateIdentifier, Tracker_Students.EmploymentStatus, Tracker_Lessons.UseCEUCertificate, Tracker_Lessons.CreditValue, Tracker_Lessons.CreditType, Tracker_Lessons.AccreditationInfo
FROM   Tracker_Lessons INNER JOIN Tracker_Students INNER JOIN Tracker_StudentLessonInformation ON Tracker_Students.StudentID = Tracker_StudentLessonInformation.StudentID INNER JOIN Tracker_Organizations ON Tracker_Students.OrganizationID = Tracker_Organizations.OrganizationID ON Tracker_Lessons.LessonID = Tracker_StudentLessonInformation.LessonID
WHERE (Tracker_Lessons.Inactive IS NULL OR Tracker_Lessons.Inactive = 0) AND (Tracker_Students.EmploymentStatus IS NULL OR Tracker_Students.EmploymentStatus = 0)
ORDER BY Tracker_Lessons.LessonLongName, Tracker_Students.LastName, Tracker_Students.FirstName
Listing 14-1

SQL Query joining the Organizations, Students, StudentLessonInformation, and Lessons tables

We join the four tables, do some logic so that we don’t divide by zero when calculating the percentage test score, concatenate names in both Last Name, First Name and First Name Last Name format, and then exclude inactive students and lessons in our WHERE clause.

Connecting to and Transforming the Data

We are now ready to move to Power BI. We create a new report in Power BI Desktop and choose to get data from SQL Server, as shown in Figure 14-4.

A screenshot of a window. Under the home tab, a drop-down menu to get data is open. A file named S Q L server is highlighted.

Figure 14-4

Get Data from SQL Server

Figure 14-5 shows resulting dialog.

A screenshot of a window headed S Q L server database. It has options for server, database, command timeout, and S Q L statement with an ok button.

Figure 14-5

SQL Server Query Inside Power BI

We enter the Server,5 Database , .and the Data Connectivity mode . Since this is a small data set, importing the entire query will work fine. For larger data sets, we could use DirectQuery, which does not load any data during development, but instead just loads the tables and columns. It then queries the data when used. We open the Advanced options and then paste in the query from Management Studio (shown back in Listing 14-1).

As is our standard practice, we Transform data and proceed to rename columns. Since we are only interested in the date and not the time, we change the type to Date , as shown in Figure 14-6.

A screenshot of a window. A drop-down menu of change type from file options is open and the option to change the date is selected.

Figure 14-6

Changing Type from Date/Time to Date

We add an index column for use in our visualization. Back in the Report Viewer example, we could use the .rdlc file to format the score as shown here:
<Value>=IIF(isNumeric(Fields!RawScore.Value), Round(100*(Fields!PercentScore.Value), 1), "")</Value>
This checks if the RawScore is numeric and, if so, multiples our PercentScore by 100 and rounds it to one decimal place. If not, it makes the value blank. In Power BI, it is easier to implement this as a custom Score column, as shown in Figure 14-7.

A screenshot of a window headed custom column. A file of percent score is selected in the drop down menu of available columns on the right.

Figure 14-7

Custom Score column

This takes the PercentScore column (which has a value like 0.86) and multiplies it by 100. Power BI is smart enough not to have an error if the value is null. In that case Score will be null as well.

Our last data task is to go to the Data screen and change the Date format of our date columns to Short Date, as shown in Figure 14-8.

A screenshot of a window. Under the column tools, date format options are open from the drop-down menu of the format. The option of a short date is highlighted.

Figure 14-8

Changing the Date Format to Short Date

Visualizing the Data

We are now ready to start creating our visualizations. Figure 14-9 shows both the final result and the selected card that shows the count of our Index column (renamed to say # of Students).

A screenshot of power B I dashboard. On the right, count of query 1 index is highlighted in the column of visualizations.

Figure 14-9

Power BI Visualization

Note that the 333 value matches our query (Figure 14-3). We next create slicers for Most Recent Completion Date, Lesson, Organization, and Student. To get a Search box, we Get more visuals, enter “Search” in the box, and select the Text Filter visual from Microsoft. These are shown in Figures 14-10 and 14-11.

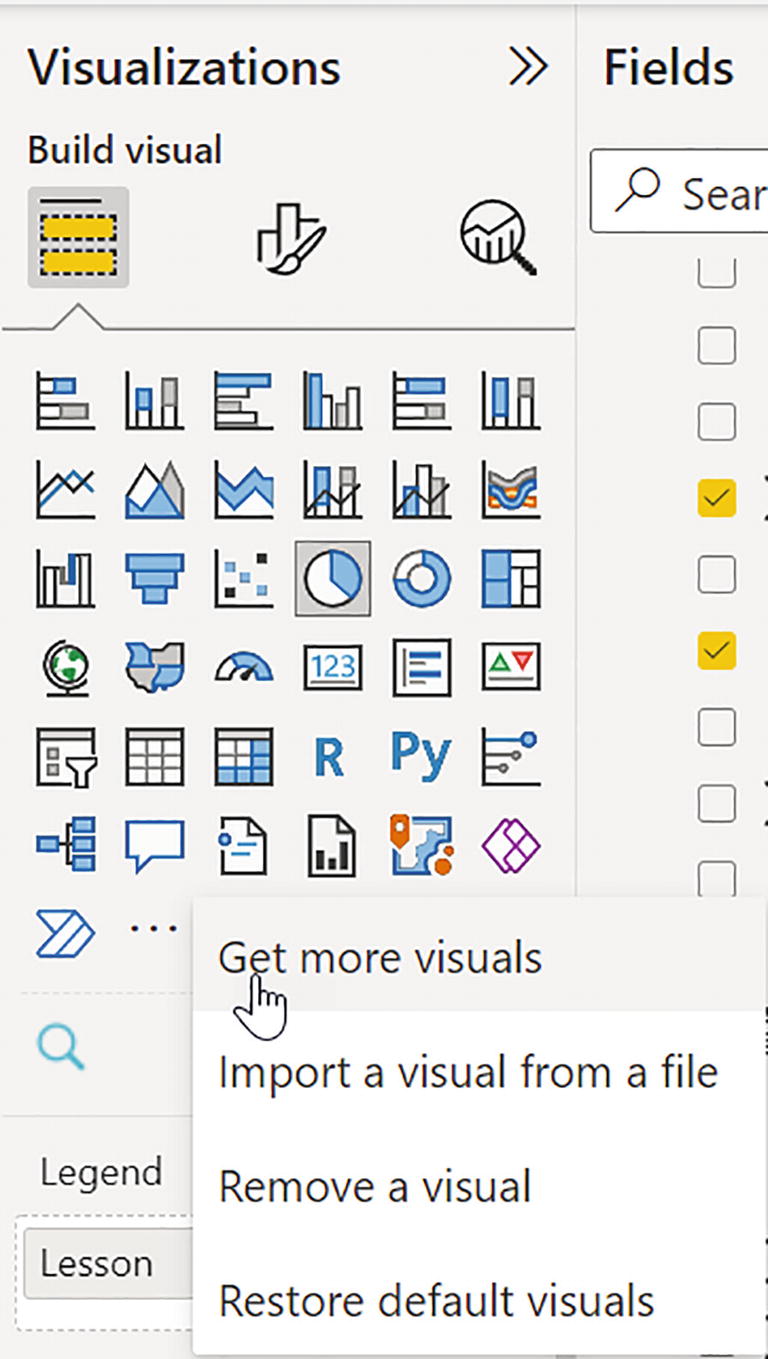
A screenshot of the visualizations column. The 3 options to get more visuals are open in the build visual option.

Figure 14-10

Getting Additional Power BI Visuals

A screenshot of a window-headed power B I visuals. Under the all visuals tab, the search option on the right and the text filter visual are highlighted.

Figure 14-11

Adding a Search Visual

This allows you to search for a particular student.6 Figure 14-12 shows the result of searching for “Jim.”

A screenshot of tracker net window. It has a pie chart with searched student names, lessons, and the average scores in the centre.

Figure 14-12

Search Showing Tooltip of Lesson Info

Notice how the tooltip of the # of Lesson s and Average Score shows up when we hover over a user, in this case Jimmy Buffett.7 Notice how the other visuals are updated as well with only the lessons, statuses, and detailed information associated with Jimi Hendrix and Jimmy Buffett.

Updating the Drill-Down Interactions

Our last task is to adjust what happens when we drill down on particular lessons, students, or statuses. Figure 14-13 shows the default experience of “highlighting” the related visuals.

A screenshot of a window. The happy lessons with the number of students and scores are highlighted in the pie chart of scores by lesson.

Figure 14-13

Default Highlight Drill Down Interaction

We have clicked on _Happy Lesson. The Student and Status visual are grayed out with the matching areas highlighted. This is sub-optimal to me at least. Instead, we’d like to see what students took that lesson and what statuses are associated with that lesson. To get that behavior, we select the lessons visual, go to the Format tab, and click Edit interactions. We than click on the popup Filter button on each of the other visuals.8 This is shown in Figure 14-14. Note that the Table only has the filter option, so we don’t need to edit anything there.

A screenshot of a window. The format data slash drill tab, options to edit interactions, arrange, and filter are highlighted.

Figure 14-14

Changng Interaction from Highlight to Filter

Figure 14-15 shows the result. Notice how this is a much cleaner interface and only shows the data associated with the _Happy Lesson we selected.

A screenshot of a window. It has 3 pie charts and a table. The happy lesson in the pie chart of scores by lesson is highlighted.

Figure 14-15

Filter Drill Down Interaction

Summary

In this chapter, we transformed an older reporting approach into Power BI. We connected to a real-life SQL Server database, transformed our data with a custom column, updated data types, an index column, and by renaming our columns for clarity. We customized our data display format and then visualized our data with the normal mix of cards, slicers, charts, and tables. We added a Search control to allow the user to search for key data like the student and lesson names. We then saw how to change our drill-down interaction from highlight to filter, which I find preferable in most cases.

..................Content has been hidden....................

You can't read the all page of ebook, please click here login for view all page.
Reset
3.145.19.242