CHAPTER 2
Community Banks and FinTech
IS FINTECH A THREAT OR AN OPPORTUNITY FOR COMMUNITY BANKS?
In order to understand how FinTech can help community banks create strategic value, let us take a closer look at community banks, the issues facing them, and how FinTech can help improve performance and valuation. As we saw in Chapter 1, when attempting to define a FinTech company, myriad interpretations exist in delineating community banks and it is important to establish a clear representation before analyzing the sector. For purposes of this book, we define a community bank as a bank or thrift with between $100 million and $5 billion in assets.
Community banks are a subset of depository institutions. Depository institutions include banks, bank holding companies, savings banks, mutual savings banks, stock‐owned thrift institutions, mutual thrift institutions, and credit unions. While we focus largely on U.S. community banks in this chapter, depository institutions more broadly are facing similar challenges and have several common characteristics: they accept deposits from consumers and/or businesses; their deposits are generally insured by the federal government; they are chartered by the federal government or various states and regulated by agencies of these governments; and they generally deploy the acquired deposits by making loans to customers, either businesses or consumers, or making other investments that provide earnings.
Threats to Community Banks
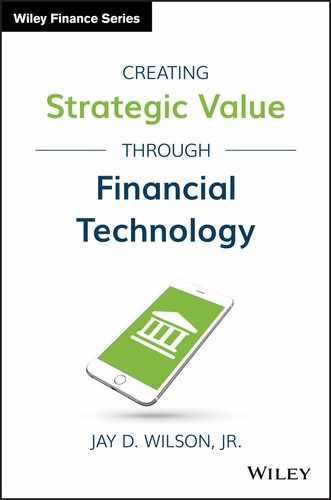
There are nearly 6,000 community banks with 51,000 locations in the United States (this includes commercial banks, thrifts, and savings institutions). While community banks constitute the vast majority of banks (approximately 90% of U.S. banks have assets below $1 billion),1 the majority of banking industry assets are controlled by a small number of extremely large banks. These larger banks have acquired assets quickly and grown at a faster pace in the past few decades than community banks. This has resulted in larger banks taking more market share from community banks. Per Figure 2.1, banks with assets greater than $10 billion controlled approximately 83 percent of total assets in the banking industry compared to 48 percent in 1994.
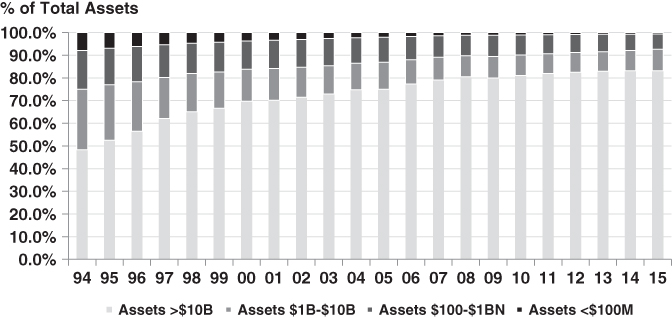
FIGURE 2.1 Overview of U.S. Banks
Source: QBPR, www.fdic.gov
In addition to competitive pressures related to acquiring assets from larger banks, community banks face headwinds of higher regulatory compliance costs, pressured margins from a historically low interest rate environment, and slower demographic and market trends. These headwinds have contributed to a declining number of community banks and weaker profitability. As noted in Figure 2.2, community bank returns on equity (ROEs) have trended down in recent years due to the significant competitive pressures from larger banks as well as the previously noted industry headwinds.
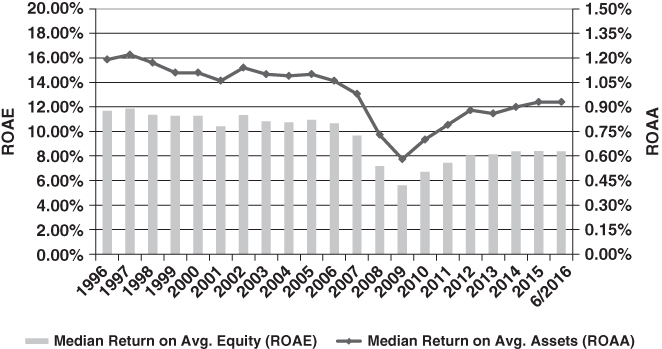
FIGURE 2.2 Community Bank Profitability Trends
Source: S&P Global Market Intelligence
Along with the difficult market conditions marked by high competition and crimped profitability, many community bankers are also attempting to assess and respond to the potential threat from the vast array of FinTech companies and startups taking aim at the banking sector. For perspective, a group of community bankers meeting with the FDIC in mid‐2016 noted that FinTech poses the largest threat to community banks. One executive indicated that the payment systems “are the scariest” as consumers are already starting to use FinTech applications like Venmo and PayPal to send peer‐to‐peer payments. Another banker went on to note, “What's particularly concerning about [the rise of FinTech] for us is the pace of change and the fact that it's coming so quickly.”2
Opportunities for Community Banks
While many bankers view FinTech as a significant threat, FinTech also has the potential to assist the community banking sector. This is significant, particularly in the United States, as community banks compose an important part of the economy, constitute the majority of banks in the United States, and are collectively the largest providers of certain loan types such as agricultural and small business lending. FinTech offers the potential to improve the health of community banks by enhancing performance and improving profitability and ROEs back to historical levels.
Big Banks (defined as those with assets greater than $5 billion and referred to as “Big Banks” hereafter) have outperformed community banks consistently for many years. In the 20‐year period from 1996 to 2016, Big Banks reported a higher return on assets (ROA) than community banks in each period except for 2009 (the depths of the financial crisis). In 2015, the median ROA and ROE of the Big Banks was 1.03 and 8.65 percent, respectively, compared to 0.93 and 8.40 percent, respectively, for the community banks.
Interestingly, though, the source of outperformance is not due to net interest margin, perhaps the most common performance metric that bankers often focus on. Community banks had consistently higher net interest margins than Big Banks in each year over that 20‐year period (1996–2016). Rather, the outperformance of the Big Banks can be attributed to their generation of greater non‐spread revenues (i.e., non‐interest income) and lower non‐interest expense (i.e., lower efficiency ratios). In each of the last 20 years, the Big Banks have had higher non‐interest income as a proportion of assets (Big Banks averaged non‐interest income as a proportion of average assets at 1.0% compared to the community bank average of 0.75%) and lower efficiency ratios (Big Banks averaged 59% compared to community banks averaging 67%).
FinTech and Non‐Interest Income and Efficiency Ratios
While FinTech can benefit community banks in a number of areas, FinTech offers some specific solutions where Big Banks have historically outperformed community banks: non‐interest income and efficiency. To enhance non‐interest income, community banks may consider a number of FinTech innovations in niches like payments, insurance, and wealth management. Since many community banks have minimal personnel and legacy systems in these areas, they may be more apt to try a new FinTech platform in these niches. For example, a partnership with a robo‐advisor might be viewed more favorably by a community bank as it represents a new source of potential revenue, another service to offer their customers, and it will not cannibalize their existing trust or wealth management staff since they have minimal existing wealth management personnel.
FinTech can also enhance efficiency ratios and reduce expenses for community banks. Branch networks are the largest cost of community banks and serving customers through digital banking costs significantly less than traditional in‐branch services and interactions with customers. For example, branch networks make up approximately 47 percent of banks' operating costs and 54 percent of that branch expenditure goes to staffing.3 Conversely, the costs of ATM and online‐based transactions are less than 10 percent of the costs of paper‐based branch transactions in which tellers are involved.4
To illustrate the potential financial impact of transitioning customers to digital transactions for community banks, let's assume that a mobile transaction saves the bank approximately $3.85 per branch transaction.5 If we assume that FinTech Community Bank has 20,000 deposit accounts and each account shifts two transactions per month to mobile from in‐person branch visits, the bank would save approximately $150,000 per month and approximately $1.8 million annually (Table 2.1).
TABLE 2.1 Potential Cost Savings from a Digital‐Focused Bank
| Costs to Service Deposits | $4.00 |
| Costs to Service Digital Deposits | $0.15 |
| Difference | $3.85 |
| # of Deposit Accounts | 20,000 |
| Transactions Shifted to Mobile/Month | 2 |
| Pre‐Tax Cost Savings per Month | $154,000 |
| Pre‐Tax Cost Savings to the Bank | $1,848,000 |
FinTech Community Bank's ability to lower costs due to the transition to mobile transactions helps the bank generate higher earnings, a lower efficiency ratio, and a higher ROA and ROE relative to a “Traditional Community Bank” (Table 2.2).
TABLE 2.2 Traditional Community Bank and FinTech Community Bank Comparison
| Traditional Community Bank | FinTech Community Bank | |
| Net Interest Income | 36,000 | 36,000 |
| Non‐Interest Income | 10,000 | 10,000 |
| Non‐Interest Operating Expenses | (31,050) | (28,750) |
| Pre‐Tax, Pre‐Provision Income | 14,950 | 17,250 |
| Provision Expenses | (2,160) | (2,160) |
| Pre‐Tax Income | 12,790 | 15,090 |
| Taxes | (4,477) | (5,282) |
| Net Income | $8,314 | $9,809 |
| Return on Average Assets | 0.83% | 0.98% |
| Return on Tangible Equity | 9.24% | 10.90% |
| Average Equity | 90,000 | 90,000 |
| Average Loans | 720,000 | 720,000 |
| Average Earning Assets | 900,000 | 900,000 |
| Average Assets | 1,000,000 | 1,000,000 |
| Net Interest Margin | 4.00% | 4.00% |
| Non‐Interest Income/Average Assets | 1.00% | 1.00% |
| Efficiency Ratio | 67.50% | 62.50% |
| Provision Expenses/Average Loans | 0.30% | 0.30% |
The Opportunity of Regulatory Technology
In addition to the benefits from customers shifting to digital transactions, community banks can utilize FinTech companies focused on “RegTech,” or regulatory technology, in leveraging technology to address compliance/regulatory burdens (at lower costs than hiring additional personnel). While shielded from some of the more onerous regulations impacting the Big Banks, community banks have still faced a growing compliance and regulatory burden since the onset of the financial crisis in mid‐2008. The majority of bankers cited regulatory compliance (64% of bankers surveyed) as a factor negatively impacting profitability in a recent survey.6 To better understand the growing regulatory and compliance burden facing community banks, let's consider the following:7
- The Call Report, which all banks file quarterly, has lengthened considerably. Up until the mid‐1980s, the typical Call Report filing was less than 10 pages. Since that time, it has increased—now totaling over 80 pages.
- Regulations have become more complex with a growing number of new, lengthy pieces of banking legislation. Both the number of new banking acts and the length of those acts has increased in each decade since the 1960s. In the most recently completed decade (2001–2010), there were 10 new banking acts that became law and totaled approximately 2,000 pages of new legislation.
Hiring additional staff to handle this growing regulatory and compliance burden can have a significant impact on bank profitability. For example, Feldman, Schmidt, and Heinecke (2013) at the Federal Reserve Bank of Minneapolis found a reduction in profitability of 45 basis points for increasing staff by two people for the smallest banks (less than $50 million in assets).8 By leveraging FinTech innovations in the RegTech area, community banks can see reduced compliance costs and enhanced efficiency.
In addition to addressing the key areas where Big Banks have outperformed community banks in recent periods (non‐interest income and efficiency ratios), FinTech also offers some other potential benefits for community banks.
Enhanced Scale
FinTech can be used to help community banks compete against Big Banks more effectively by minimizing the impact of scale. Scale matters to most financial services companies. The larger they become, the more efficient and profitable they become by enhancing operating leverage and spreading costs over a larger customer base. Smaller banks cannot replicate a large bank's vast branch network or physical footprint. However, by relying on FinTech, smaller banks can more easily replicate a large bank's footprint digitally via the Web or a mobile device. Therefore, FinTech allows a community bank to compete more effectively with a larger bank by attracting, retaining, and providing services to more customers in a more efficient and less costly manner.
Loan Portfolio Diversification
FinTech also offers many community banks an opportunity to enhance loan portfolio diversification and regain some market share after years of losing ground in certain segments. Forward‐thinking community banks that are able to leverage FinTech may be able to regain market share in areas recently conceded to other players such as consumer, mortgage, auto, and/or student lending. This added market share in non–real estate segments can help address concentration issues and higher credit risks for community banks that already have a high proportion of certain types of loans (i.e., commercial real estate). As shown in Figures 2.3 and 2.4, concentration risk within community banks' loan portfolios has been growing over time as real estate loans (and particularly commercial real estate loans) currently comprise a greater proportion of the loan portfolio than in 1990.
FIGURE 2.3 Community Bank Loan Portfolio Mix (1990 vs. June 2016)
Source: S&P Global Market Intelligence
Also, the makeup of a community bank's real estate portfolio today contains a greater proportion of commercial real estate, construction and development, and multifamily lending than historically. By utilizing FinTech offerings, community banks can limit this concentration risk and expand back into other types of lending with digital consumer, mortgage, auto, and/or student‐lending offerings.
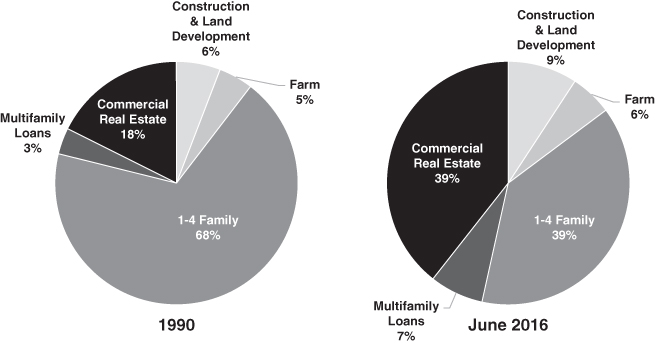
FIGURE 2.4 Community Bank Real Estate Loan Portfolio Mix (1990 vs. June 2016)
Source: S&P Global Market Intelligence
Customer Retention and Preference
Another benefit of FinTech is that it provides an additional touchpoint to improve customer retention and preference. While data is limited, some studies have shown that customer loyalty (i.e., retention) is higher for those customers that use mobile offerings and digital banking (online and mobile) is increasingly preferred by customers.9 Online banking surpassed branch transactions as the preferred banking method for the first time in 2009 and the gap has only continued to widen.10 In a 2015 survey, online banking was the most preferred banking method at 32 percent while branch banking had trended down and was only preferred by 17 percent of customers.11 The number of people preferring mobile was also growing at 12 percent of customers compared to a significantly smaller proportion five years earlier. While digital is clearly growing among customer preference, data has also shown that digital‐only customers can be less engaged, loyal, and profitable than those who interact with the bank through a combination of interactions across multiple channels (digital, branches, etc.).12 So community banks that already rely more heavily on their branch networks should find it beneficial to add digital services to complement their traditional offerings in order to enhance customer retention and preference.13
Change Is Inevitable; Growth Is Optional
As technological advances continue to penetrate the banking industry, community banks will need to leverage technology in order to more effectively market to and serve small businesses and consumers in an evolving environment. Community banks will increasingly rely on a model that makes widespread use of ATMs, the Internet, mobile apps, and algorithm‐driven decision making, enabling them to deliver their services to customers in a streamlined and efficient manner.
For these reasons, banking and financial services is already the most technologically intense sector today as measured by IT spending relative to revenue and operating expenses. In addition, technology spending is expected to continue to increase going forward. Historically, banks have spent approximately 6–7 percent of revenues on IT. Banks still spend more globally on IT, an average of 5–9 percent of revenues, compared to the 3 percent of revenue IT spend of the insurance and airline industries.14 Analysts with consulting firm Ovum see no end in this spending pattern, as they predict that IT spending in banks will increase 5 percent annually to $158 billion in 2019 (up from $131 billion in 2015).15 Top spending initiatives are planned in the areas of security, analytics, and digital banking (an umbrella term for online and mobile), according to industry research.
FINTECH'S POTENTIAL IMPACT ON BANK VALUATION
Having over a decade's worth of experience valuing community banks, I readily acknowledge that each bank's valuation is unique but I attempt to summarize key valuation themes and approaches and demonstrate how FinTech can improve a bank's valuation. Valuing a bank is, by its nature, forward looking with history serving as a guide. Valuation tends to revolve around three primary elements, earnings/cash flow, risk, and growth, and significant trade‐offs can exist among these three elements, particularly when valuing banks.
A bank's earnings, dividend‐paying capacity, and growth can be enhanced in the short‐to‐intermediate term by taking more risk while the impact of that decision (usually credit losses from more aggressive loan underwriting) may not be evident for several years. A well‐reasoned bank valuation needs to consider the potential trade‐offs and the implications of higher earnings and growth today versus potential risks in the future. Banks considering FinTech niches and partnerships should also weigh the trade‐off between growth and risk, as they must strike a balance between attempting to grow revenues and profitability against the potential risk of trying an innovative piece of software or technology.
Two common approaches to valuing a bank are:
- Income Approach. The discounted cash flow (DCF) method is an income approach whereby the bank's value is determined by summing the present value of distributable cash flows generated over the forecast period and the terminal value at end of forecast period. Key elements in a DCF method include distributable cash flow (i.e., existing and internally generated capital that is in excess of a reasonable threshold level), the terminal value that is derived typically from earnings or book value at the end of the forecast period times a multiple of earnings and/or tangible book value and the discount rate.
- Market Approach. Using the market approach, the bank's value is typically determined based upon comparisons to transactions in public banks, whole bank acquisitions, and/or historical transactions in the bank's own stock. The guideline public company or guideline transactions method involves utilizing pricing multiples derived from publicly traded banks or acquired banks bearing similarities to the subject bank, such as business model, asset size, credit quality, geographic region, and profitability. Common bank valuation multiples include price/earnings, price/tangible book value, and core deposit premiums relative to tangible book value (control). Applying the guideline group multiples, inclusive of adjustments for fundamental differences between the subject bank and the guideline groups if necessary, can provide meaningful indications of value. The transactions method may also be helpful as inferences can sometimes be drawn from historical transactions in the bank's stock.
FinTech can be used by community banks to create strategic value and enhance their valuation by improving one or some combination of the three key valuation elements: cash flow, risk, and growth. For example, FinTech can help improve cash flow through either increasing revenues (spread or non‐interest income), or reducing expenses, reducing risk through enhanced diversification of product offerings, or increasing potential growth prospects from adding the ability to grow revenues faster through new product offerings or greater customer retention. The trade‐off between increased cash flow and potential growth rates versus additional risk will be important to measure and analyze when assessing FinTech niches and their valuation impact.
This enhanced financial performance from leveraging FinTech can significantly impact valuation. Returning to our prior example of the Traditional Community Bank and FinTech Community Bank in Table 2.3, the valuation range for FinTech Community Bank could be 20–25 percent higher at $125–$150 million than Traditional Community Bank at $100–$125 million (even assuming the same valuation multiple) as shown in the table.
TABLE 2.3 Price‐to‐Earnings Multiple Comparison of Traditional Community Bank to FinTech Community Bank
| Implied Financial Performance | Price‐to‐Earnings Multiple | ||||||
| Net Income | ROAA | ROTE | 10.0 | 12.5 | 15.0 | 17.5 | |
| 7,000 | 0.70% | 7.78% | 70,000 | 87,500 | 105,000 | 122,500 | |
| Traditional Bank | 8,000 | 0.80% | 8.89% | 80,000 | 100,000 | 120,000 | 140,000 |
| 9,000 | 0.90% | 10.00% | 90,000 | 112,500 | 135,000 | 157,500 | |
| FinTech Bank | 10,000 | 1.00% | 11.11% | 100,000 | 125,000 | 150,000 | 175,000 |
| 11,000 | 1.10% | 12.22% | 110,000 | 137,500 | 165,000 | 192,500 | |
In addition to the valuation benefit from enhanced profitability, FinTech Community Bank's valuation could also benefit from multiple expansion. We previously noted that two key potential benefits from FinTech were to improve efficiency by lowering costs and to increase non‐interest income. A common approach to valuing a bank is utilizing pricing multiples derived from publicly traded banks bearing similarities to the subject bank such as business model, asset size, credit quality, geographic region, and profitability. Common bank valuation multiples examined among the public banks include price/earnings and price/tangible book value.
To examine the potential impact on the valuation multiple from improving those two performance measures, we examined pricing multiples of publicly traded community banks with assets between $500 million and $1 billion (see Table 2.4) and found that banks that have higher levels of non‐interest income and/or lower efficiency ratios tend to achieve higher valuations from a combination of improved profitability and higher multiples. Thus, those banks that are able to effectively leverage FinTech to increase non‐interest income and lower efficiency ratios can ultimately enhance shareholder value relative to their counterparts that solely focus on other strategies.
TABLE 2.4 Summary of Guideline Company Analysis
Source: S&P Global Market Intelligence, Market Pricing information as of 6/30/2016
| Public Company Group Description | Price/LTM Core EPS | Price/Tangible Book Value | Core ROATCE |
| National Banks: Assets $500 Mil–$1 Bil | 13.4× | 1.02× | 8.36% |
| High Non‐Int't Income Banks: Assets $500M–$1BN* | 14.2× | 1.18× | 9.47% |
| Low Efficiency Ratio Banks: Assets $500M–$1BN** | 13.7× | 1.19× | 9.23% |
*Non‐Int't Income/Assets >1% in LTM period
**Efficiency Ratio <60% in LTM period
HOW COMMUNITY BANKS CAN HELP FINTECH COMPANIES
In addition to potentially enhancing the profitability and valuation of community banks, a relationship with a community bank can also be beneficial to FinTech companies for a number of reasons. The FinTech company can benefit from being able to test their product or service and improve it before they roll it out to larger banks or more customers, scaling more quickly and at lower acquisition costs from accessing the community bank's customers, and elevating their brand by partnering with a more established brand within the financial services landscape. The knowledge of the bank's management team can also prove invaluable for the FinTech company as it prepares for potential regulatory and compliance scrutiny. Additionally, there are a broader number of smaller community banks located in a diverse range of markets (from urban to rural), which provides a larger and potentially more diverse client pool for FinTech companies.
FinTech entrepreneurs who understand market conditions and the ability of FinTech to enhance performance and valuation of community banks can focus on providing FinTech solutions that meet the needs of community banks and also enhance marketing efforts to potential community bank customers. Historically, the Big Banks have often led the way in rolling out new FinTech innovations. For example, ApplePay was rolled out first to the largest banks and then trickled down to the community banks. However, savvy FinTech entrepreneurs should realize that community banks are a rich market for FinTech as well. Opportunities exist to develop innovations and foster relationships in order to partner with community banks.
CONCLUSION
Despite the potential benefits of FinTech for community banks and vice versa, significant challenges exist for community banks considering FinTech opportunities. Community banks typically operate with leaner in‐house management, technology staff, and technology experience to evaluate and pursue FinTech opportunities. Additionally, the appeal of FinTech can often be overshadowed by the breadth of the landscape, which can be overwhelming for a smaller bank and make it difficult for them to pinpoint which niche may be best for them to pursue. Lastly, there can be significant cultural, valuation, and risk differences between banks and FinTech companies, which can make partnerships and mergers between the two difficult.
Consequently, this book will attempt to address some of these issues in greater detail and illustrate how both financial institutions and FinTech companies can create strategic value from improving one or some combination of the three primary valuation elements of cash flow, risk, and growth. To accomplish this, we discuss the FinTech landscape by providing overviews of trends in a number of FinTech niches in order for bankers to consider which areas of FinTech may be the best fit for their institution. For community banks seeking to explore FinTech further, this book discusses specific ways to consider structuring an investment, partnership, or merger and the right metrics to utilize in order to develop a framework for measuring and comparing FinTech opportunities.