CHAPTER 9
Partnering with a FinTech Company
INTRODUCTION
Banks are starting to realize that they must develop a strategy that considers how to evolve, survive, and thrive as technology and financial services increasingly intersect. A recent survey from BankDirector noted that bank boards are focusing more on technology with 75 percent of respondents wanting to understand how technology can make banks more efficient and 72 percent wanting to know how technology can improve the customer experience.1
For these reasons, a number of banks are seeking to engage in discussions with FinTech companies. The right combination of technology and financial services through a partnership has significant potential to create value for both FinTech companies and traditional financial institutions.
FinTech presents traditional financial institutions with a number of strategic options, but the most notable options include focusing on one or some combination of the following: building their own technology solution, acquiring a FinTech company, or partnering with a FinTech company. While we do not yet know which strategy will be most successful, we do know that discussions of whether to build, partner, or buy will increasingly be on the agenda of boards and executives of both financial institutions and FinTech companies for the next few years.
This chapter focuses on key considerations when contemplating a partnership between a traditional FinTech company and a traditional financial services institution—such as a community bank. Partnerships between banks and FinTech companies have been increasingly common in recent years. Venture capital data indicates that corporate partnerships with FinTech companies seem to be on the rise, with corporate participations in nearly one‐third of all FinTech deals (32%), which is an increase over recent prior quarters.2 Additionally, significant partnerships between traditional banks and FinTech companies have been announced recently. The news is also full of announcements related to co‐creation opportunities where larger traditional financial institutions invest in innovation labs or accelerators to provide support for FinTech companies to grow and develop new concepts and technologies. For perspective, let's examine one FinTech niche where examples of partnerships are perhaps most evident—wealth management and the industry's response to robo‐advisory. These include:
- Motif and JP Morgan (partnership announced in October 2015).
- UBS and SigFig (partnership announced in May 2016).
- FutureAdvisor, operating under the auspices of BlackRock, announced partnerships with RBC, BBVA Compass, and LPL in 2016.
- Personal Capital announced a partnership in July 2016 with AlliancePartners to offer its digital wealth management platform to approximately 200 community banks.
- Betterment and Fidelity (partnership announced in October 2014).
The interest in partnering appears to be coming from both upstart FinTech companies as well as traditional financial services companies. For banks, partnering with a startup is becoming an attractive option, as it allows the incumbent to give a FinTech solution, like robo‐advisory, a test drive without wholly committing to the idea yet. For FinTech companies, the potential benefits include the expertise and customer feedback gained by rolling out their newest innovation to the established customer base of the bank while banks can more quickly and cheaply test a FinTech innovation with their customer base.
Any partnership should be studied carefully to ensure that the right metrics are used to examine value creation and returns on investment. Partnerships come with risk, such as execution and cultural issues, contingent liabilities, and potential regulatory/compliance issues. These risks must be balanced with the potential rewards, such as customer satisfaction/retention, shareholder value creation, and return on investment.
Conditions Driving Banks to FinTech Partnerships
There are a number of different reasons why a traditional bank might want to partner with a FinTech company, but one of the key drivers is the potential value creation for the bank's shareholders. As noted in Chapter 2, the valuation of a bank is typically reflective of three key elements: cash flow, risk, and growth. Partnerships that create value for the bank will likely serve to increase cash flow, reduce risk, or increase potential growth prospects. The trade‐offs between increased cash flow and potential growth rates versus the additional risk are important to measure and analyze prior to entering into the partnership.
Certain FinTech partnerships offer the bank the ability to enhance revenue from expanding fee or net interest income while others offer the ability to lower costs through servicing deposits more cheaply. To the extent that the partnership has a direct positive impact on profitability through either increasing revenues (spread income or non‐interest income) or lowering expenses, then the addition to shareholder value could be measured by applying a multiple to the after‐tax earnings impact.
In addition to improving profitability, a partnership can also enhance the value of the bank by either reducing risk or enhancing growth prospects. These elements can be more difficult to measure but can be significant nonetheless. For example, a bank could partner with a cybersecurity FinTech company to reduce potential exposure in that area for the bank. A bank could also partner with a FinTech company that has a software solution that utilizes big data analytics to provide quicker alerts to financial difficulties of borrowers, thereby reducing charge‐offs and enhancing underwriting. FinTech partnerships may also provide an additional touchpoint to improve the stickiness/retention of the client/customer.
To demonstrate the potential benefits of FinTech to community banks, let's consider the following example of two community banks: FinTech Community Bank and Traditional Community Bank. Both community banks have very similar financial characteristics, but one bank, FinTech Community Bank, elects to focus on developing a FinTech strategy and framework and focuses on developing and partnering with FinTech companies that provide mobile banking products that will increase convenience for customers and reduce costs as customers transition certain transactions from in‐person branch visits to mobile. If the FinTech‐oriented bank's mobile banking platform enables the bank to service customer accounts through digital channels rather than traditional in‐person branches, an impact on the bank's profitability and in turn valuation will occur.
While reports vary as to the exact cost of servicing an account through a traditional in‐person interaction versus a mobile device, most agree that serving customers through a mobile device can be a win‐win for the bank, as it improves the convenience and accessibility of the bank to its customers. Mobile transactions are significantly cheaper than traditional in‐branch visits and save the bank approximately $3.85 per branch transaction.3 If we assume that FinTech Community Bank has 20,000 deposit accounts and each account shifts two transactions per month to mobile and away from in‐person branch visits, this will result in approximately $150,000 in cost savings per month or an annual savings of approximately $1.8 million. (See Table 9.1.)
TABLE 9.1 Potential Cost Saving from Digital Focus
| Costs to Service Deposits | $4.00 |
| Costs to Service Digital Deposits | $0.15 |
| Difference | $3.85 |
| # of Deposit Accounts | 20,000 |
| Transactions Shifted to Mobile/Month | 2 |
| Pre‐Tax Cost Savings per Month | $154,000 |
| Pre‐Tax Cost Savings to the Bank | $1,848,000 |
FinTech Community Bank's ability to lower costs relative to Traditional Community Bank helps it generate higher earnings, a lower efficiency ratio, and a higher return on assets (ROA) and equity (ROE). (See Table 9.2.)
TABLE 9.2 Community Bank Comparison
| Traditional Community Bank | FinTech Community Bank | |
| Net Interest Income | 36,000 | 36,000 |
| Non‐Interest Income | 10,000 | 10,000 |
| Non‐Interest Operating Expenses | (31,050) | (28,750) |
| Pre‐Tax, Pre‐Provision Income | 14,950 | 17,250 |
| Provision Expenses | (2,160) | (2,160) |
| Pre‐Tax Income | 12,790 | 15,090 |
| Taxes | (4,477) | (5,282) |
| Net Income | $8,314 | $9,809 |
| Return on Average Assets | 0.83% | 0.98% |
| Return on Tangible Equity | 9.24% | 10.90% |
| Average Equity | 90,000 | 90,000 |
| Average Loans | 720,000 | 720,000 |
| Average Earning Assets | 900,000 | 900,000 |
| Average Assets | 1,000,000 | 1,000,000 |
| Net Interest Margin | 4.00% | 4.00% |
| Non‐Interest Income/Average Assets | 1.00% | 1.00% |
| Efficiency Ratio | 67.50% | 62.50% |
| Provision Expenses/Average Loans | 0.30% | 0.30% |
This enhanced financial performance can have a significant impact on valuation. If we assume that both banks achieve the same P/E multiple range of 12.5× to 15× earnings, as an example, then the valuation range for the Traditional Community Bank is from $100 to $120 million compared to FinTech Bank's valuation range of $125 to $150 million. (See Table 9.3.)
TABLE 9.3 Price‐to‐Earnings and Valuation Ranges
| Implied Financial Performance | Price‐to‐Earnings Multiple | ||||||
| Net Income | ROAA | ROTE | 10.0 | 12.5 | 15.0 | 17.5 | |
| 7,000 | 0.70% | 7.78% | 70,000 | 87,500 | 105,000 | 122,500 | |
| Traditional Bank | 8,000 | 0.80% | 8.89% | 80,000 | 100,000 | 120,000 | 140,000 |
| 9,000 | 0.90% | 10.00% | 90,000 | 112,500 | 135,000 | 157,500 | |
| FinTech Bank | 10,000 | 1.00% | 11.11% | 100,000 | 125,000 | 150,000 | 175,000 |
| 11,000 | 1.10% | 12.22% | 110,000 | 137,500 | 165,000 | 192,500 | |
While partnering with a FinTech company may appear to be a novel strategy for a bank, this strategy to assist the bank in expanding its digital offerings is not inconsistent with how the bank might have undertaken a traditional branch‐building growth strategy. For example, a bank that builds a physical branch essentially partners with a number of companies to complete the project, like contractors, engineers, architects, and so forth. Similarly, a bank needs a variety of partners to build digital capabilities. One benefit to building digital capabilities over a traditional physical branch is that all of the bank's customers can benefit from digital capabilities, whereas only the customers who access and use the bank's new physical branch will benefit from it.
Conditions Driving More FinTech Companies to Bank Partners
Market conditions may also drive more FinTech companies to consider partnerships. Coming off recent years where both public and private FinTech markets were trending positively, the tail end of 2015 and the start of 2016 were unique as performance started to diverge. The performance of public FinTech companies was relatively flat through the first quarter of 2016 and signs of weakness were observed in certain niches (alternative/marketplace lending) and in some of the more high‐profile FinTech IPOs. The median return of the FinTech companies that IPO'd in 2015 was a decline of 16 percent since IPO (through 3/31/16). For perspective, some recent prominent FinTech IPOs such as Square, OnDeck, and Lending Club are each down significantly in 2016 (down 28%, 53%, and 64%, respectively from 1/1/2016 to 5/18/2016). Also, the broader technology IPO slowdown in late 2015 continued into 2016 and FinTech IPOs were minimal in 2016.
However, optimism for FinTech still abounds and the private markets continue to reflect this optimism through robust investor interest and funding levels. In 2016, 334 FinTech companies raised a total of $6.7 billion in funding in the first quarter of 2016 (compared to 171 companies raising $3.2 billion in the first quarter of 2015) and Ant Financial (Alibaba's finance affiliate) completed an eye‐popping $4.5 billion capital raise in April 2016.
While the factors driving this divergence in performance between public and private markets are debatable, the divergence is unlikely to continue indefinitely. A less favorable public market and less attractive IPO market creates a more challenging exit environment for those “unicorns” (startups valued at over $1 billion) and other private companies. Headwinds for the private markets could develop from more technology companies seeking IPOs and less cash flow from successful exits to fund the next round of private companies. Consequently, other strategic and exit options beyond an IPO are being considered by FinTech companies such as partnering with, acquiring, or selling to traditional incumbents (banks, insurers, and money managers).
The potential for partnerships is even more likely in FinTech, particularly here in the United States, due to the unique dynamics of the financial services industry, including the resiliency of traditional incumbents and the regulatory landscape. For example, consider a few of the inherent advantages that traditional banks have over non‐bank FinTech lenders:
- Better Access to Funding. Prior to 2016, the interest rate/funding environment was very favorable and limited the funding advantage that financial institutions have historically had relative to less regulated nonfinancial companies. However, the winds appear to be shifting somewhat as rates rose in late 2015 and again in late 2016, and funding availability for certain FinTech companies has tightened. For example, alternative lenders are dependent, to some extent, on institutional investors to provide funding and/or purchase loans generated on their platform and a number have cited some decline in institutional investor interest.
- Banks Still Have Strong Customer Relationships. While certain niches of FinTech are enhanced by demand from consumers and businesses for innovative products and technology, traditional institutions still maintain the majority of customer relationships. As an example, the 2015 Small Business Credit Survey from the Federal Reserve noted that traditional banks are still the primary source for small business loans with only 20 percent of employer firms applying at an online lender. The satisfaction rate for online lenders was low (15% compared to 75% for small banks and 51% for large banks). The main reasons reported for dissatisfaction with online lenders was high interest rates and unfavorable repayment terms.
- Regulatory Scrutiny and Uncertainty Related to FinTech. Both the Federal Reserve and the OCC have made recent announcements and comments about ways to regulate financial technology. In the online lending area specifically, regulatory scrutiny appears to be on the rise with the Treasury releasing a whitepaper discussing the potential oversight of marketplace lending and the CFPB signaling the potential to increase scrutiny in the area. The lack of a banking charter has also been cited as a potential weakness and has exposed certain alternative lenders to lawsuits in different states.
For FinTech companies looking to overcome those inherent advantages of traditional banks, partnering with a traditional bank can be beneficial. As the result of the partnership, the FinTech company can scale more quickly, lower customer acquisition costs, and elevate their brand by partnering with a more established brand. In addition, accessing the knowledge and experience of the bank's management team, who often has more experience with the regulatory landscape, can prove invaluable.
Developing a FinTech Partnership Framework
While the potential benefits of FinTech partnerships are numerous, banks must put much consideration into prioritizing FinTech opportunities and determining which FinTech partners they will ultimately select. As discussed in Chapter 1, there is a vast array of FinTech companies focused on different FinTech niches and a significant number would benefit from having access to a bank's customer base. So, banks should be highly selective when picking and choosing FinTech companies that would best align with their strategy and help enhance profitability and valuation. In order to properly consider FinTech opportunities, banks need to develop a specific framework and criteria for potential FinTech partnerships so that they can focus on partnerships in areas that will be most beneficial to their bank and their customers and shareholders.
Basics of Corporate Finance and Investment Returns4
To assist with developing an appropriate framework for FinTech partnerships, we first briefly review the basics of corporate finance and shareholder returns so that directors and managers of banks can make more informed financial decisions when considering FinTech partnerships. This brief review will help the board and management to determine strategy as it relates to interconnected financial decisions, such as capital budgeting, capital structure, and distribution policy. By understanding these three financial decisions better and their interaction with the company's strategic plan, managers and directors can make the optimal FinTech partnership decisions to generate shareholder returns and value.
There are two primary components of an investor's return: the return from reinvestment and the return from dividends. In order for value to be created, the returns from reinvestment decisions must meet or exceed the investor's required return. If that occurs, then the enhancement to either cash flow and/or future growth will offset the capital outlay. (See Table 9.4.)
TABLE 9.4 Investment Returns for FinTech Company
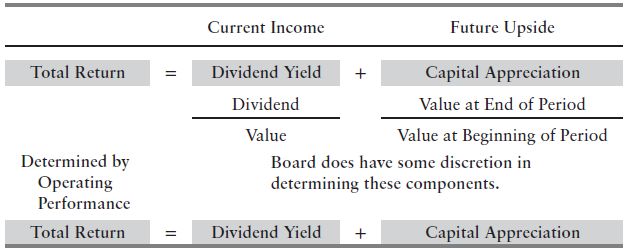
Total return is often determined by the earnings retention policy and then the dividend policy would flow through. If your bank has favorable reinvestment opportunities, then the optimal strategy would likely be to attempt to grow through reinvestment and capital appreciation. Reinvestment lowers the potential for current returns in favor of future return growth. Creating value through the decision to reinvest versus distribute is a balancing act. Reinvestments are good for future growth and capital appreciation so long as the investments are made in productive assets. If the investments are made in unproductive assets, though, expected returns are lower and less capital appreciation occurs while current returns in the form of dividends are delayed.
FinTech companies and banks consist of a portfolio of projects. The range of the projects can vary and will likely expand as the company or bank grows. For example, a small community bank may have only a limited number of projects (FinTech or otherwise), whereas a large bank may have hundreds or even thousands of projects. Similarly, an early‐stage FinTech company may be focused on only one or a handful of products/services, whereas a larger and more well‐established FinTech company may have a number of products that have existed for several decades, as well as a vast pipeline of potential new products and initiatives. This helps to explain a key valuation difference between early‐stage or smaller FinTech companies and larger companies. As investors examine the menu of potential investments, they are going to require a higher return for early‐stage or smaller FinTech companies due to the greater risk of investing in a smaller, less diversified portfolio of projects.
Two basic elements of corporate finance are return and risk. A keen understanding of the two, and how they interact, is important for directors and managers to understand. We describe the best ways to analyze returns from FinTech acquisitions and partnerships in more detail at the end of this chapter (see also Chapter 10), but now let's briefly discuss risk.
One important factor to consider when assessing risk is that the riskiness of a project in isolation is less important than the riskiness of a project in conjunction with the rest of the portfolio of projects. We often hear from community bankers about their concerns regarding the risks inherent with FinTech investments or partnerships. While it is advisable that any potential FinTech partnership/investment be analyzed in terms of its potential riskiness, community bankers would be wise to consider the riskiness of potential FinTech opportunities relative to their existing portfolio of projects.
To better understand this point, let's consider the following example: two community banks are examining a relationship with an alternative lender that provides small business financing. Both banks determine that the relationship would enhance the bank's return on equity and provide an internal rate of return (IRR) (we discuss how to compute an IRR for a FinTech partnership in more detail in a later section of this chapter) that exceeds the bank's existing cost of equity. While the IRR from the FinTech partnership is the same for both banks, one bank elects to reject the relationship while the other elects to continue the partnership, yet both made the right strategic decision. Why?
Let's assume that the FinTech company that both banks looked at is Digital Lender, a hypothetical FinTech company that offers a digital lending solution that is specifically focused on providing loans to small‐ and medium‐sized businesses. The first bank already had a higher‐than‐peer concentration of small business lending as it already had an SBA (Small Business Administration) lending platform and employed a number of small business‐focused lenders. The first bank also already has a fairly diversified loan portfolio with above‐peer margins. The second bank had a large concentration in agricultural and residential real estate loans, but did not have a very large small business lending portfolio. However, it believed there was an opportunity within its market area to offer small business loans due to a growing number of small businesses and a shortage of banks focused on this segment. However, the second bank had been unable to attract a lender with that expertise to the bank due to a talent shortage in their area and its minimal level of product offerings. Thus, the second bank foresaw the opportunity for the digital small business lending platform of Digital Lender to offer another touchpoint and product for it to go out and attract small business customers and start to add diversification to its loan portfolio. Furthermore, the second bank's net interest margin was below peer due to a higher‐than‐peer concentration of securities and need to reinvest those assets in higher yielding assets. Thus, the digital lending platform was a low‐cost way for the second bank to enter into the small business segment, increase its net interest margin, and improve its diversification.
Consequently, different FinTech products and companies will appeal to different banks for different reasons. For a FinTech company looking to partner with a bank, it is important to recognize which bank provides the best fit for its products and services. For the bank seeking to partner with a FinTech company, it is similarly important to identify the potential opportunities within the broader FinTech industry that fit the bank's risk profile, return threshold, and long‐term strategy. Similarly, it is important for the bank to assess which FinTech opportunities provide the added benefit of diversification and risk reduction relative to the bank's existing concentrations.
Basics of Valuation
To assist further with developing an appropriate framework for FinTech partnerships, we briefly review the basics of valuation so that directors and managers of banks and FinTech companies can better understand how FinTech partnerships can impact valuation.
The basic valuation equation is given here and the value of a FinTech company or bank can be broken down as follows:

Value is a function of cash flow, risk, and growth and it is important to have a keen understanding of each valuation element in order to assess value creation.
- Cash flow is the portion of the expected net income of a business that remains for distribution after all necessary expenses, taxes, and reinvestments are made. A portion of net income is reinvested and the more that is reinvested in productive assets that generate a return in excess of the company's cost of equity, the more value is created over time.
- Growth is primarily influenced by two factors: inflation and reinvestment. Reinvestment only influences growth to the extent that funds can be allocated properly into projects whose returns exceed the company's cost of capital. The impact of the reinvestment decision will depend upon the owner's propensity to reinvest in the company and the prospects for generating growth for those reinvestments. If your bank or FinTech company has an abundance of projects that have expected returns in excess of your cost of capital (alternatively known as a number of growth opportunities), then it may be appropriate to retain a greater proportion of earnings to reinvest and fund future growth opportunities (like FinTech, new facilities, personnel, traditional bank acquisitions, etc.).
- Risk is an important consideration for any company, but it is particularly important for banks and FinTech companies. When thinking about risk, consider the following: The absolute riskiness of the project/investment is often less important than the degree to which the addition of that investment/project changes the risk of the company's overall portfolio of projects. For a bank considering a FinTech opportunity such as a potential partnership or acquisition of a FinTech company, it should consider the riskiness of the FinTech company's operations within the context of the bank's entire operations.
For example, consider that the community bank industry today has a greater concentration in real estate–related assets than it did approximately 30 years ago. This would seem counterintuitive coming off of the financial crisis, which was sparked from weak real estate conditions. Similarly, the operations of community banks are often concentrated to a limited geographic market area. This combination of having heavy real estate exposure in a limited geographic area can often have fatal consequences for community banks. Consequently, a community bank with a heavy concentration in real estate loans in a particular market may view an opportunity to partner with a FinTech company offering a new service (like consumer lending, payments, or insurance solutions) more attractively than a bank with a larger, more diversified portfolio. Even though the potential IRRs from the FinTech partnership are the same for both banks, the less diversified, real estate–oriented bank may desire the potential to expand and diversify revenue through enhancing FinTech offerings more than the larger, more diversified bank.
Basics of Capital Budgeting
Now that we have discussed the basics of investor returns and valuation, let's discuss capital budgeting so that bankers can understand how they can consider FinTech partnerships in light of other capital budgeting decisions. Among the potential uses of cash, the decision regarding whether to make capital investments in a business either through reinvesting in the company (i.e., funding the development of another portfolio of projects) or through investing in other potential acquisitions or other FinTech partners is often dependent upon the potential returns of those projects and where those projects lie in the capital budgeting process. (See Table 9.5.)
TABLE 9.5 Capital Budgeting: Sources and Uses of Capital
| Sources of Capital | = | Uses of Capital |
| Earnings | Capital Investment (including Acquisitions) | |
| Borrowing | Debt Repayment | |
| New Share Issuance | Shareholder Dividends | |
| Monetize Assets/Sale Portion of Business | Share Repurchase |
The capital budgeting decision of whether to use cash generated to reinvest in the business or pay those available cash flows to shareholders or debt holders is driven by a number of factors. One key factor to consider is how many attractive capital projects are available to the company. For example, if the company has a plethora of capital projects available and a number that can be demonstrated to be value enhancing (i.e., the potential returns from the projects are in excess of the company's cost of equity), then the strategy to create value and utilize those funds optimally will likely be to invest those cash flows in the available capital projects. The difficult question then becomes prioritizing those capital projects and determining which ones offer the greatest potential to create value and maximize shareholder returns.
However, if it is deemed that there exists a dearth of capital projects that offer attractive returns (as measured by return on investment or internal rate of return relative to the company's cost of equity), then the optimal strategy will likely be to pass on reinvesting in the business and return some or a significant proportion of those earnings to shareholders in the form of dividends or share repurchases or to repay debt holders.
Thus, a key determinant of capital budgeting is determining how many capital projects are available and how attractive the potential returns on those capital investments are relative to the company's cost of capital. If attractive capital projects are available, then the company will likely want to focus on reinvesting earnings. If less attractive capital projects are available, then the company may want to focus on distributing earnings or repurchasing shares. (See Figure 9.1.)
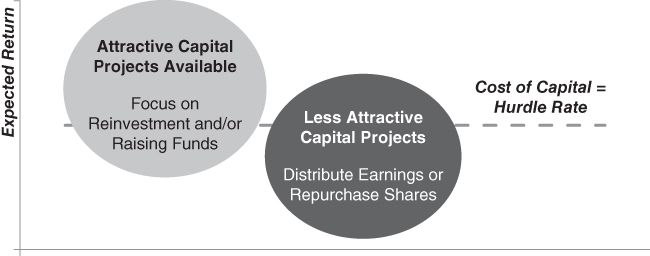
FIGURE 9.1 Attractive vs. Less Attractive Capital Projects
Pulling It Together: FinTech Framework for Banks
To help determine how attractive a FinTech partnership may be in order to compare it to an alternative capital project, an internal rate of return analysis can be utilized. IRR can be beneficial for managers of both FinTech companies and traditional financial services firms as an effective way to measure the relative merits of a variety of capital allocation decisions related to FinTech. Should your bank decide that it wants to develop a particular niche like wealth management, an IRR analysis can be prepared with a wide variety of potential strategies such as exploring the idea of acquiring a robo‐advisor, partnering with a robo‐advisor, building your own robo‐advisory platform, or looking to partner with a traditional asset manager or RIA through either an acquisition or partnership.
While each of these options presents a unique set of considerations and execution issues, an IRR analysis can be prepared for each whereby you can determine the potential financial impact of each and determine which FinTech strategy provides the best potential return while also being consistent with the bank's long‐term strategic plan and market potential. (See Figure 9.2.)
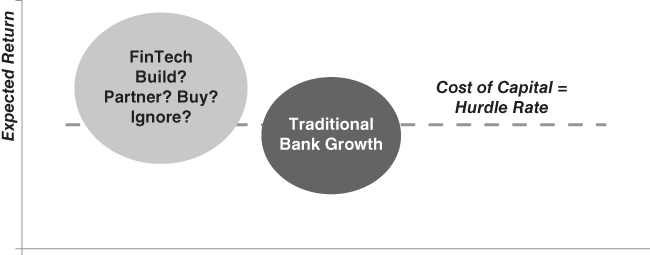
FIGURE 9.2 Considering Returns of FinTech Strategies
For a number of banks, their use of FinTech and other enhanced digital offerings represent one potential capital project that could demonstrate an attractive IRR and enhance value. This is one reason that FinTech has garnered so much attention from banks and the press in recent periods. However, one difficulty for most community bankers is the vast array of FinTech startups that have developed in the last few years and determining which FinTech niche or company offers the greatest potential returns and is the best strategic fit for the bank. Once the ideal FinTech niches are determined, the key strategic question becomes whether to build, buy, or partner in order to enter into that particular niche.
One way to develop a framework to determine which niches and FinTech companies are most attractive is to examine the IRRs from FinTech partnerships in different FinTech niches and compare that to the bank's cost of equity (or required return). Those partnerships and niches that offer IRRs in excess of the bank's cost of equity (or required return) would be attractive FinTech areas and companies to pursue as potential partners as they offer greater returns and would create value over time if the returns exceed the bank's cost of equity. One can also compare these returns to other more traditional growth options like acquiring other banks or building branches. Figure 9.3 provides an example of a FinTech framework for a community bank by comparing the IRRs for different FinTech partnership opportunities with the bank's cost of equity (i.e., the hurdle rate), which was assumed to be in the 10 percent range. For this particular bank, the bank technology and alternative lending niches appear to offer the most attractive potential returns relative to other niches and traditional bank deals.
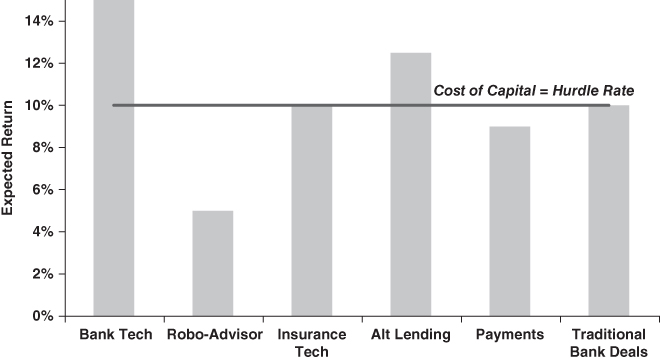
FIGURE 9.3 Hurdle Rates for Transactions
One reason that FinTech partnerships can appear to be so attractive in the current environment is that bank returns on equity are being pressured by the low interest rate environment. For example, the median community bank ROE is in the 6–10 percent range in mid‐2016 compared to 10–15 percent pre–financial crisis. As banks consider different FinTech niches and strategies, it will be important to consider the IRR for different FinTech partnerships and compare those to traditional acquisition strategies, as well as their cost of equity, to determine whether to enter into them.
How to Assess Potential Financial Returns from Partnerships
We now provide an example of an internal rate of return analysis and discuss how to analyze the potential returns and value creation from a FinTech partnership. As previously discussed, by analyzing the key metrics used to measure the potential returns from a FinTech partnership, banks can assess which FinTech companies and structures will be most beneficial to the bank. An internal rate of return analysis can be used to assess FinTech partnerships and determine which partnership may be right for your bank.
Internal Rate of Return Analysis
An internal rate of return analysis derives the discount rate that equates the cash outlays to initiate the partnership (cost to utilize the technology/software, roll out the product, etc.) to the earnings generated from the partnership. The IRR can also be compared to the company's cost of equity to determine whether the potential partnership creates value for the acquirer's shareholders. To the extent that the IRR is greater than the cost of equity, value is created as the investment in the partnership is generating a return in excess of the company's cost of equity.
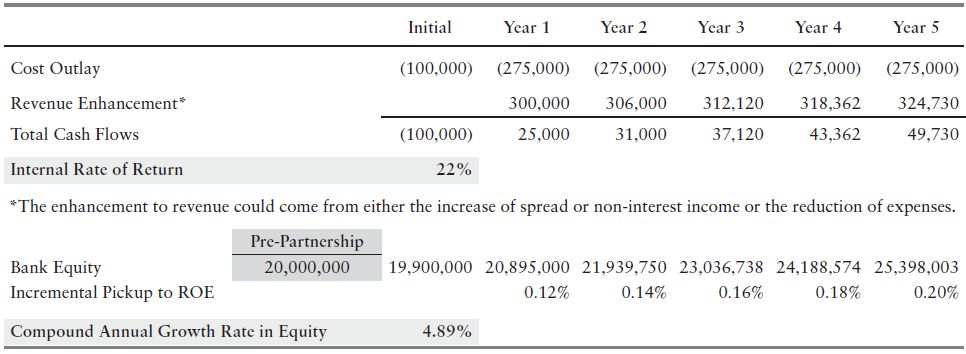
To illustrate how to use IRR to analyze a FinTech partnership, let's consider the following. A FinTech company approaches a bank or vice versa about new software products that will provide the bank with additional revenue opportunities from new deposit product offerings that increase non‐interest income. The costs of the products are an initial installation fee of $100,000 and $275,000 for the next few years to pay for the software license. The software is expected to increase revenue by approximately $300,000 in Year 1 and then grow incrementally thereafter. The IRR analysis allows the bank to model the potential rate of return from the investment (22%) and also analyze the potential pickup in ROE (12 to 20 bps) and compound annual growth rate in equity (∼5%) over the next five‐year period (see Table 9.6).
TABLE 9.6 FinTech Partnership Example
Since the IRR is above the typical cost of equity and ROE of most community banks, the FinTech partnership would appear to enhance the bank's ROE and create enough value to support the potential expenditure. (See Table 9.7.)
TABLE 9.7 FinTech Partnership: IRR and ROE Spread
| FinTech Partnership | |||
| IRR | Bank ROE | IRR − Bank ROE | |
| Adding Product | 22% | 10% | 11.9% |
The nice thing about both the IRR and the IRR less COE metric (return on investment minus cost of equity) is that you can compare these metrics across different FinTech partnerships or other more traditional strategic alternatives to assess which option makes sense. However, both metrics are very sensitive to different assumptions. IRR, for example, can be very sensitive to the pro forma earnings stream as well as the terminal value multiple utilized. IRR can also be very sensitive to assumptions such as the revenue synergies and the bank's cost of equity.
Investing in a FinTech Partner
Another item to consider when analyzing FinTech partnerships is whether the bank would also like to invest in the FinTech company. One could make a compelling case that banks should seriously consider such investments. Recall in Chapter 3 the significant value created for both the FinTech companies and the traditional community banks that invested in FinTech companies like Visa and MasterCard. A combination investment/partnership has a number of advantages for both the bank and the FinTech company.
- The bank can benefit the FinTech company by advocating for its product to their fellow bankers and by providing useful insights into real‐world issues experienced within their customer base as they interact with the offering—along with insights into how the regulatory agencies view the product.
- The bank can enhance returns should the FinTech company be successful.
- By making a minority investment, the accounting treatment is more favorable for the bank (i.e., no goodwill creation). We address the accounting considerations related to FinTech acquisitions more fully in Chapter 11.
For these reasons, the bank may have more to consider beyond just whether to engage in a partnership with the FinTech company and the bank may consider whether to invest in the FinTech company's next funding round, or even acquire the FinTech company outright. There are a number of factors to consider; however, determining the IRR of each scenario can help the bank identify which option may be most favorable.
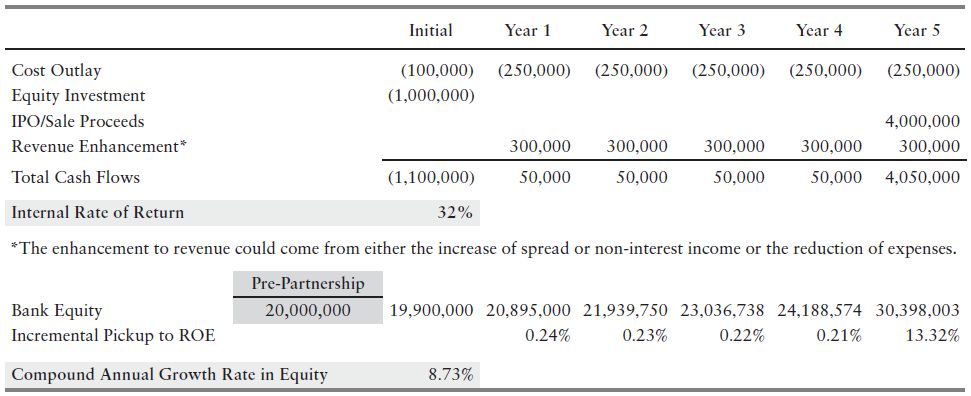
Let's look at the same FinTech partnership and consider a strategy whereby the bank also makes a minority investment in the FinTech company (see Table 9.8). This strategy generates a higher internal rate of return assuming both an investment and exit within the next five years; however, it also requires more capital to be allocated to the project (i.e., it will be more expensive).
TABLE 9.8 Equity FinTech Partner (Minority Shareholder)
The bank may then also want to examine the potential IRR for a full acquisition of the FinTech company (see Table 9.9). In this case, the bank can again run an IRR analysis and compare the results to the other two strategies—being a minority investor and/or just utilizing the FinTech company's products.
TABLE 9.9 FinTech (Full Acquisition)
| Internal Rate of Return (Full Acquisition) | Closing | Year 1 | Year 2 | Year 3 | Year 4 | Year 5 |
| Deal Consideration | (25,000) | |||||
| Closing Costs | (2,000) | |||||
| Opportunity Cost of Cash | (1,000) | (1,000) | (1,000) | (1,000) | (1,000) | |
| Cash Flows Generated from Target | 0 | 1,000 | 2,000 | 3,000 | 4,000 | |
| Terminal Value | 60,000 | |||||
| Total Cash Flows | (27,000) | (1,000) | 0 | 1,000 | 2,000 | 63,000 |
| Internal Rate of Return | 19% |
Once all three options (partnership only, partnership plus minority investment, and partnership through full acquisition) are modeled, the bank can compare the potential internal rates of return of each option and determine which generates the highest potential return. As shown in Figure 9.4, each structure enhances the bank's returns; thus a partnership on some level ought to be pursued. What's more, the bank could elect to test the FinTech company's product initially (i.e., partner only) and then retain the option to invest or acquire the company later.
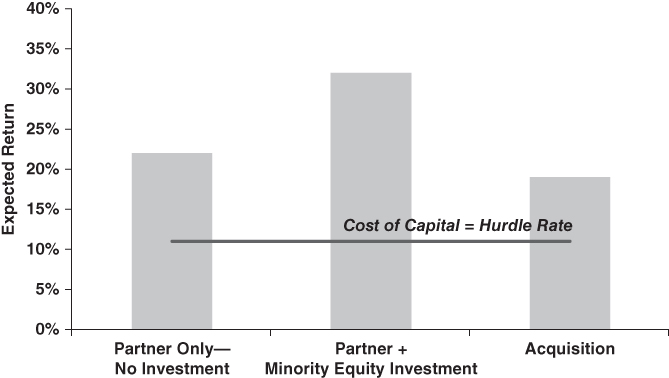
FIGURE 9.4 FinTech Partner/Invest in/Acquire Analysis
In this example, the partnership plus the minority equity investment produces the highest internal rate of return and thus the largest spread over the bank's return on equity. Therefore, this strategy would be most conducive to creating strategic value for the bank. However, other considerations may be important enough to tilt the bank to another structure. For example, investing in the FinTech company requires additional capital be deployed to the investment, which means greater risk accrues. Therefore, the expected potential return should be higher for an equity partnership than a non‐equity partnership in order to be worth the additional risk of the investment (see Table 9.10).
TABLE 9.10 FinTech Partnership and ROE Spread Comparison
| FinTech Partnership | |||
| IRR | Bank ROE | IRR ‐ Bank ROE | |
| Adding Product | 22% | 10% | 11.9% |
| Product + Equity Investment | 32% | 10% | 22.4% |
| Complete Acquisition | 19% | 10% | 9.1% |
Other Key Questions When Thinking About FinTech Partnerships
Beyond the financial decisions and return analyses discussed previously in this chapter, there are additional items for a community bank to consider when partnering with a FinTech company.
- Is the bank comfortable with the FinTech company's risk profile? Managing risk is a key responsibility of managers and directors of financial services companies. Risk is inextricably linked with performance in highly leveraged entities like banks. Growth absent an appropriate consideration of risk can lead to poor outcomes. For example, a bank that aggressively expands into a new lending area may see a few years or quarters of higher interest income wiped out quickly by credit losses on poorly underwritten loans. Thus, it is critical for banks to understand and manage the potential risk from their FinTech partnership and ensure that the risk is appropriate for their institution. Banks are also more highly regulated than non‐bank FinTech companies. Therefore, it is important for the bank to assess the suitability of the partnership given their risk appetite and regulatory/compliance burdens. For FinTech companies seeking banking partners, it is important to understand the regulations and compliance burdens of banks and be prepared to address those concerns. However, these regulations may also offer opportunities for FinTech companies to provide “RegTech” solutions and expand their revenue and product mix.
- What will the regulatory reaction be? It is not uncommon for most banks to relay to their regulators their intent to enter into a significant partnership with a FinTech company. This may be the preferred method, as opposed to asking for approval after the fact. When presenting the FinTech partnership, banks may need to be able to demonstrate the potential of the partnership to enhance the bank's product offerings and expand its services to a larger customer base within the bank's market area. The bank may also need to demonstrate that the additional risk of entering into the partnership is offset by the potential to enhance the bank's returns and/or profitability. The regulatory vetting process often is a significant hurdle for bank/FinTech company partnerships. However, overcoming that hurdle can provide an advantage for the FinTech company and the bank once complete because many competitors may not attempt it.
- Who will maintain the primary relationship with the customer? There are certain FinTech solutions that allow the bank to improve its ability to serve and enhance its relationship with customers. For example, a bank that offers a white‐labeled technology solution may enhance its product offering while still remaining the primary contact for the customer. However, certain FinTech solutions and partnerships may create a dilemma for banks and their partners as they work together. If a bank partners with a FinTech company for a new lending product or payment offering, several key questions arise, including: Who will ultimately service the customer's account? Will the bank remain the primary contact for the customer during this process or will it transfer to the FinTech company? Who will own the customer relationship or will it be shared?
- Is the partnership consistent with the bank's long‐term plan? The Office of the Comptroller of the Currency (OCC) issued a whitepaper on March 31, 2016, titled “Supporting Responsible Innovation in the Federal Banking System: An OCC Perspective.”5 The OCC defines responsible innovation in this whitepaper as: “The use of new or improved financial products, services, and processes to meet the evolving needs of consumers, businesses, and communities in a manner that is consistent with sound risk management and is aligned with the bank's overall business strategy.”
The OCC whitepaper then discusses eight principles related to responsible innovation. One of the eight principles is: “Encourage banks of all sizes to integrate responsible innovation into their strategic planning.” The whitepaper notes that a decision to offer innovative products should be aligned “with the bank's long‐term business plan rather than following the latest fad or trend.” The OCC goes on to note that partnerships should help the bank achieve its strategic objectives and consider traditional strategic planning criteria (such as consistency with the bank's risk profile, business/capital plan), and the decision should consider both realistic financial projections and exit strategies. Thus, banks should ensure that the FinTech partnerships are consistent with their long‐term strategic plan and be prepared to demonstrate that to both their boards and regulators.
CONCLUSION
FinTech partnerships can be attractive to banks for many of the reasons cited in this chapter and they are increasingly becoming more common. Partnerships with banks can also prove to be beneficial for FinTech companies. For those bankers interested in exploring FinTech partnerships, the task can be daunting, given the number of FinTech niches and companies that are focused on unbundling traditional financial services offerings. By relying on the appropriate strategies, frameworks, and return analyses for analyzing and structuring potential FinTech partnerships, forward‐thinking bankers can leverage FinTech to enhance profitability and create value for their banks. The vast array of FinTech companies and their desire to partner with banks can be turned into a positive for those banks utilizing the framework and analysis discussed in this chapter as they can afford to be selective and prioritize which FinTech partnerships are most attractive to the bank.