
6. illustrate your presentation
Images add an important spice to any presentation. Some information is better presented in a graphic form, and often you’ll find that your audience will better grasp your message with graphical help. Your presentation can include many different kinds of information that isn’t text, such as pictures, charts, diagrams, tables, clip art, sound effects, or video clips. Very few, if any, presentations include all of these elements, but you’ll probably want to add at least some of them to every presentation.
This chapter is where you’ll use the images and other media files that you gathered in Chapter 3. If you made a list of files and where they go, find and refer to it as you work through the chapter.
In this chapter, you’ll learn how to add images and media clips to your presentation; use PowerPoint’s drawing tools to add interest to your slides; and add tables, diagrams, and charts to your presentation.
add images from disk
You can add pictures to your PowerPoint presentation by using files on your hard disk or on a CD and inserting them in the presentation.
Display the slide that you want the image on. It should already have a slide layout with a placeholder ready to accept the image. If it doesn’t, apply such a layout using the instructions in Chapter 4.
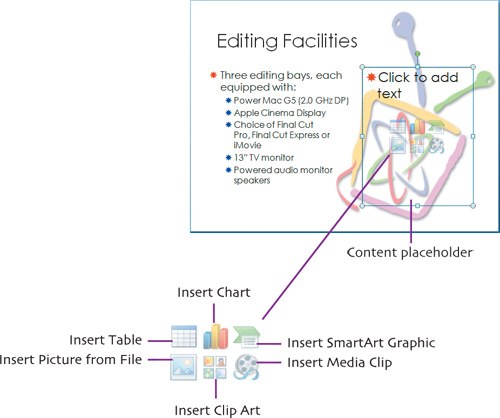
If you used one of the Content layouts in PowerPoint 2007, click the Insert Picture from File icon in the Content box.
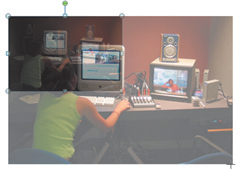
The Insert Picture dialog appears. Navigate to the picture you want, then click Insert. PowerPoint automatically scales the image to fit inside the placeholder, and the image appears on your slide.

If you don’t like the position and size of the image, click on the image and drag it to where you want it to be. Then click one of the selection handles on the image and drag to resize it. As you drag, you’ll see a ghostly version of the picture, indicating how large the picture will be when you release the mouse button.
customize images
When you selected a picture to resize it, you may have noticed that a new contextual tab, Picture Tools, appeared on the Ribbon, with a Format tab below it. If you don’t see this, click on a picture to select it and make the Format tab appear, then click the Format tab to display the tools you can use to modify and customize your images.

There are many things you can do with this tab, but we’ll only discuss two of the most useful features, cropping a picture and framing it.


Drag any of the handles to crop out unwanted portions. Click anywhere off the image to lock in the change.
Placing a frame around an image sets it off from the rest of the slide, and makes it stand out. PowerPoint has 28 preset frame styles, or you can create your own with the controls in the Picture Styles group.

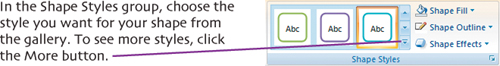
To apply a frame to an image, first select the image, then click one of the frame presets in the Picture Styles group. Click the More button to pop-up the gallery of all the frame choices. As you hover over a preset with the mouse pointer, the frame effect is applied to the image as a preview. Click the preset you want to use to lock it in.
You’re not limited to the preset choices, however. After you pick a preset that is closest to what you want, use the Picture Shape, Picture Border, and Picture Effects pop-up menus in the Picture Styles group to further modify the frame to fit the style of your presentation.

add clip art
Another way to add images to your presentation is by using clip art, graphics that Microsoft provides to spice up your presentations. These are available in the Clip Organizer. First, display the slide that you want the image on. If it doesn’t already have a slide layout with a placeholder ready to accept the image, apply such a layout using the instructions in Chapter 4.
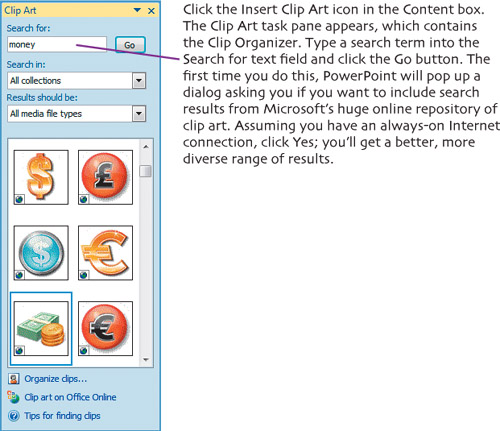
Scroll through the search results until you find the one that you want. When you find the clip art that you like, double-click it. The clip art appears on your slide. If needed, you can resize it, or make any of the other image modifications discussed in this chapter.

add WordArt
You might want to add a bit more flash to headline or caption text on your slides. As a fancier alternative to the regular text tools in the Font group on the Home tab, consider formatting with WordArt instead. WordArt is text that already has a variety of special effects applied to it.

![]()
![]()

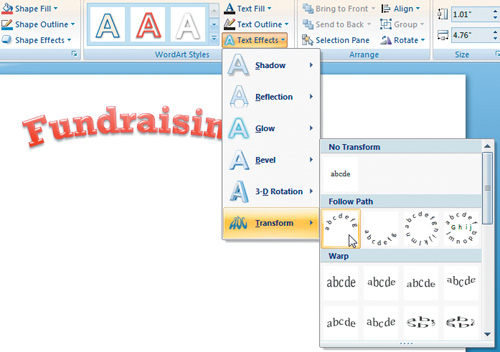
For example, let’s say that you wanted to wrap some text around a logo; WordArt can do that and much more. Here, it has also produced the colored and outlined text.
Begin by displaying the slide where you want the WordArt. Click Insert > WordArt, which pops up a gallery with style samples matched by color to your presentation’s design. Choose a style, and a text box with sample text appears on the slide, with the text selected. Type your text.
Chances are you won’t like the default WordArt font, so select the text and right-click to bring up the contextual formatting toolbar. Use this to make changes in the text’s font, size, and style.
For more extensive changes to the look of the WordArt, use the Drawing Tools > Format contextual tab, which appears whenever WordArt is selected. The Text Effects menu in the WordArt Styles group gives you an almost endless range of customizations, including 3-D rotations and transformations that distort the shape of the text (that’s how I got the text wrapped around the logo above). As you choose your effects, PowerPoint shows you a live preview, as shown here.
use the drawing tools
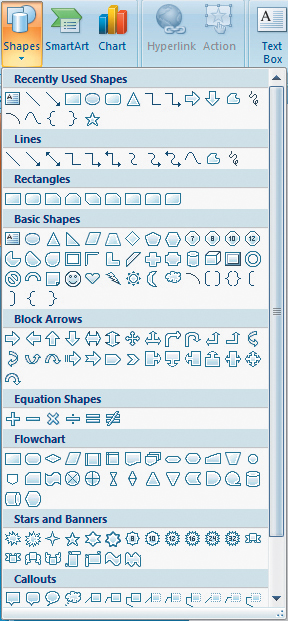
If you’re the kind of person who can’t draw a straight line, much less a circle or an octagon, then PowerPoint’s drawing tools are for you. PowerPoint offers tools on the Insert tab with many ready-made shapes that can be drawn easily onto your slides. These shapes include lines, arrows, stars, flowchart symbols, callout boxes, and more.
Choose Insert > Shapes, then click the shape that you want from the pop-up menu. As you can see, the shapes are broken into categories in the menu. The cursor becomes a cross.
Click and drag on the slide to draw the shape object as large as you wish. Here, I’m using a Cloud callout shape, which serves as a thought bubble for a photo.

Position the drawn shape where you want it, and resize it as needed. By default, PowerPoint gives the shape a colored fill, which isn’t what we want for a thought balloon. Here’s how to change that. When the shape is selected, the Drawing Tools contextual tab appears in the Ribbon, with a Format tab beneath it. Click the Format tab to display the tools.
For the thought bubble, I chose a style with a colored outline, but no colored fill. Next, I wanted to make the shape pop a bit more, so I added an inner shadow from the Shape Effects menu. To add text inside the shape, right-click and choose Edit Text from the contextual menu. An insertion point appears in the center of the shape. Type your text, then format it as you want (font, size, and so on) by selecting the text, right-clicking, and using the style controls in the contextual formatting toolbar.

add sound files
Usually, there’s no quicker way to annoy your audience than by adding sounds to your slides. It’s a big tip-off of novice PowerPoint jockeys. But there are certainly valid reasons for using sounds in presentations. For example, a presentation about music might use brief clips, or anthropologists could include snippets of a language they are studying.
To use a sound, you’ll need the sound files to be on your hard disk in a format that your computer can play.
Choose Insert > Sound. The Insert Sound dialog appears.
Navigate to the sound file you want, select it, and click Open.
PowerPoint asks if you want the sound to start automatically when you switch to the slide, or only when you click a button on the slide. Make your choice.

The sound icon appears on the slide (it’s not visible to the audience during the presentation). Move it to where you want it. To preview the sound, double-click the sound icon. During the presentation, you will need to click the icon to play the sound, unless you previously told PowerPoint to start the sound automatically.

use video clips
Video clips can be very effective in a presentation. You could include a video quote from your product manager, or show a brief tutorial. In the presentation for Access Healdsburg, I used a video clip to take audiences on a tour of the television station’s studios. Video clips must be on your hard disk in a format that your computer can play.
Choose Insert > Movie. The Insert Movie dialog appears. Navigate to the movie file you want, select it, and click Open.
PowerPoint asks if you want the movie to start automatically when you switch to the slide, or only when you click the movie. Decide which you want.
The movie appears on your slide. You might have to reposition and resize it.

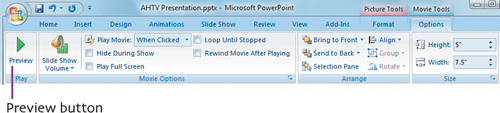
To play the movie to preview it, select it, and the Movie Tools > Options contextual tab appears on the Ribbon. Click Preview in the Play group. You can also double-click the movie to start the preview; clicking it again stops playback. When you give the presentation, click the movie to play it, unless you told PowerPoint to automatically play it when you switched to the slide. You can apply further controls over playback with the choices in the Movie Options group.
add SmartArt


A gallery will appear, and if you like one of the choices, choose it. To see all the choices, choose More SmartArt Graphics from the bottom of the gallery. The Choose a SmartArt Graphic dialog appears. This dialog has seven categories of diagrams. Some categories, such as List, are great at spicing up a bulleted list, while others, such as Hierarchy, are perfect for organizational charts. The funding diagram I used is in the Cycle category.

Select the SmartArt graphic you want; when you select it, an explanation of the graphic type appears at the right of the dialog. Click OK, and the graphic appears on the slide, and the SmartArt Tools contextual tab also appears, with two subtabs, Design and Format.
Using tools in these two subtabs, adjust the look of the graphic, changing the number of elements as necessary. For example, the initial SmartArt was a bit dull-looking:

I changed the coloring, thickened up the radial lines, and added a 3-D look. I also adjusted the size of the text in some of the circles. The resulting diagram gets the message across.

You can easily change the text inside the SmartArt by typing it in the list next to the graphic. This is also how you add text to SmartArt that you insert, rather than converting it from an existing bulleted list. To insert such a graphic, choose Insert > SmartArt, then choose the style you want from the resulting Choose a SmartArt Graphic dialog.

add charts
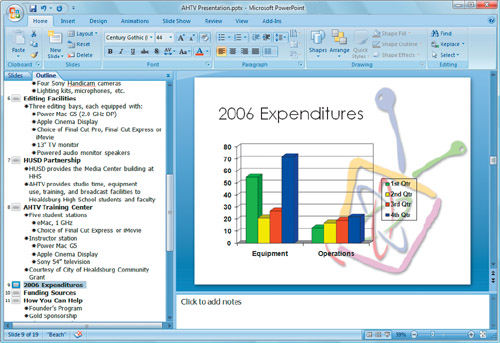
Many slide presentations include a set of numbers of some kind—for example, projected fundraising for next year, or a look back at last year’s budget versus actual numbers. It’s difficult for an audience to understand long columns of numbers, especially in the short time they would be on the screen during your presentation. A chart offers a much better way to let people quickly grasp the relationship between numbers and helps them spot trends.
To add a chart to one of your slides, start by clicking the Insert Chart button in the Content box on one of your slides. The Insert Chart dialog appears, with a list of chart types. Click to select the type you want to use, then click OK.

If Excel 2007 is installed on your machine, it starts up, creating a new worksheet populated with sample data. Change the sample data in the worksheet one cell at a time, entering your own data. As you change the worksheet, the chart automatically updates in PowerPoint. When you are done entering the data, close the Excel window; the data is automatically saved and the worksheet is embedded into the PowerPoint presentation file.

When the graph is selected, the Chart Tools contextual tab appears, with three subtabs: Design, Layout, and Format. Use these tabs to make any other changes you need in the chart, such as changing the chart type, chart colors, and so on. You’ll probably want to use the Design subtab to apply Chart Styles and Chart Layouts. Experiment with the galleries in these two groups until you get the look you want for your chart.

The completed chart should be as simple as possible, attractive, and convey the information with a minimum of audience effort.

add tables
Tables are a great way to show relationships between groups of data, and to get a lot of information into your presentation in an easy-to-understand fashion. Tables can contain words, numbers, or both.
In the Content box on one of your slides, click Insert Table. The Insert Table dialog appears. Enter the number of rows and columns that you need in your table, then click OK. A blank table is inserted into the current slide, with a default color format and style that matches your presentation’s design.

If you want, point at the horizontal or vertical lines inside the table until the cursor turns into a double-headed arrow. Then click and drag to resize the rows or columns.
Click inside the first cell of the table to get an insertion point, then enter your data into the cells. You can press the Tab key to move between cells without using the mouse.
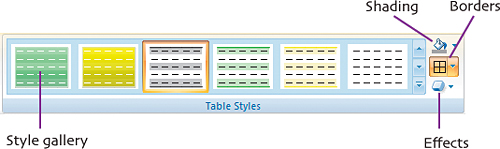
When the graph is selected, the Table Tools contextual tab appears, with two subtabs: Design and Layout. Use these tabs to make any other changes you need in the table, paying particular attention to the Table Styles group on the Design tab. This gallery gives you a wide range of styles from which to choose, and you can tweak the styles further using the Shading, Borders, and Effects menus in this group.
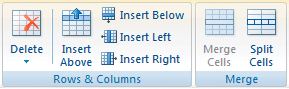
To modify the table’s structure, you need to use the Layout subtab. The Rows & Columns group lets you insert and delete rows or columns; just select one or more rows or columns, then click the appropriate button. You can change the cell structure by selecting rows or columns, then clicking either Merge Cells or Split Cells.
When you are done entering data and formatting, click on the slide background to deselect the table.

extra bits
add images from disk p. 60
• You can also add an image to a slide by dragging and dropping it from the desktop onto your slide. Sometimes this is faster than navigating through the Insert Picture dialog, but the disadvantage to dragging and dropping (as opposed to using a placeholder to insert the image) is that you’ll have to resize the image yourself.
add clip art p. 64
• Here’s a handy tip: add graphics that you use often, such as a company logo, to the Clip Organizer so that it’s easy to use and reuse. Click the Organize clips link at the bottom of the Clip Art task bar, which launches the Clip Organizer as a separate program. From the Clip Organizer’s File menu, choose Add Clips to Organizer > On My Own. This brings up an Open dialog. Navigate to the clip you want, select it, and click the Add button. The clip will then be available in the Clip Art task bar.
• You can also store photographs and media clips, not just line art, in the Clip Organizer.
add WordArt p. 65
• Oddly, Microsoft Word 2007 has a completely different version of WordArt in it, one that is considerably more limited than PowerPoint’s implementation, but also provides effects that PowerPoint can’t produce. You can use WordArt created in either program by copying and pasting it between programs.
use the drawing tools p. 66
• You can layer text and graphics, so another way to, for example, put text inside a callout shape is to insert a Text Box over the callout shape.
• You can change the line weight, line style, and line color of a shape by choosing Drawing Tools > Format > Shape Outline, then choosing what you want from the menu. If your shape is a line, you can use the same menu to turn it into an arrow; there are a number of arrow styles available.
• If you need to precisely line up objects, you’ll find alignment and distribution commands in the Arrange group of the Drawing Tools > Format tab.
add sound files p. 68
• PowerPoint can use the following kinds of sound files: AIFF, AU, MIDI, MP3, Windows Audio file (WAV), and Windows Media Audio file (WMA).
• Depending on your presentation setting, it can be effective to attach a music file to the first and last slides of your presentation, which helps introduce and end the show.
• You’ll find additional sound effects in the Clip Organizer.
use video clips p. 69
• PowerPoint can use the following kinds of video files: Windows Media file (ASF), Windows Video file (AVI), MPEG, and Windows Media Video files (WMV).
• To use a QuickTime movie in a PowerPoint presentation, you must either create a hyperlink to the QuickTime file, which will then launch the QuickTime Player, or you must convert the movie to a supported format.