
Software Performance Engineering of an Embedded DSP System Application
Based on “Winning Teams; Performance Engineering Through Development” by Robert Oshana, which appeared in IEEE Computer, June 2000, Vol 33, No 6. ©2000 IEEE.
Introduction and Project Description
Expensive disasters can be avoided when system performance evaluation takes place relatively early in the software development life cycle. Applications will generally have better performance when alternative designs are evaluated prior to implementation. Software performance engineering (SPE) is a set of techniques for gathering data, constructing a system performance model, evaluating the performance model, managing risk of uncertainty, evaluating alternatives, and verifying the models and results. SPE also includes strategies for the effective use of these techniques. Software performance engineering concepts have been incorporated into a Raytheon Systems Company program developing a digital signal processing application concurrently with a next generation DSP-based array processor. Algorithmic performance and an efficient implementation were driving criteria for the program. As the processor was being developed concurrently with the software application a significant amount of the system and software development would be completed prior to the availability of physical hardware. This led to incorporation of SPE techniques into the development life cycle. The techniques were incorporated cross-functionally into both the systems engineering organization responsible for developing the signal processing algorithms and the software and hardware engineering organizations responsible for implementing the algorithms in an embedded real-time system.
Consider the DSP-based system shown in Figure A. 1. The application is a large, distributed, multiprocessing embedded system. One of the sub-systems consists of two large arrays of digital signal processors (DSP). These DSPs execute a host of signal processing algorithms (various size FFTs and digital filters, and other noise removing and signal enhancing algorithms). The algorithm stream being implemented includes both temporal decomposition of the processing steps as well as spatial decomposition of the data set. The array of mesh-connected DSPs is used because the spatial decomposition required maps well to the architecture. The required throughput of the system drives the size of the array. The system is a data driven application, using interrupts to signal the arrival of the next sample of data. This system is a “hard” real-time system in the sense that missing one of the data processing deadlines results in a catastrophic loss of system performance.

This system was a hardware-software co-design effort. This involved the concurrent development of a new DSP-based array processor using high performance DSP devices. In this project, the risk of the delivered system not meeting performance requirements was a serious concern. To further complicate matters the algorithm stream was being enhanced and revised as part of the development effort. The incorporation of SPE techniques into the development processes of the various functional organizations was deemed critical to mitigating these risks.
The issue of performance was addressed from the inception of the program throughout its development phases. The main measures of performance are captured in three metrics:
These are the metrics of choice because monthly reporting of these metrics was a customer requirement for the program. Initial estimates of these metrics were made prior to the start of the program and updated monthly during the development effort. Uncertainties associated with key factors driving these estimates were identified. Plans for resolving these uncertainties during the development effort were developed and key dates identified. Updating the metrics and maintaining the associated risk mitigation plans was a cross-functional collaborative effort involving systems engineering, hardware engineering and software engineering.
Initial performance estimates and information requirements
The information generally required for a SPE assessment is [1]:
Workload – The expected use of the system and applicable performance scenarios. We chose performance scenarios that provided the array processors with the worst case data rates. These worst case scenarios were developed by interfacing with the users and our system engineers.
Performance objectives – This represents the quantitative criteria for evaluating performance. We used CPU utilization, memory utilization, and I/O bandwidth because of the customer requirement that we report on these monthly.
Software characteristics – This describes the processing steps for each of the performance scenarios and the order of the processing steps. We had accurate software characteristics due to an earlier prototype system using a similar algorithm stream. We also had an algorithms description document detailing the algorithmic requirements for each of the functions in the system. From this a discrete event simulation was developed to model the execution of the algorithms.
Execution environment – This describes the platform on which the proposed system will execute. We had an accurate representation of the hardware platform due to involvement in the design of the I/O peripherals of the DSP as well as some of the DSP core features as well. The other hardware components were simulated by the hardware group.
Resource requirements – This provides an estimate of the amount of service required for the key components of the system. Our key components were CPU, memory and I/O bandwidth for each the DSP software functions.
Processing overhead – This allows us to map software resources onto hardware or other device resources. The processing overhead is usually obtained by benchmarking typical functions (FFTs, filters) for each of the main performance scenarios.
CPU throughput utilization was the most difficult metric to estimate and achieve. Therefore, the rest of this paper will focus primarily on the methods we used to develop an accurate estimate for the CPU throughput utilization metric.
Developing the initial estimate
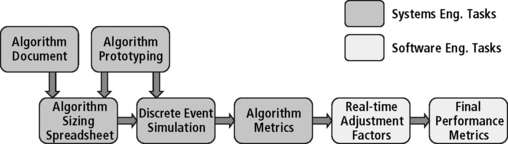
The process used to generate the initial performance metric estimates is shown in Figure A.2. This flow was used throughout the development effort to update the metrics. The algorithm stream is documented in an algorithm document. From this document, the systems engineering organization developed a static spreadsheet model of the algorithm stream which provided estimates of throughput and memory utilization for each of the algorithms in the algorithm requirements document. The spreadsheet includes allowances for operating system calls and inter-processor communication. The systems engineering organization used a current generation DSP processor to perform algorithm prototyping and investigation activities. The results of this work influenced algorithm implementation decisions and were used to develop the discrete event simulations used to estimate the performance metrics. A discrete event simulation was used to model the dynamic performance of the algorithm stream. The simulation model included allowances for operating system task switches and associated calls. The initial algorithm spreadsheet of resource allocations for each algorithm and discrete event simulation processes provide the system engineering ‘algorithm’ performance metrics. At this point the metrics reflect the throughput, memory, and I/O bandwidth required to perform the algorithms defined in the algorithm document and implemented using the prototype implementations. The software engineering organization then updates the performance metrics to reflect the costs of embedding the algorithm stream in a robust, real-time system. These metric adjustments include the effects of system-level real-time control, built-in-test, formatting of input and output data, and other ‘overhead’ functions (processing overhead) required for the system to work. The results of this process are the reported processor throughput, memory utilization and I/O utilization performance metrics.
Key factors in the spreadsheet that influence the processor throughput metric are:
• The quantity of algorithms to implement
• Elemental operation costs (measured in processor cycles)
The quantity of algorithms to perform is derived from a straightforward measurement of the number of mathematical operations required by the functions in the algorithm stream. The number of data points to be processed is also included in this measurement. The elemental operation costs measures the number of processor cycles required to perform multiply accumulate operations, complex multiplies, transcendental functions, FFTs, and so on. The sustained throughput to peak throughput efficiency factor de-rates the “marketing” processor throughput number to something achievable over the sustained period of time a real world code stream requires. This factor allows for processor stalls and resource conflicts encountered in operation. The processor family speed-up factor was used to adjust data gained from benchmarking on a current generation processor. This factor accounted for the increase in clock rate and number of processing pipelines in the next generation device compared to its current generation predecessor.
Key factors in the spreadsheet that influence the memory utilization metric are:
• Size and quantity of intermediate data products to be stored
• Dynamic nature of memory usage
• Size and quantity of input and output buffers based on worst case system scenarios (workloads)
The size and quantity of intermediate data products is derived from a straightforward analysis of the algorithm stream. A discrete event simulation was used to analyze memory usage patterns and establish high water marks. The bytes/data product and bytes/instruction were measures used to account for the number of data points being processed and storage requirement for the program load image.
All of these areas of uncertainty are the result of the target processor hardware being developed concurrently with the software and algorithm stream. While prototyping results were available from the current generation DSP array computer, translating these results to a new DSP architecture (superscalar architecture of the C40 vs. the very long instruction word (VLIW) of the C67 DSP), different clock rate, and new memory device technology (synchronous DRAM vs. DRAM) required the use of engineering judgement.
Tracking the reporting the metrics
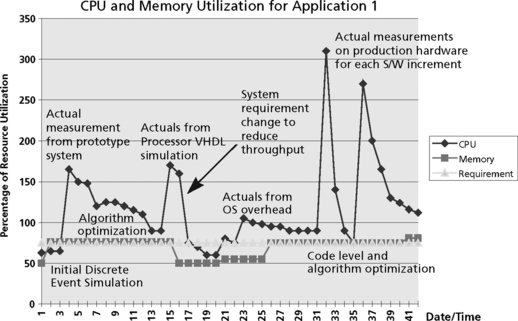
The software development team is responsible for estimating and reporting metrics related to processor throughput and memory. These metrics are reported periodically to the customer, and are used for risk mitigation. Reserve requirements are also required to allow for future growth of functionality (our reserve requirement was 75% for CPU and memory). Throughout the development life cycle, these estimates varied widely based on the different modeling techniques used in the estimation and hardware design decisions which influenced the amount of hardware available to execute the suite of algorithms as well as measurement error. Figure A.3 shows the metric history for throughput and memory for the first array processor application. There is a wide variability in the throughput throughout the life cycle, reflecting a series of attempts to lower the throughput estimate followed by large increases in the estimate due to newer information. In Figure A.3, the annotations describe the increases and decreases in the estimate for the CPU throughput measurement. Table A. 1 describes the chronology of this estimate over the course of the project (not completed as of this writing).
A.1
Chronology of CPU Throughput Reduction for Application 1
| Increase or Decrease in Metric | Explanation |
| Initial discrete event simulation was used as the starting point for the metric estimation | Discrete event simulation was built using algorithm cycle estimations and first order modeling for task iterations due to context switching, and so on. |
| Measurement on prototype C40 based array | Prototype code was ported to a C40 based DSP small scale array and measured. The measurement was then scaled based on the speedup of the C67 based DSP full scale array. |
| Algorithm level optimization | Algorithms were made more efficient using algorithm restructuring methods and reducing complexity in other areas of the algorithm stream. |
| Processor VHDL measurement | Big increase in throughput measurement was due to unexpected high cost of accessing data from external (off-chip) memory. Several benchmarks were performed and scaled to the entire application |
| System level requirement change | Project decision was made to change a system level parameter. This caused significant algorithm restructuring and was an unpopular decision with the customer. |
| OS level overhead measured | Because the processor was new, the COTS OS was not immediately available. This point indicated the first time to run the application in a multitasking environment with the OS. |
| Actuals on production hardware array of DSPs for each software increment | The production code was initially developed without code optimization techniques in place (Make it work right and then make it work fast). Initial measurement for the full algorithm stream was not entirely optimized when we first took the measurement. |
| Continued code and algorithm level optimization | Dedicated team in place to work code optimization and other algorithm transformation techniques to reduce CPU throughput (i.e., taking advantage of symmetry in the algorithms and innovative techniques to reduce communications between DSPs which were expensive). |
The first large increase in the estimate came as a result of implementing the algorithm stream on a prototype current generation processor. These measurements were then scaled based on the anticipated performance of the next generation processor. An effort was then undertaken to optimize the implementation of the algorithm stream to lower the throughput estimate.
The next unexpected increase came from running representative benchmarks on the next generation cycle accurate simulator. This simulation allowed us to estimate the true cost of external memory accesses, pipeline stalls, and other processor characteristics that increased the cost of executing the algorithms. These results led the development teams to undertake another significant effort to optimize the algorithm stream for real-time operation. The main techniques undertaken during this phase included instrumentation of the direct memory access (DMA) to stage data on and off chip, re-structuring of code to allow critical loops to pipeline, assembly language implementation of critical algorithm sections, and efficient use and management of on-chip memory where memory access time is much shorter.
The representative benchmarks showed us that we could reduce the throughput using code-level optimization techniques (use of on-chip memory, pipelining of important loops, etc) but we were still in danger of not meeting our overall throughput requirement. It was at this time that a system requirement was modified to reduce throughput. Although a very unpopular decision with the customer (the change reduced data rate and performance of the algorithms), it allowed us to save money by not having to add additional hardware to the system (which is more cost per unit delivered). Algorithm studies also showed that we could still meet system performance by improvements in other areas of the system.
The third major increase came when we measured the full application on the target array of DSPs. The main reason for the increase was due to the fact that many of the algorithms were not optimized. Only a small percentage of algorithms were benchmarked on the processor VHDL simulator (representative samples of the most commonly used algorithms such as the FFTs and other algorithms called inside major loops in the code). The software group still needed to employ the same optimization techniques for the remaining code for each of the software increments being developed. By this time the optimization techniques were familiar to the group and the process went fairly fast.
The memory estimate, although not as severe as the throughput estimate, continued to grow throughout the development cycle. The main reasons for the increase in memory were:
• additional input and output buffers required for a real time system to operate;
• additional memory was required for each section of code that is instrumented to use the DMA (although this does save on throughput cycles);
• additional memory is needed for code optimization techniques such as loop unrolling and software pipelining which cause the number of instructions to increase.
The life cycle throughput estimates for the second array processor application is shown in Figure A.4. A similar pattern in the reported numbers is seen here due to the same basic issues. Table A.2 shows the chronology of this CPU utilization estimation.
A.2
Chronology of CPU throughput reduction for application 2
| Increase or Decrease in Metric | Explanation |
| Initial discrete event simulation was used as the starting point for the metric estimation | Discrete event simulation was built using algorithm cycle estimations and first order modeling for task iterations due to context switching, and so on. |
| Measurement on prototype C40 based array | Prototype code was ported to a C40 based DSP small scale array and measured. The measurement was then scaled based on the speedup of the C67 based DSP full scale array. |
| Add more hardware to the system | Number of DSP nodes was increased by adding more DSP boards. Good hardware design made scalability relatively easy. |
| Processor VHDL measurement | Big increase in throughput measurement was due to unexpected high cost of accessing data from external (off-chip) memory. Several benchmarks were performed and scaled to the entire application. |
| Algorithm optimization | Because of the nature of the algorithms, we were able to significantly cut CPU throughput utilization by restructuring the algorithms to pipeline the major loops of the algorithm stream. |
| Actual measurement on small scale target Hardware | In our hardware/software co-design effort, we did not have full scale hardware until late in the cycle. Initial benchmarking for this application was performed on a single node prototype DSP card. |
| Move software functionality into hardware ASIC | Decision was made for risk mitigation purposes to move part of the algorithm stream into a hardware ASIC in another sub-system, saving significant CPU cycles in the application software. |
| Software code and algorithm level optimization | Dedicated team in place to work code optimization and other algorithm transformation techniques to reduce CPU throughput. |
| Measurement on full-scale hardware | Measuring the application CPU throughput on the full scale hardware showed that we had underestimated the overhead for communication among all the array nodes. We developed a tailored comm API to perform intra-node communications more quickly. |

Once again the initial discrete event simulation proved to be inaccurate and the prototype system measurements were much higher than anticipated due to overly aggressive estimates of the CPU throughput, failure to account for realistic overhead constraints, etc. A long process of code and algorithm optimization was able to bring the estimate back down close to the goal before the VHDL simulation measurements uncovered some other areas that made us increase the estimate. The increase in the estimate in this application resulted in several risk management activities to be triggered.
The estimate in month 5 was high enough and was made early enough in the program schedule that the program was able to add more hardware resources to reduce the algorithm distribution and lower the throughput estimate. This was made at the expense of more power and cooling requirements as well as more money for the hardware (no new designs were required, just more boards). These increases in power and cooling had to be offset by sacrifices elsewhere to maintain overall system requirements on these parameters.
The measurement in month 19 was caused consternation among the managers as well as the technical staff. Although we felt continued optimization at the code level would drop the number significantly, meeting the application requirement of 75% CPU throughput (25% reserved for growth) would be hard to accomplish.
One contributor to the CPU throughput estimate increase was a result of an underestimation of a worst case system scenario which led to an increase in data rate for the processing stream,. This resulted in several algorithm loops being executed more frequently which increased the overall CPU utilization.
The decision was made to move some of the software functionality being done in the DSPs into a hardware ASIC to reduce the throughput significantly (there were a sufficient number of unused gates in the ASIC to handle the increased functionality). With this decision coming so late on the development cycle, however, significant re-design and re-work of the ASIC and the interfaces was required which was extremely expensive for the hardware effort as well as delays in the system integration and test phase.
The last increase in CPU utilization was a result of scaling the algorithms from the small (single node) DSP benchmark to the full array of DSPs. The increase was mainly due to a mis-estimation in the overhead associated with inter-processor communication. Once again, the development teams were faced with the difficult challenge of demonstrating real-time operation given these new parameters. At this late date in the development cycle, there are not many options left for the system designers. The main techniques used at this point to reduce the throughput estimate were additional code optimization, assembly language implementation of additional core algorithms, additional limited hardware support, and a significant restructuring of the algorithm control flow to circumvent the use of slow operating system functions. For example, we eliminated some of the robustness in the node to node communication API in order to save valuable CPU cycles.
It did not take long for management to realize that these “spikes” in the CPU throughput utilization would continue until all of the application had been measured on the target system under worst case system loads. Rather than periodically being surprised by a new number (we were optimizing the code in sections so every few months or so we would have actuals for a new part of the algorithm stream) we were asked to develop a plan of action and milestones (POA&M) chart which predicted when we would have new numbers and the plan for reducing the throughput after each new measurement that would support completion by the program milestone. In the plan we predicted the remaining spikes in the estimate and the plan for working these numbers down (Figure A.5). This new way of reporting showed management that we knew increases were coming and had a plan for completing the project.

Reducing the measurement error
The performance engineering plan detailed when hardware and software tools would become available which could be used to reduce the errors in the performance metrics. These availability dates when combined with the system development schedule provided decision points at which design trade-offs would be performed balancing algorithm, hardware, and software design points to yield a system that met cost and performance goals. Table A.3 lists the tools identified and the error factors reduced by them.
A.3
Tools identified in performance plan and errors resolved by them
| Tool | Error Factors Resolved |
| Code Generation Tools | Compiler efficiency |
| (Compiler, Assembler, Linker) | Quality of generated assembly code Size of load image |
| Instruction Level Processor | Utilization of dual processor pipelines |
| Simulator | Cycle counts for elemental operations |
| Cycle-accurate Device Level | Effect of external memory access times |
| VHDL Model | Instruction Caching effects |
| Device resource contention between processor and DMA channels | |
| Single DSP Test Card | Validate VHDL results |
| Runtime interrupt effects | |
| Multi-DSP Test Card | Inter-processor communication resource contention effects |
As these tools became available, benchmark code was executed using them and the performance metrics updated accordingly. This data was used to support program level decision points to review the proposed computer design. This review included hardware resources in the computer, algorithmic functionality assigned to the computer, and the proposed software architecture. At various decision points all of these areas were modified. The computer hardware resources were increased through the addition of more DSP processor nodes. The clock rate of the DSP was increased by 10%. Some algorithms were moved to other portions of the system. The software architecture was reworked to reduce overhead by eliminating extraneous interrupts and task switches. All aspects of the design were considered and adjusted as appropriate to meet the performance and cost objectives.
The performance plan also included the use of analytical tools to address the overall schedulability and large-scale performance of the array processor. We attempted to use rate monotonic analysis (RMA) to validate the schedulability of the software architecture [3,4,5]. RMA is a mathematical approach to determining schedulability under worst case task phasings and allows the designer to determine ahead of time whether the system will meet its timing requirements. RMA has the advantage over discrete event simulation in that the model is easier to develop and change and the model provides a conservative answer that guarantees schedulability (using a simulation, it becomes hard to predict how long to execute the model before a certain set of task phasings causes the system to break). One powerful feature of RMA tools is the ability to identify blocking conditions. Blocking and preemption are the most common reasons for missing deadlines and are one of the main focuses of most RMA tools. We were interested in using RMA because the model could identify potential timing problems even before the system is built. Alternative designs could be analyzed quickly before actually having to implement design. Our attempt at using RMA provided only a high level look at schedulability but not the details. The tools used did not scale well to large systems with thousands of task switch possibilities and nonpreemptible sections (one of the compiler optimization techniques produced software pipelined loops which, because of the nature of the processor pipeline turns off interrupts during the pipelined loop, thereby creating a small nonpreemptible section. Attempting to input and model thousands of these conditions proved to be too cumbersome for our application without becoming too abstract for our purposes).
As the array computer hardware was being developed concurrently with the software, the software team did not have target hardware available to them until late in the development life cycle. To enable the team to functionally verify their software prior to the availability of hardware an environment was developed using networked Sun workstations running Solaris. Using features of the Solaris operating system, the environment enabled small portions of the array computer to be created with inter-processor communication channels logically modeled. The application code was linked to a special library that implemented the DSP operating system’s API using Solaris features. This enabled the team to functionally verify the algorithms, including intertask and inter-processor communications, prior to execution on the target hardware.
The fundamental approach was to make the application work correctly and then attempt to add efficiency to the code, “Make it work right—then make it work fast!” We felt this was required for this application for the following reasons:
• Given the hardware/software co-design effort, the processor (and user documentation) was not available so the development team did not thoroughly understand the techniques required to optimize the algorithm stream.
• The algorithms themselves were complicated and hard to understand and this was seen as a risk by the development team. Making the algorithm stream run functionally correct was a big first step for a development team tackling a new area.
• Optimization of an algorithm stream should be performed based on the results of profiling the application. Only after the development team knows where the cycles are being spent can they effectively optimize the code. It does not make sense to optimize code that is executed infrequently. Removing a few cycles from a loop that executes thousands of times, however, can result in a bigger savings in the bottom line.
Conclusions and lessons learned
Estimating throughput may not be exact science but active attention to it during life cycle phases can mitigate performance risks and enable time to work alternatives while meeting overall program schedules and performance objectives. This needs to be a collaborative effort across multiple disciplines. System performance is the responsibility of all parties involved. There are no winners on a losing team.
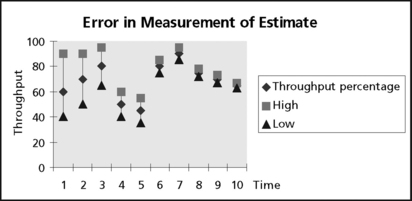
Processor CPU, memory, and I/O utilization are important metrics for a development effort. They give early indications as to problems and provide ample opportunity for the development teams to take mitigation actions early enough in the life cycle. These metrics also give management the information necessary to manage system risks and allocate reserve resources (that is, money and schedule) where needed. Often, one or more of these metrics will become an issue at some point during the development cycle. To obtain a system solution to the problem, sensitivity analysis is usually performed, examining various alternatives that trade off throughput, memory, I/O bandwidth, as well as cost, schedule, and risk. When performing this analysis, it is essential to understand the current accuracy in the metric estimates. Early in the life cycle the accuracy will be less than in later stages, where the measurements are much more aligned to the actual system due to the simple fact that more information is available (Figure A.6).
There were several lessons learned in this experience:
• Prototype early in the development life cycle – Several of the surprises we encountered could have been uncovered earlier if the proper level and type of prototyping was performed. Although prototyping was scheduled early in the life cycle, schedule pressures forced the development team to dedicate a limited amount of resources to this early in the development cycle.
• Benchmark – Don’t rely totally on the processor marketing information. Most processors will never achieve the throughput proposed in the literature. The numbers are often theoretical. In many cases, actual is much lower and very dependent on how the application maps to the processor architecture (DSPs run DSP-like algorithms very well but they are not very good at finite state machines and other “control” software). Marketing information for processors will show how well they perform on the best mapped algorithms there processors support.
• Analyze the functions executing most often – These areas are where the hidden cycles can come back to haunt a development team. Eliminating just a few cycles from a function that executes many times will have significant impact on the overall throughput.
• Don’t ignore the interfaces – Real-time systems carry an inherent “overhead” that never seems to be accounted for in throughput estimates. Although the signal processing algorithms may be where the main focus is from a system requirements and functionality point of view, real-time systems also need throughput for interrupt handling, data packing and unpacking, data extraction, error handling, and other management functions that are easily overlooked in throughput estimates. Many battles were fought over how much of the timeline should be devoted to overhead tasks.
• Benchmarks of discrete algorithms don’t scale well to real-time systems – Benchmarking an individual algorithm inherently implies that algorithm has complete control and use of all the processor resources including internal and external memory, the DMA controller, and other system resources. In reality, there may be other tasks competing for these same resources. Assumptions made when benchmarking individual algorithms may not apply when the system is put together and running under full system loads. Resource conflicts result in additional overhead that can easily be overlooked when forming throughput estimates.
• Keep management informed –As we approach the completion of the code level optimization effort, it appears the model we established early in the project was a relatively accurate estimate. However, it took a substantial amount of resources (schedule and budget) to accomplish this goal. Along the way, the estimate periodically rose and fell as we optimized and measured our algorithm stream. The reporting period for these metrics was short enough to catch these spikes which caused premature concern from management. A longer reporting interval may have “smoothed” some of these spikes.
• Budget accordingly – The two pass approach of functional correctness followed by code optimization will take more time and more resources to accomplish. This needs to be planned. A one pass approach to code level optimization at the same time the functionality is being developed should be attempted only by staffs experienced in the processor architecture and the algorithms.
References
1. Smith, Connie, U., Performance Engineering for Software Architectures. 21st Annual Computer Software and Applications Conference. 1997:166–167.
2. Baker, Michelle, Smith, Warren. Performance Prototyping: A Simulation Methodology for Software Performance Engineering. Proceeding of the Computer Systems and Software Engineering. 1992:624–629.
3. Oshana, Robert, “Rate Monotonic Analysis Keeps Real-Time Systems On Track,”. EDN. 1 September 1997.
4. Liu, C., Layland, J., “Scheduling algorithms for multiprogramming in a hard real time environment,”. Journal of the Association for Computing Machinery. January 1973.
5. Obenza, Ray, “Rate Monotonic Analysis for Real-Time Systems,”. March 1993.