7
Managing Data Structure in R
Mittal Desai1* and Chetan Dudhagara2
1Smt. Chandaben Mohanbhai Patel Institute of Computer Applications, Charotar University of Science and Technology, Changa, Anand, Gujarat, India
2Dept. of Communication & Information Technology, International Agribusiness Management Institute, Anand Agricultural University, Anand, Gujarat, India
Abstract
The data structure allowed us to organize and store the data in a way that we needed in our applications. It helps us to reduce the storage space in a memory and fast access of data for various tasks or operations. R provides an interactive environment for data analysis and statistical computing. It supports several basic various data types that are frequently used in different calculation and analysis-related work. It supports six basic data types, such as numeric (real or decimal), integer, character, logical, complex, and raw. These basic data types are used for its analytics-related works on data. There are few more efficient data structures available in R, such as Vector, Factor, Matrix, Array, List, and Dataframe.
Keywords: Data structure, vector, factor, array, list, data frame
7.1 Introduction to Data Structure
R is an open-source programming language and software environment that is widely used as a statistical software and data analysis tool. R provides a wide variety of statistical and graphical techniques, including linear and nonlinear modeling, statistical tests, time-series analysis, classification, clustering, etc. [3].
The data structure is a way of organizing and storing the data in a memory device so that it can be used efficiently to perform various tasks on it.
R supports several basic data types that are frequently used in different calculation. It has six primitive data types, such as numeric (real or decimal), integer, character, logical, complex, and raw [4].
The data structure is often organized by their dimensionality, such as one-dimensional (1D), two-dimensional (2D), or multiple-dimensional (nD). There are two types of data structure: homogeneous and heterogeneous. The homogeneous data structure allows to store the identical type of data. The heterogeneous data structure that allows to store the elements are often various types also. The most common data structure in R are vector, factor, matrix, array, list and dataframe as shown in Figure 7.1.
Vector is the basic data structure in R. It is a one-dimensional and homogeneous data structures. There are six types of atomic vectors such as integer, character, logical, double or raw. It is a collection of elements, which is most commonly of mode character, inter, logical, or numeric [1, 2].
Factor is a data object, which is used to categorize the data and store it as a level. It can store both integers and strings. It has two attributes, such as class and level, where class has a value of factor, and level is a set of allowed values (refer to Figure 7.1).

Figure 7.1 Data structure in R.
Table 7.1 Classified view of data structures in R.
| Data types | Same data type | Multiple data type |
|---|---|---|
| Number of dimensions | ||
| One | Vector | List |
| One (Categorical data) | Factor | |
| Two | Matrix | Data Frame |
| Many | Array |
Matrix is a two-dimensional and homogeneous data structures. All the values in a matrix have a same data type. It is a rectangular arrangement of rows and columns.
Array is a three-dimensional or more to store the data. It is a homogeneous data structure. It is a collection of a similar data types with continues memory allocation.
List is the collection of data structure. It is a heterogeneous data structure. It is very similar to vectors except they can store data of different types of mixture of data types. It is a special type of vector in which each element can be a different data type. It is a much more complicated structure.
Data frame is a two-dimensional and heterogeneous data structures. It is used to store the data object in tabular format in rows and columns.
These data structures are further classified into the following way on the basis of on the types of data and number of dimensions as shown in Table 7.1.
Data structures are classified based on the types of data that they can hold like homogeneous and heterogeneous. Now let us discuss all the data structures in detail with its characteristics and examples.
7.2 Homogeneous Data Structures
The data structures, which can hold the similar type of data, can be referred as homogeneous data structures.
7.2.1 Vector
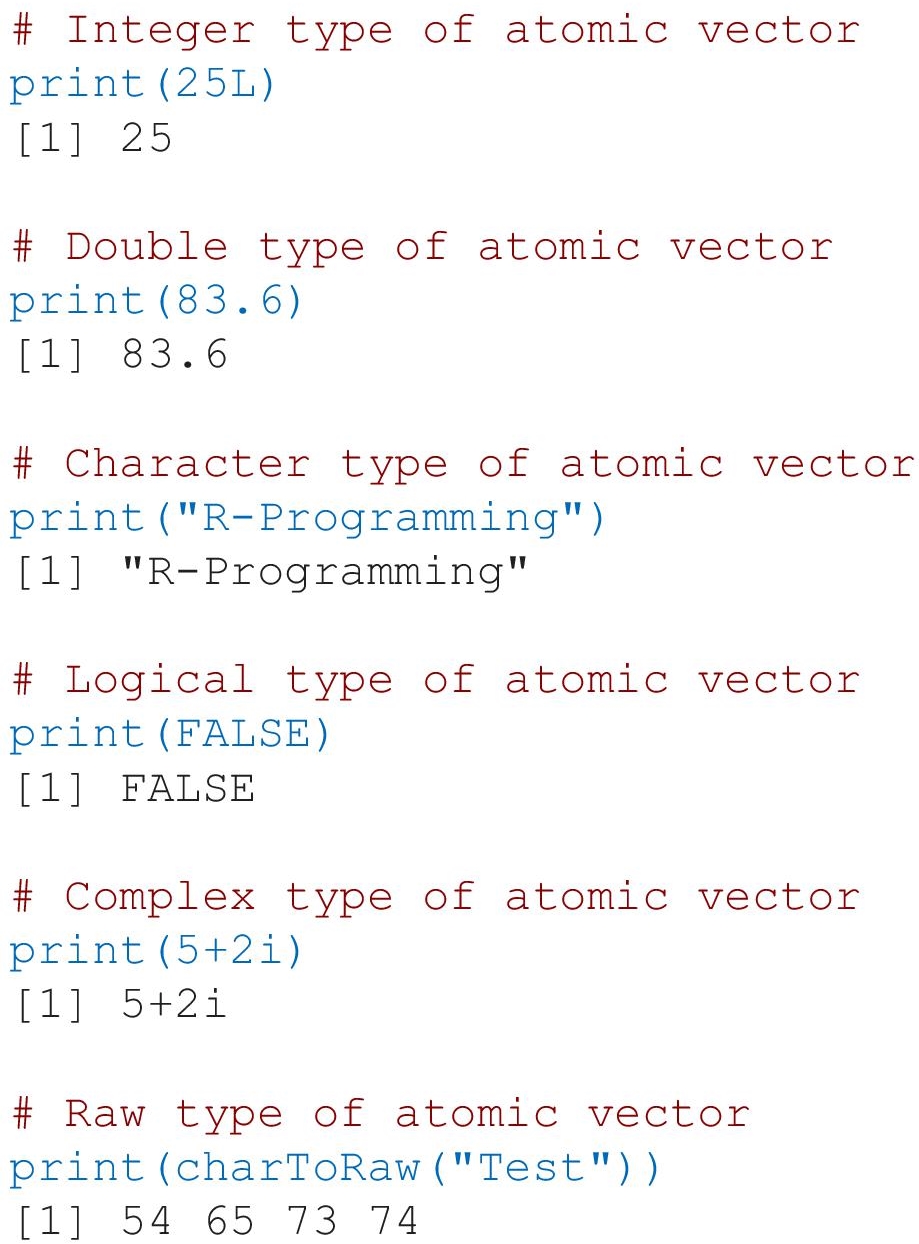
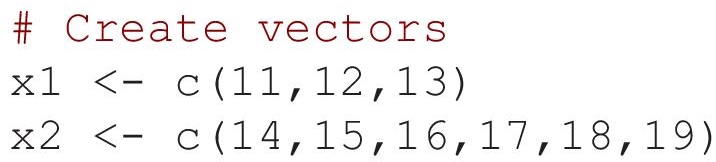
Vector is a basic data structure in R. The vector may contain single element or multiple elements. The single element vector with six different types of atomic vectors, such as integer, double, character, logical, complex, and raw are as below:
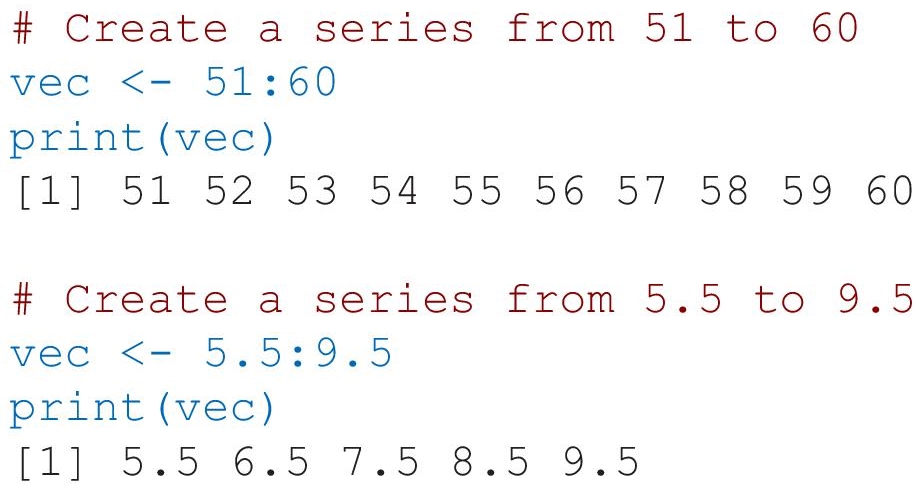
- Using Colon (:) Operator
The following examples will create vectors using colon operator as follows:
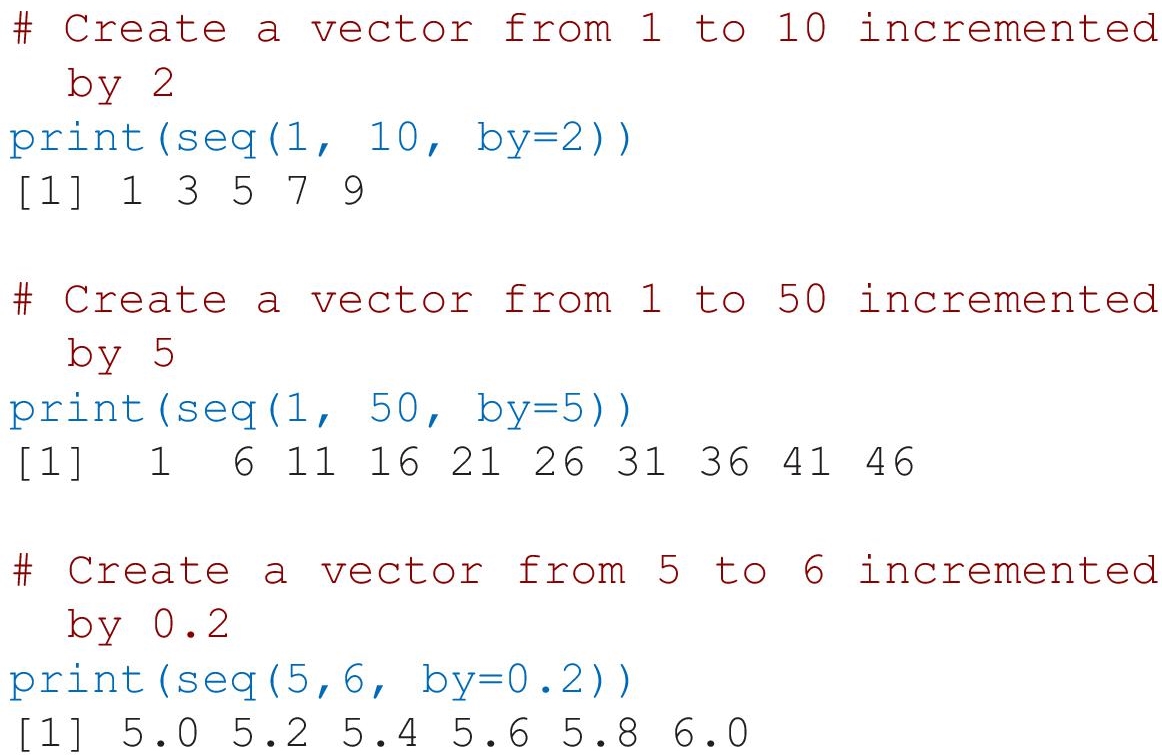
- Using Sequence (seq) Operator
The following examples will create vectors using sequence operator as follows:
- Using c() Function
The vector can be created using c() function for more than one element in a single vector. It combines the different elements into a vector. The following code will create a simple vector named as color with Red, Green, Blue, Pink and Yellow as an element.

The class() function is used to find the class of elements of vector. The following code will display the class of vector color.

The non-character values in a vector are converted into character type as follows.

- Accessing Vector Elements
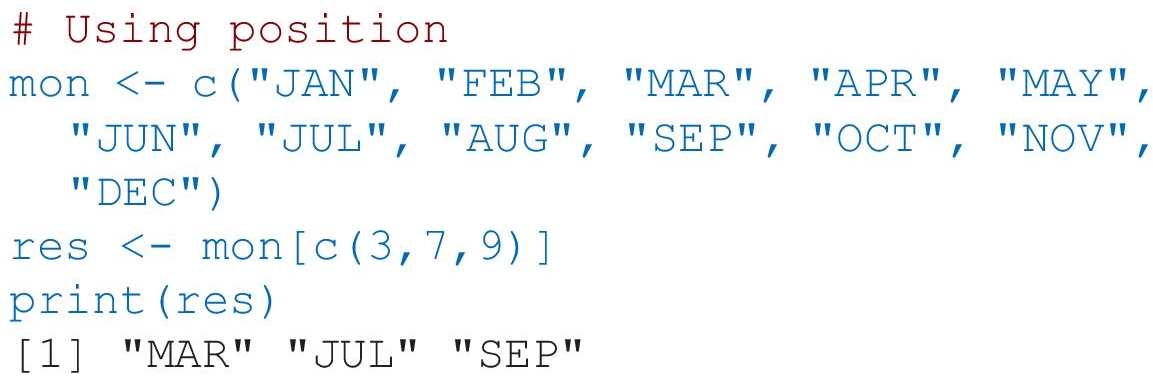
The elements of vector can be access using index. The [ ] bracket is used for indexing. The index value is start from 1. The below code will display the third, seventh and ninth elements of a vector month.
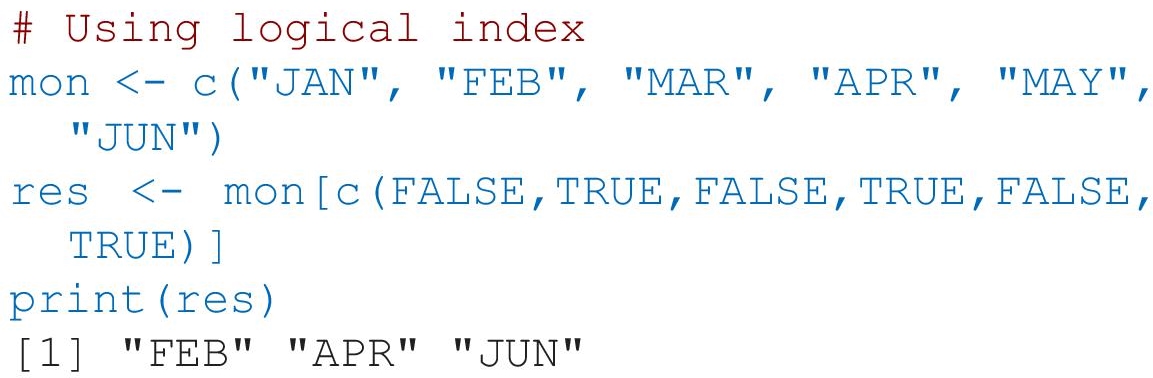
The vector elements can be access using logical indexing also. The below code will display the first, fourth and sixth elements of a vector month.
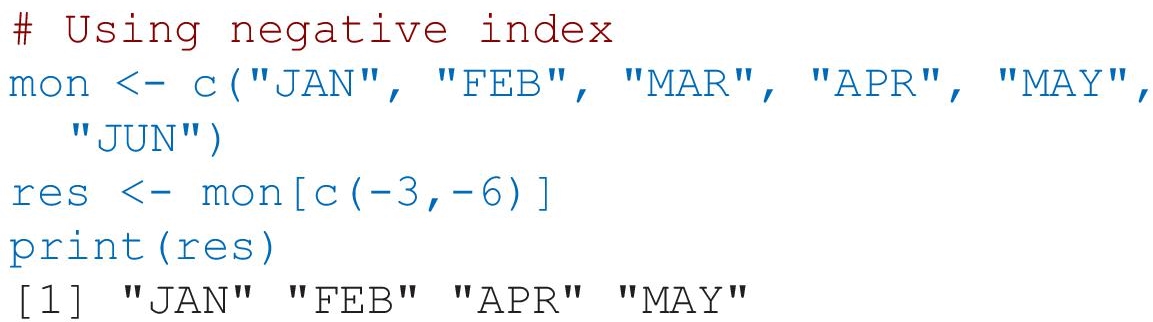
The vector elements can be access using negative indexing also. The negative index value is skipped. The below code will skip third and sixth elements of a vector month.
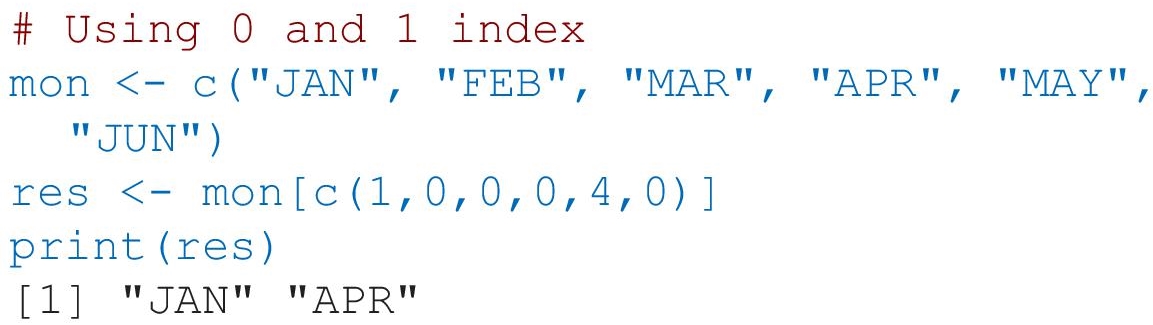
The vector elements can be access using 0/1 indexing also. The below code will display first and fourth elements of a vector month.
- Nesting of Vectors
The multiple vectors can be combined together to create a vector is called nesting of vectors. We can combine two or more vectors to create a new vector or we can use a vector with other values to create a vector.

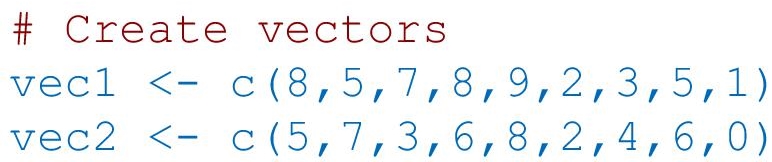
- Vector Arithmetic
The various arithmetic operations can be performed on two or more same length of vectors. The operation can be addition, subtraction, multiplication or division as follows:
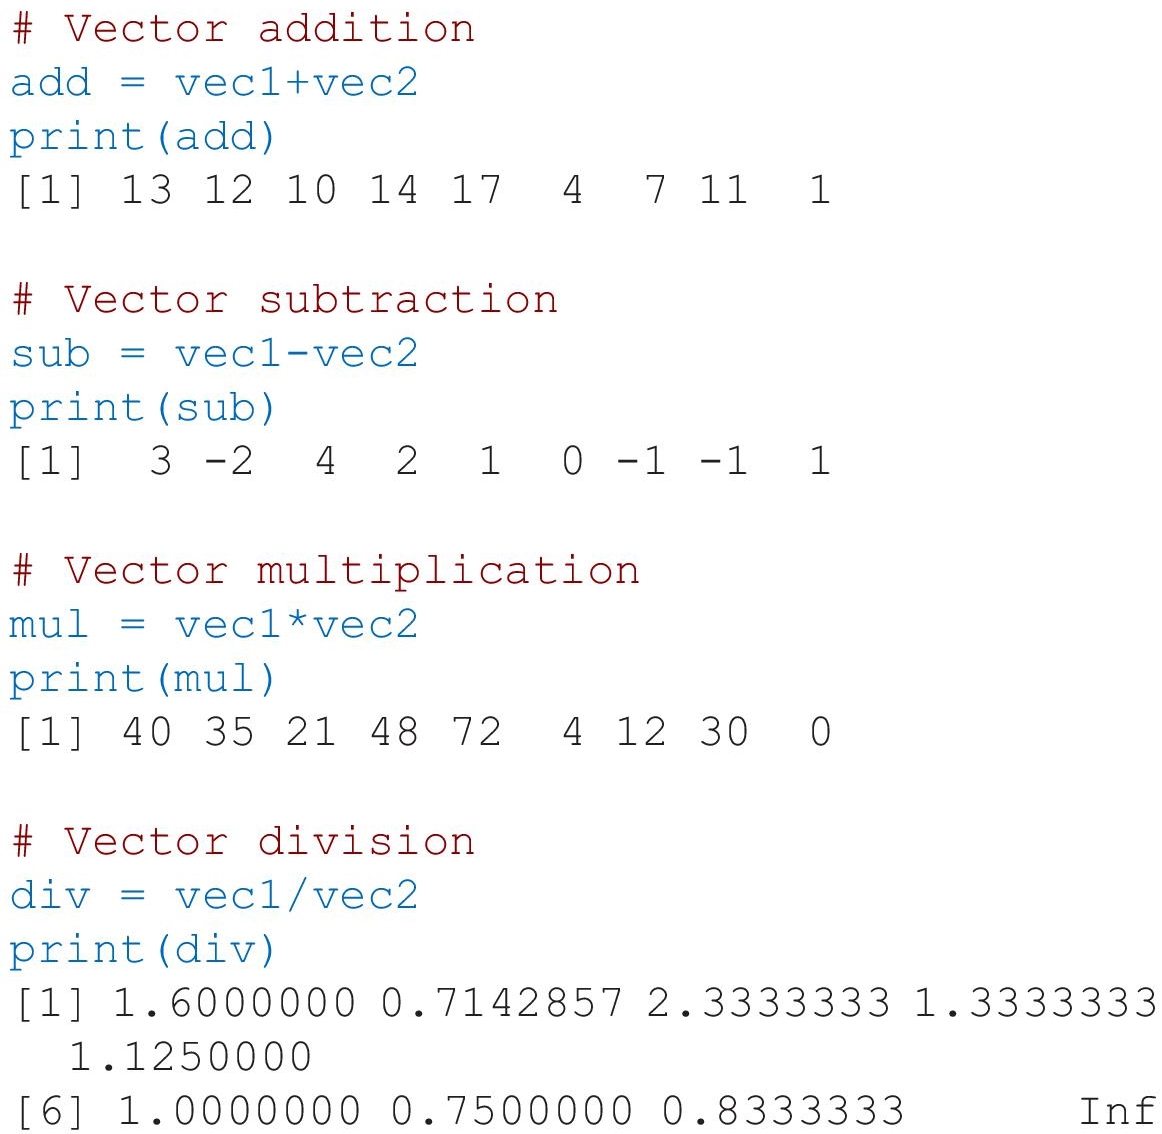
- Vector Element Recycling
The various operations can be performed on vectors of different length also. The elements of a shorter vectors are recycled to complete the operations as follows:
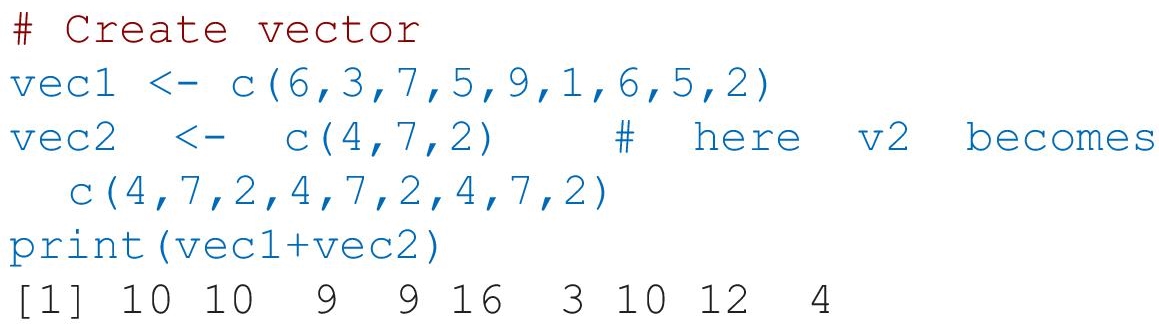
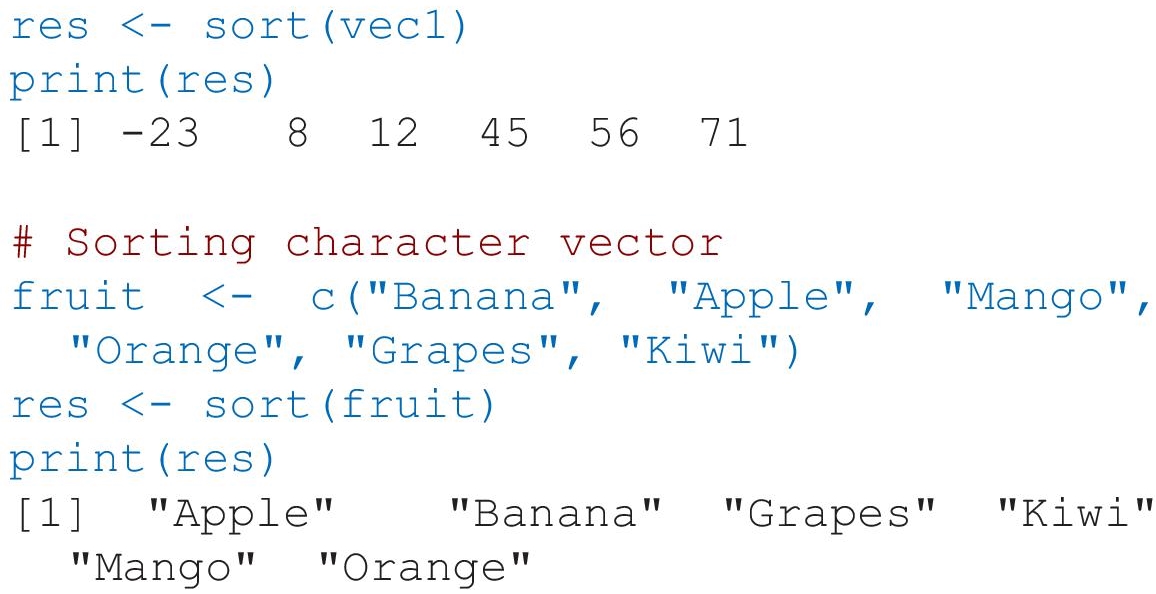
- Sorting of Vector
The elements of a vector can be sorting (ascending / descending) using sort() function.
The below code will display elements of a vector in ascending order as follows:
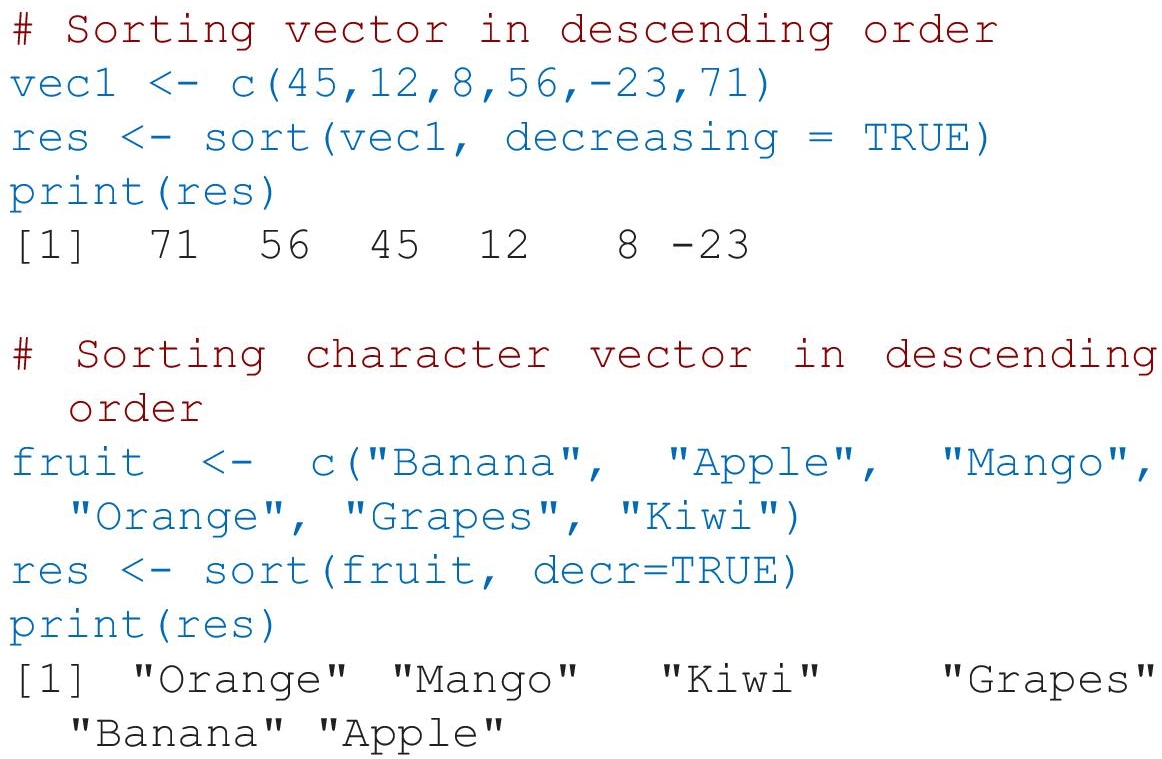
The below code will display elements of a vector in descending order as follows:
7.2.2 Factor
The factor is used to categorized the data and store it as levels. It has a limited number of unique values. It is useful in data analysis for statistical modelling. The factor() function is used to create factors.
The following example will create a vector bg and apply factor function to convert the vector into a factor. It will display as follows:

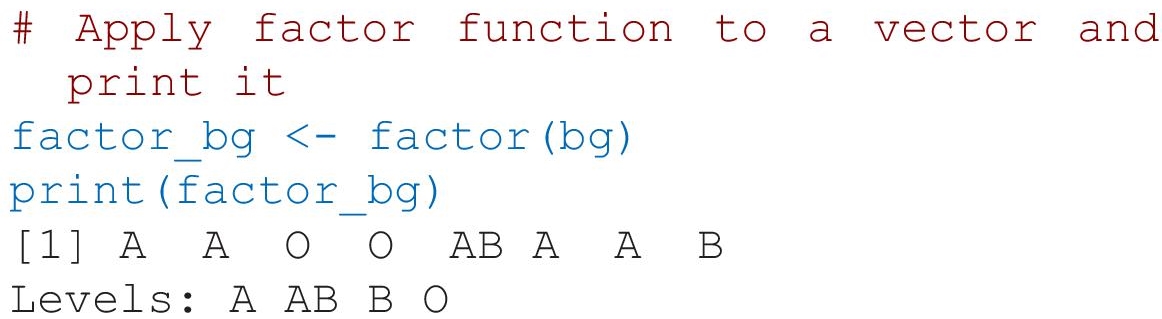
The above code creates into four levels. The structure of factor is display using str() function as follows
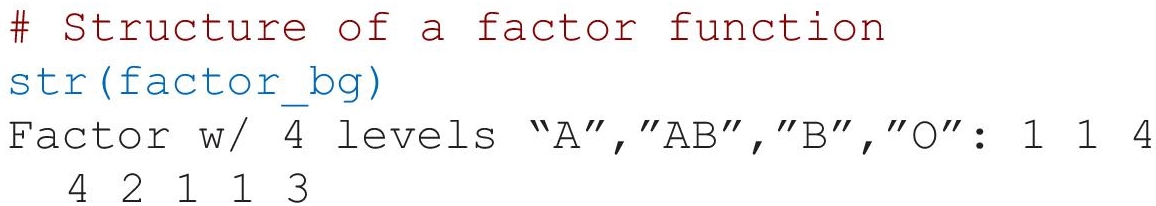
It is a level of factor, which is an alphabetical order and it can observe that for each level of an integer is assigned into the factor, which can save the memory space.
7.2.3 Matrix
Matrix is a data structure in which the elements are arranged in a two-dimensional format. All the elements in a metrices of the same atomic types. The numeric elements of matrices are to be used for mathematical calculation. The matrix can be created using matrix() function as follows

Here,
- data – An input vector
- nrow – No. of rows
- ncol – No. of columns
- byrow – TRUE or FALSE
- dimname – Name of rows and columns
- Create Matrix
The following example will create a numeric matrix.
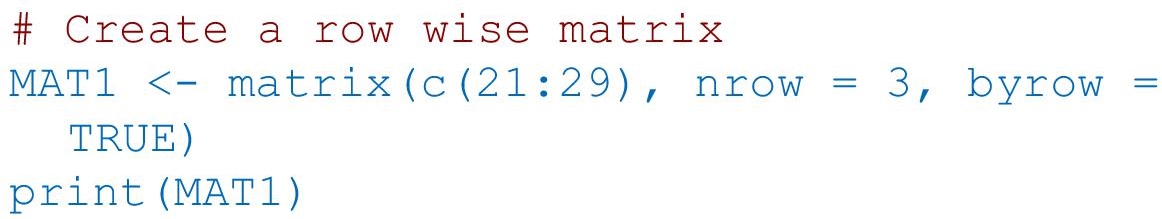

In above example, it is set to create three rows and display the matrix row wise.
The following example will create a numeric matrix.
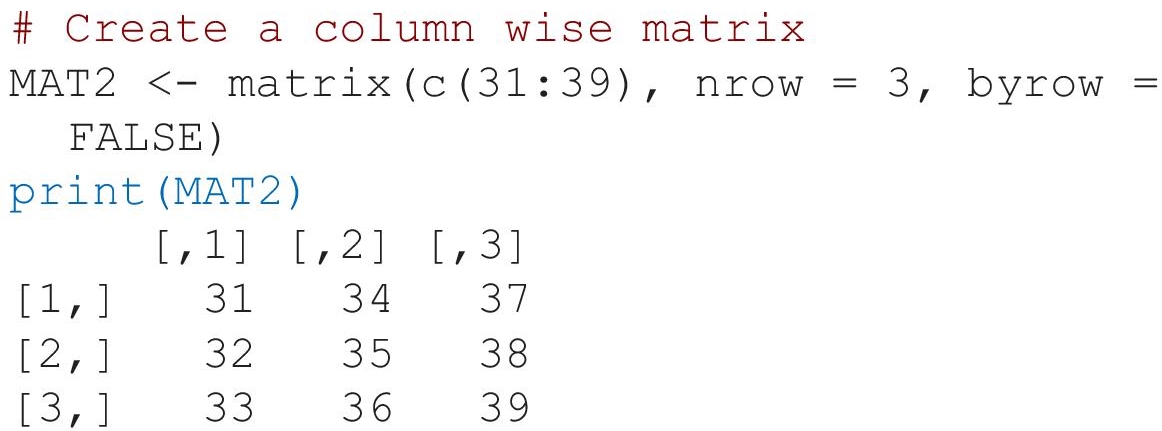
In above example, it is set to create three rows and display the matrix column wise.
- Assigning Rows and Columns Names
The following example will assign the names of rows and columns and creates a numeric matrix.
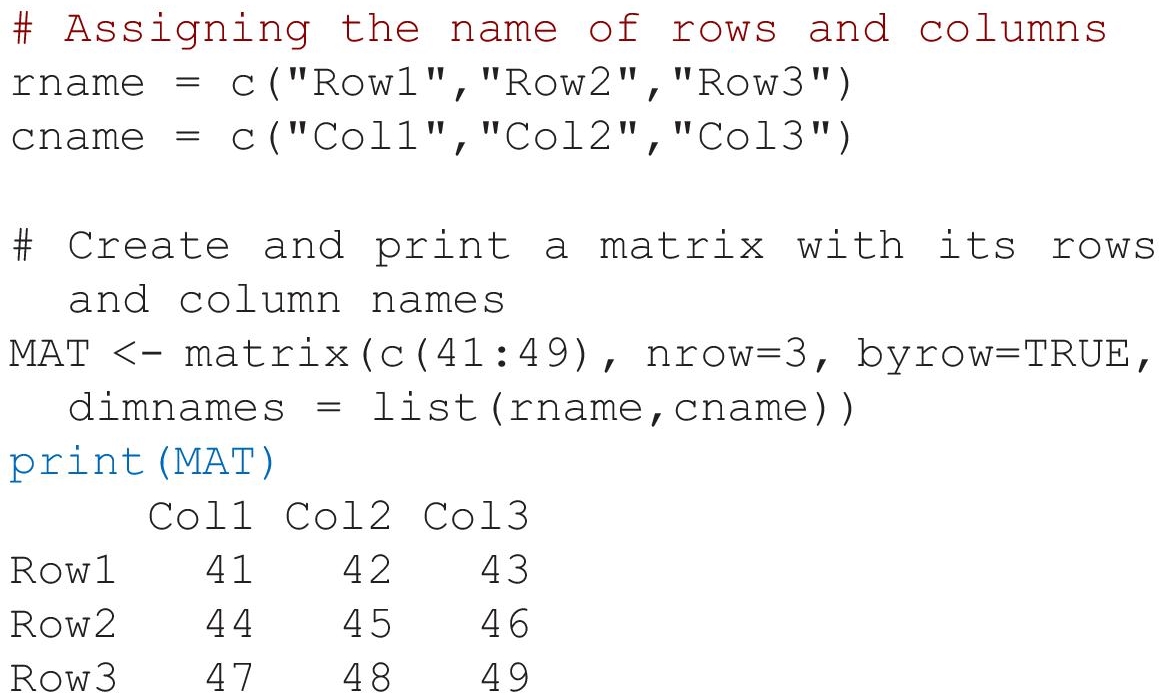
In above example, it is assigned row names such as Row1, Row2, and Row3 and columns names such as Col1, Col2, and Col3. It is also set to create three rows and display all the elements in a row wise in a matrix.
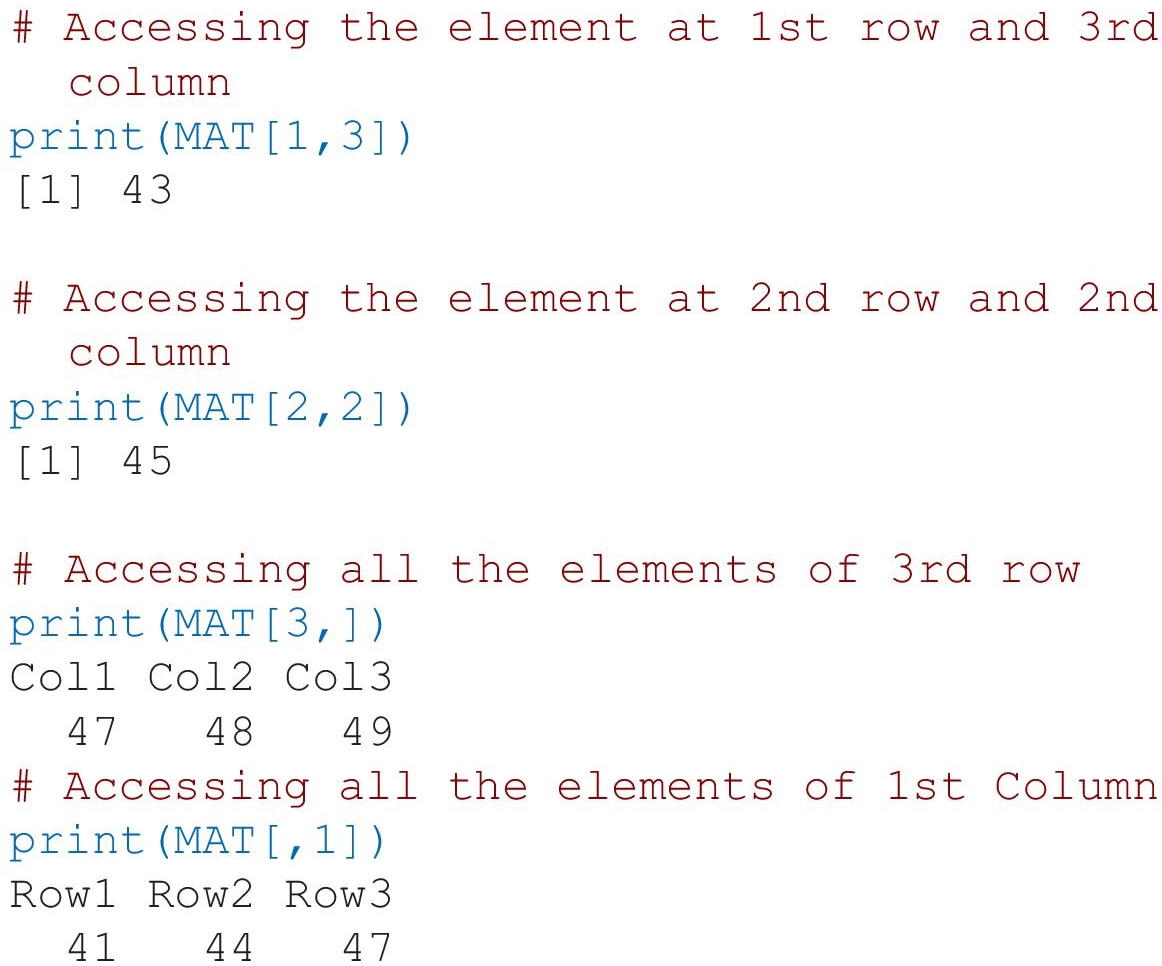
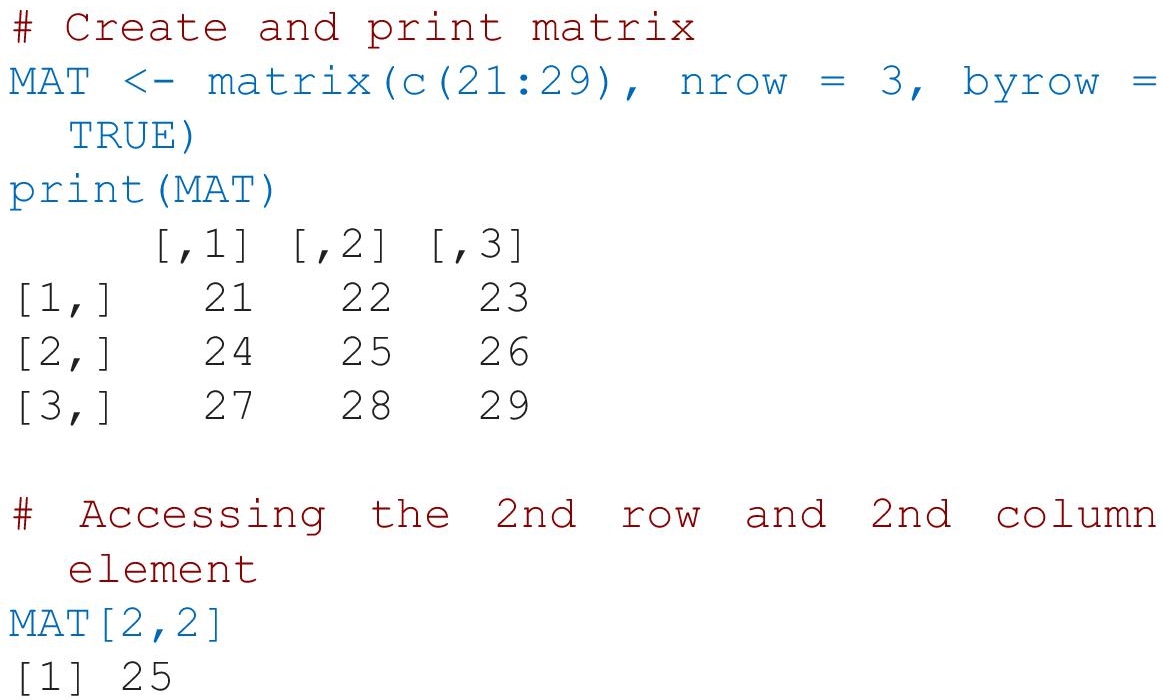
- Assessing Matrix Elements
The matrix elements can be accessed by combination of row and column index. The following example will access the matrix elements as follows:
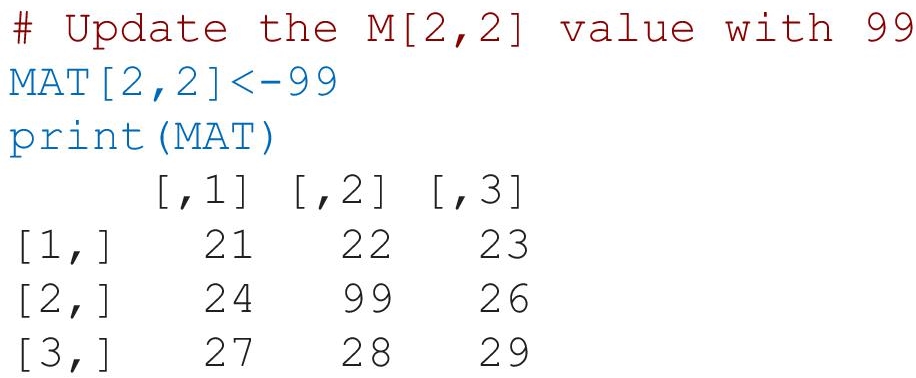
- Updating Matrix Elements
We can assign a new value to the element of a matrix using its location of the elements. The following example will update the value of matrix element as follows:
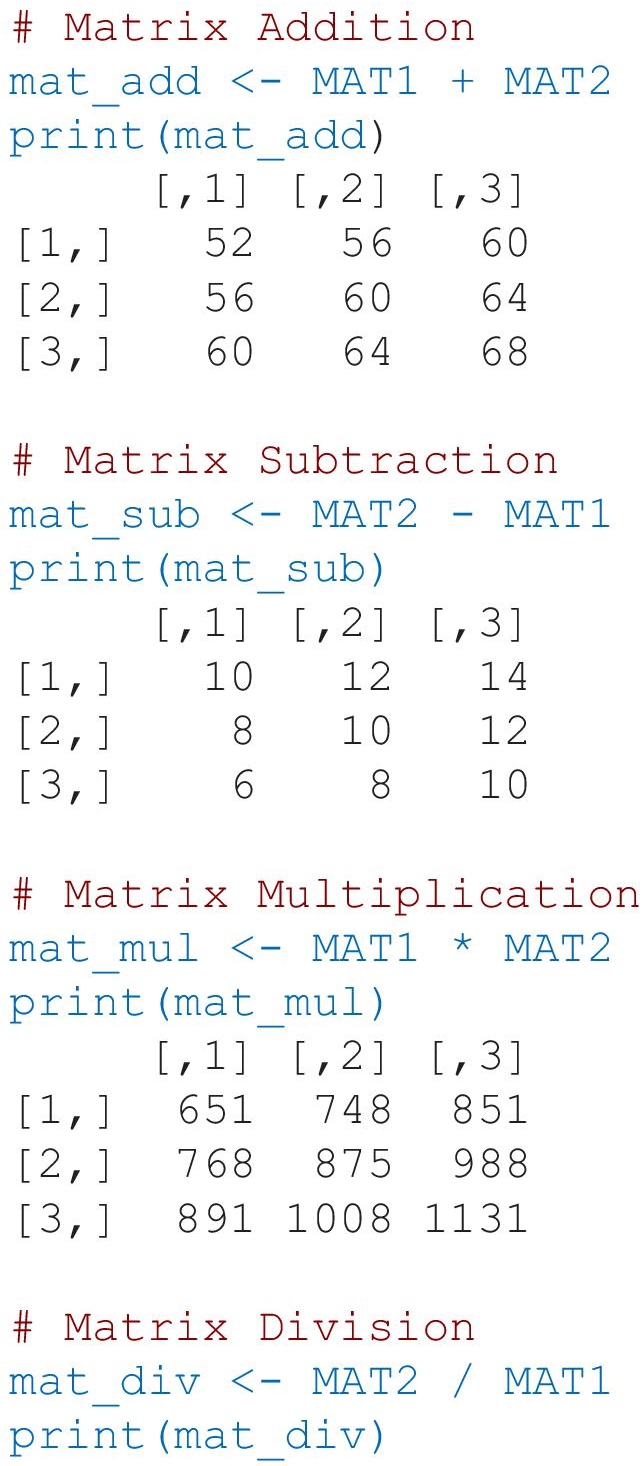
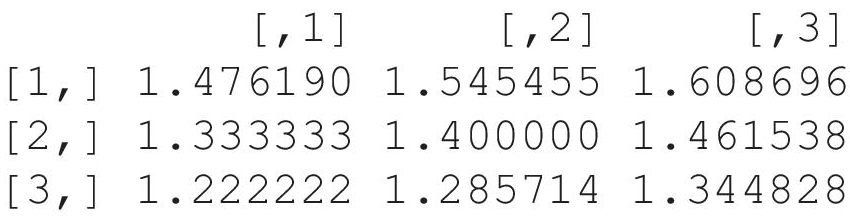
- Matrix Computation
The various arithmetic operation can be performed on a matrix. The result of the operations is also stored in a matrix. The following examples will perform the various operation such as matrix addition, subtraction, multiplication and division.
- Transpose of Matrix
Transposition is a process to swapped the rows and columns with each other’s in a matrix. The t() function is used to find the transpose of a given matrix. The following example will find the transpose matrix of an input matrix as follows:

7.2.4 Array
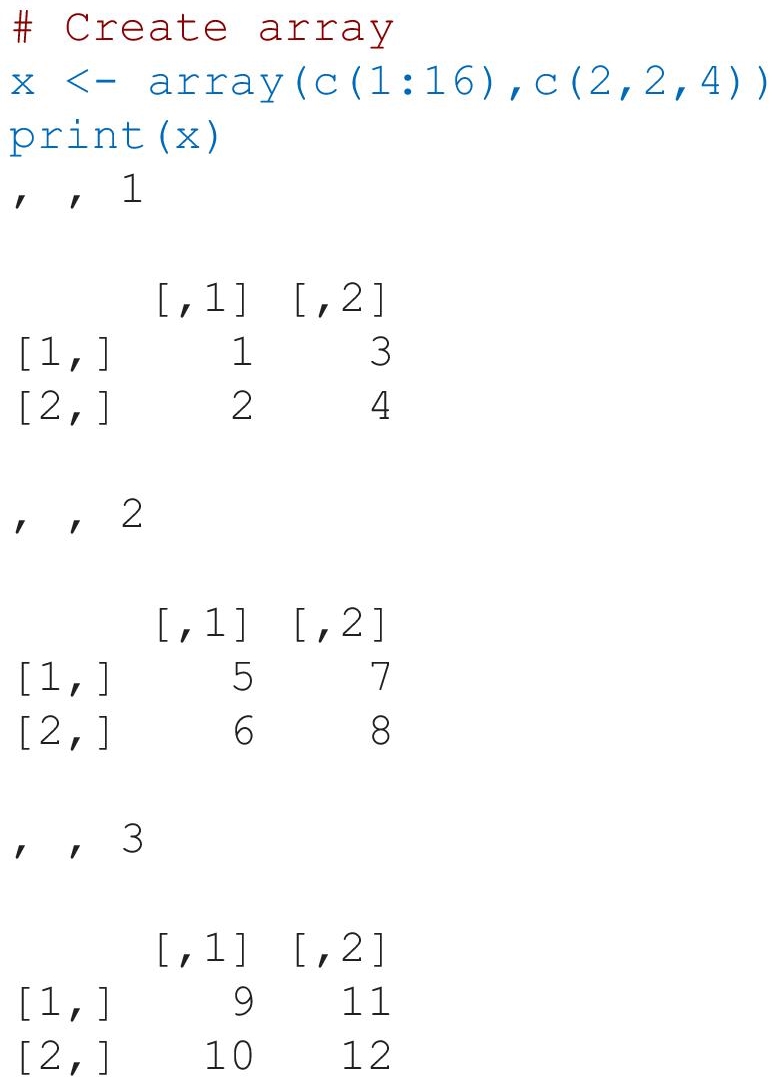
Array can be store the data in two or more dimensions also. The array can be created using array() function. The vector is used as an input and dim parameter is used to create an array.
The following example will create an array of two 3X3 matrices with three rows and three columns as follows:

The following example will create an array of four 2 × 2 matrices with two rows and two columns as follows:
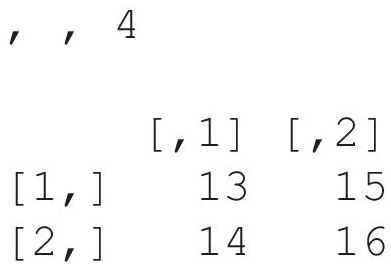
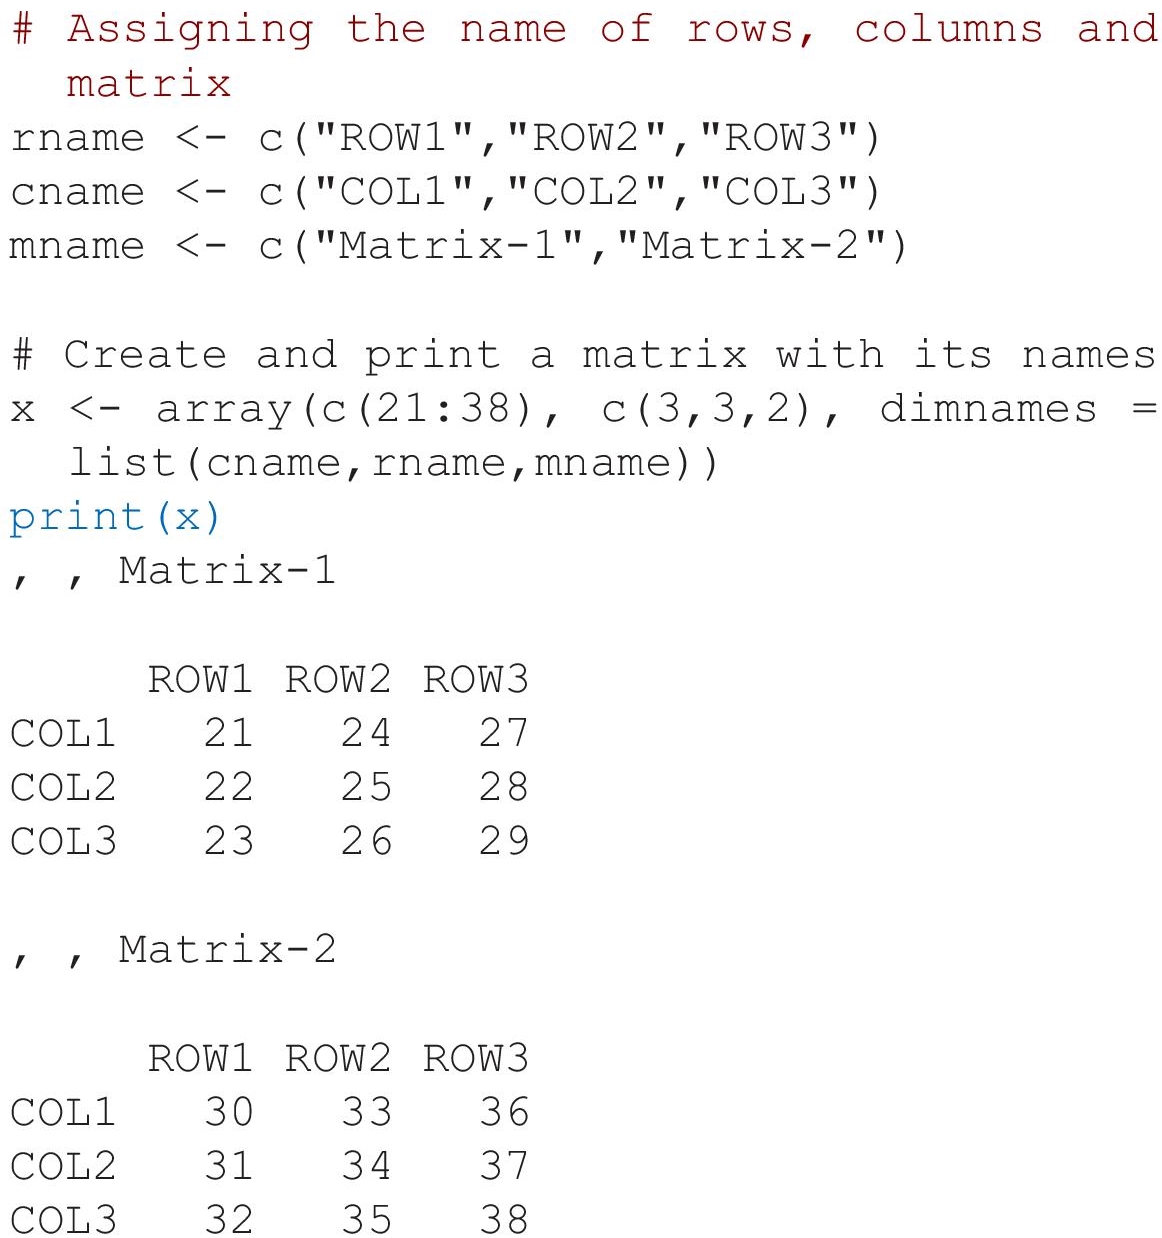
The name of rows, columns, and matrix is also to be assigned as follows:
7.3 Heterogeneous Data Structures
The data structure, which is capable of storing different types of data, is referred as heterogeneous data structures. As mentioned in Table 7.1, R is supporting list and data frame for holding different types of data in one dimensional or multidimensional format.
7.3.1 List
It is a data structure that consists various types of elements in a list, such as numeric, string, vector, list, etc.
- Create List
The list can be created using list() function. The following example will create a list lst using various types of elements inside it.
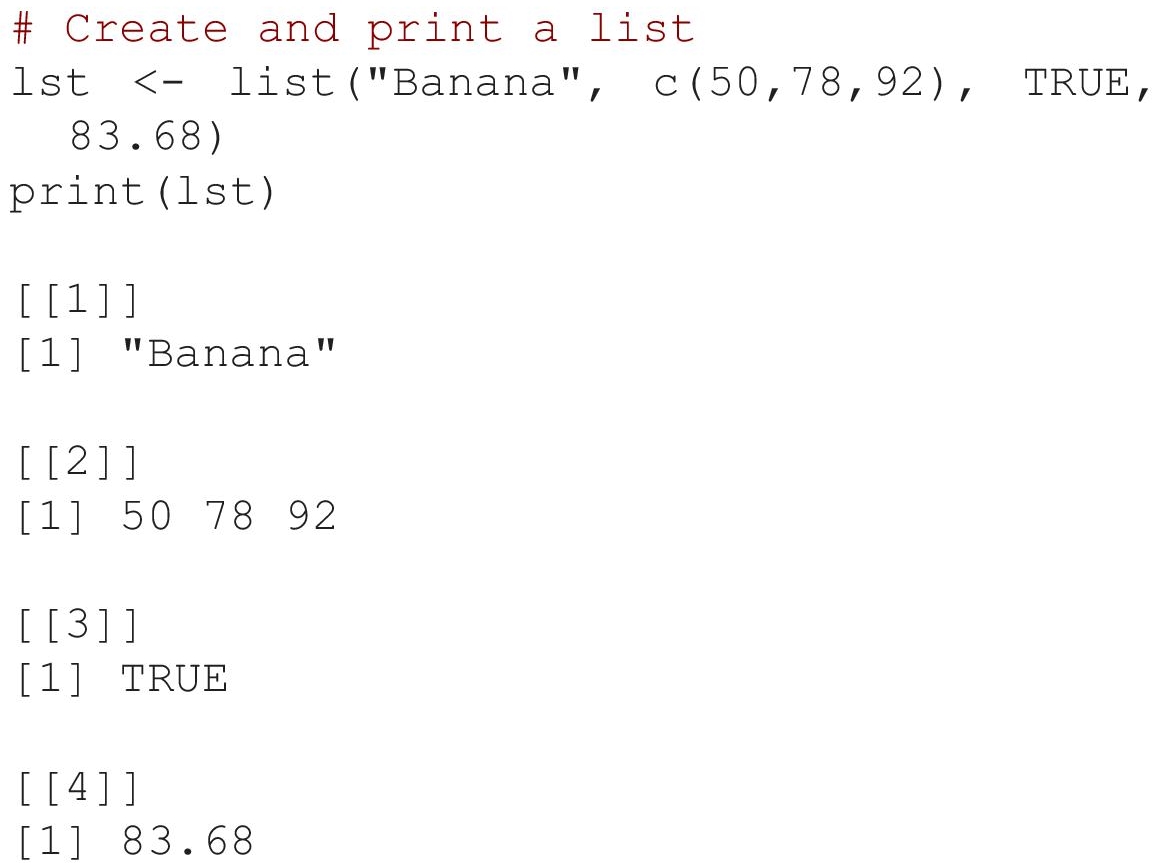
The above list contains the four different types of elements such as character, vector, logical and numeric.
- Naming List Elements
We can assign a name of each elements in a list. The name will be used to access each elements of a list separately. The following example will create a list lst using matrix, vector, and list inside it.
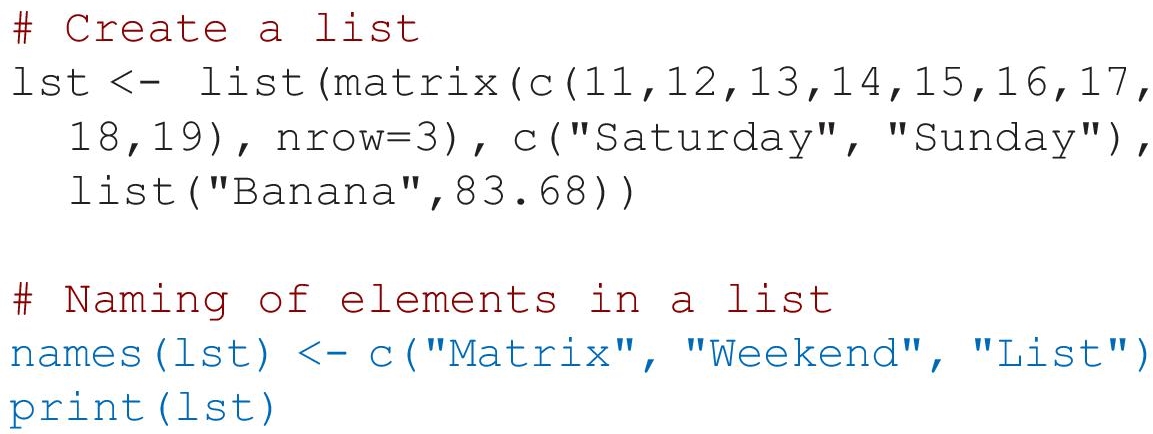
The above example assigns a name Matrix, Weekend, and List to the elements of list.
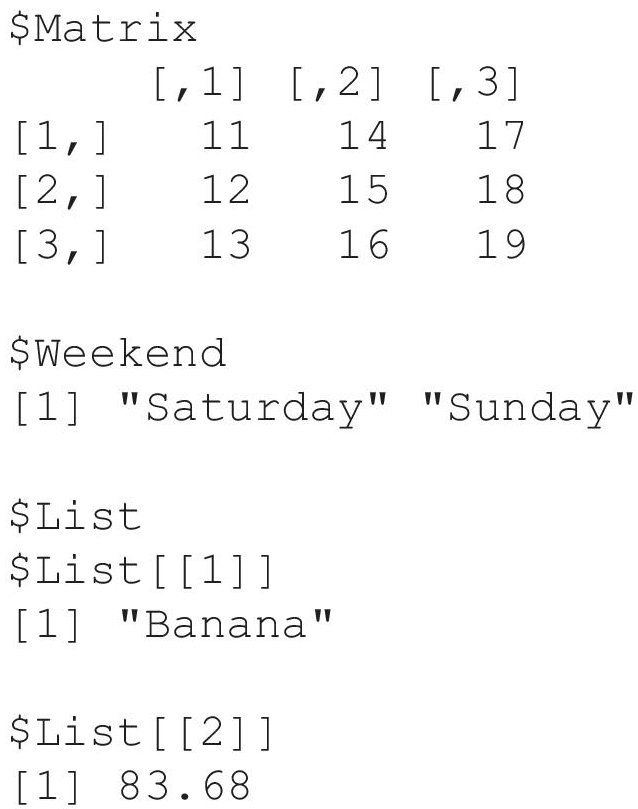
- Accessing List Elements
The following examples will be accessing the elements of list using indexing.

The following examples will be accessing the elements of list using its names.
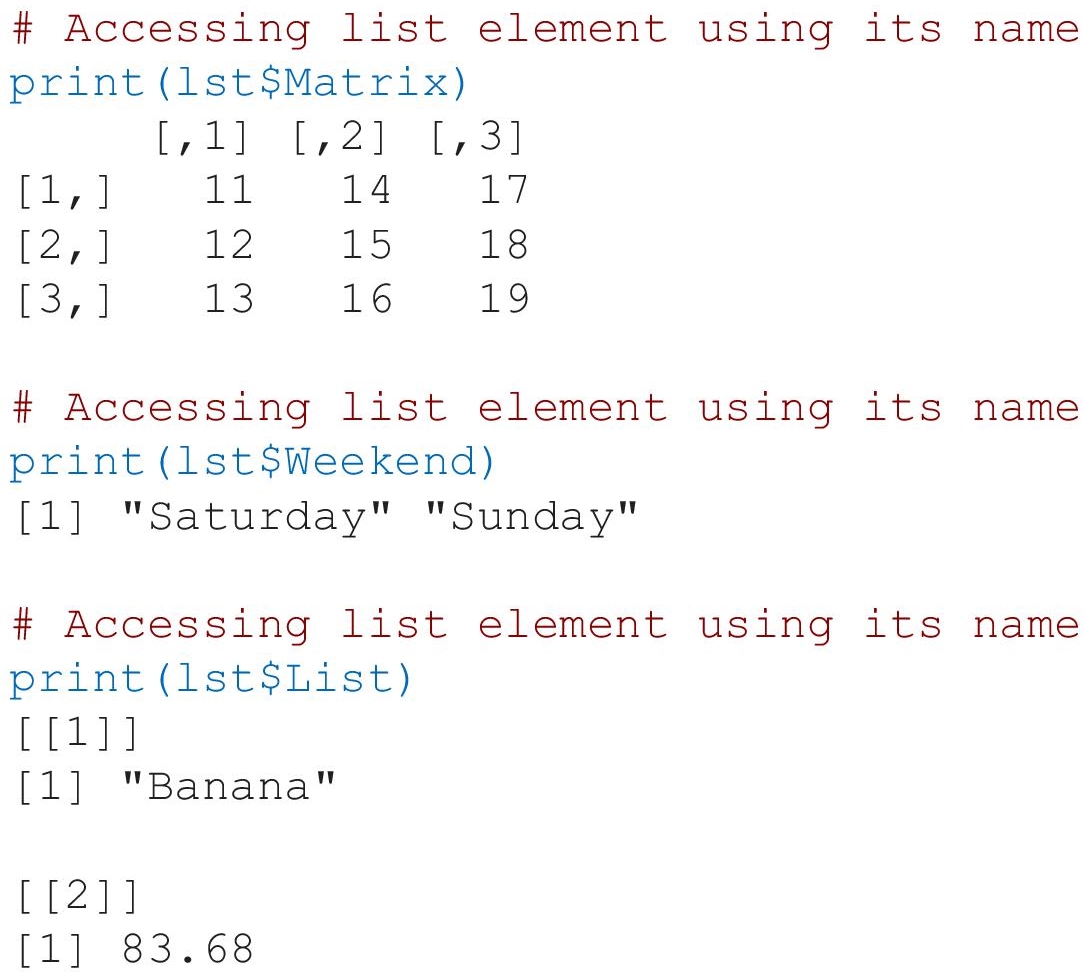
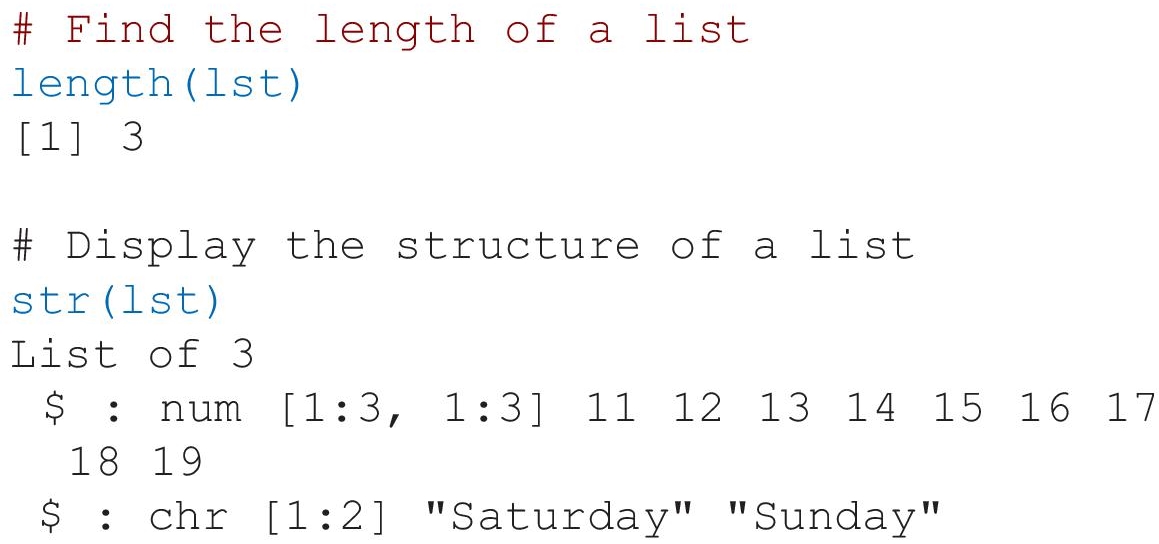
The length() function is used to find the length of a list, the str() function is used to display the structure of a list and the summary() function is used to display the summary of a list.
The following examples will find the length of a list, display the structure and summary of a list.

- Manipulating Elements of List
The elements in a list will be manipulated using addition of new elements in a list, deleting elements from the list and update the elements in a list. The following example will show the add, delete, and update operation in a list.

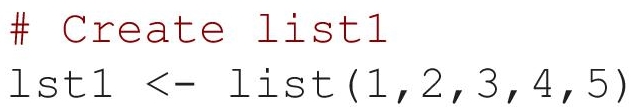
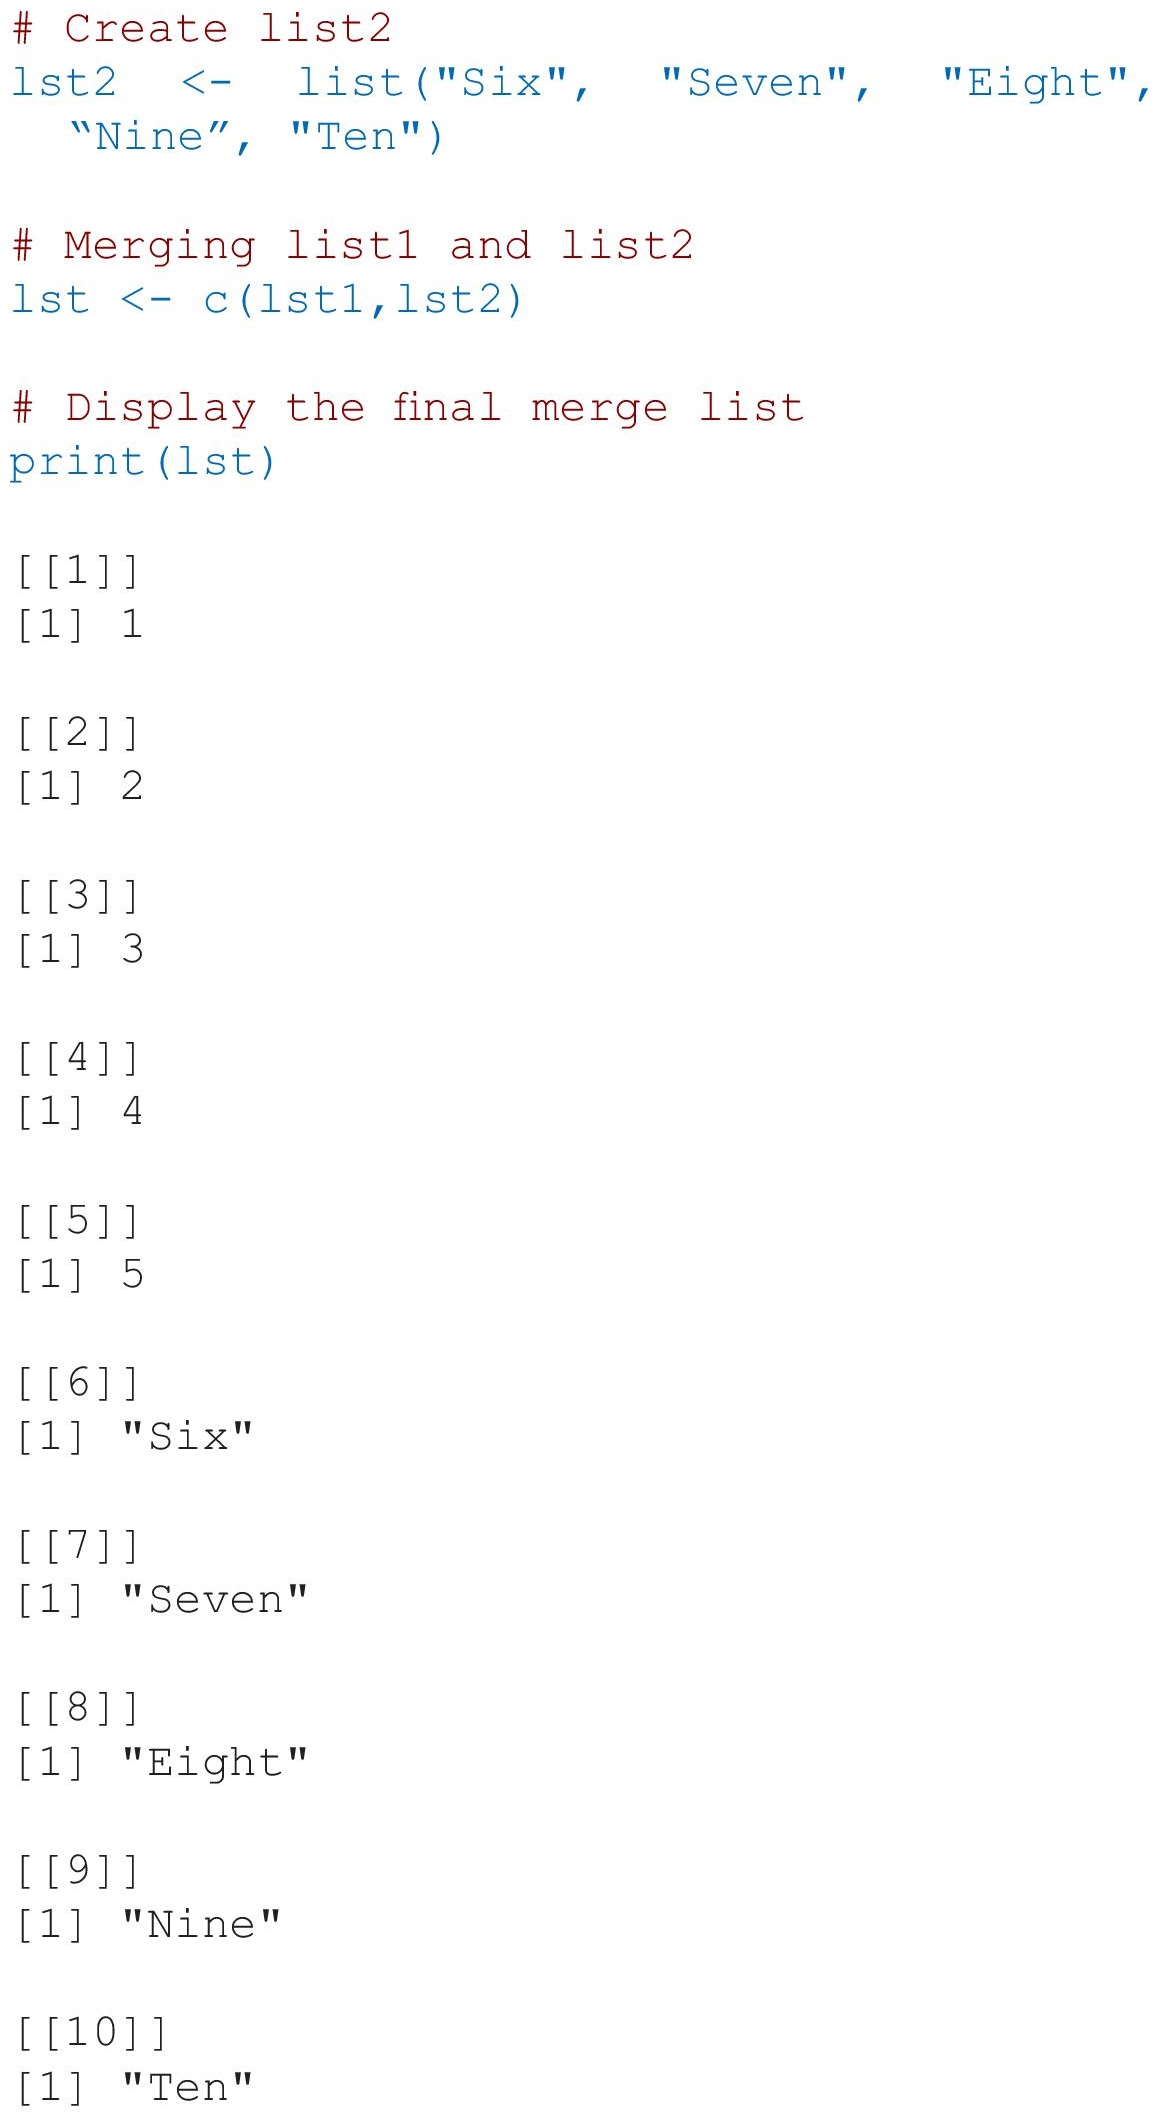
- Merging List Elements
The two or more list can be merge into a single list with its all elements. The following example will create two lists, such as lst1 and lst2. The both lists will merge into a single list as follows:
7.3.2 Dataframe
The dataframe is a table-like structure. It is a fundamental data structure to store these types of dataset in which data is organized in number of observations and number of variables. In data frame multiple types of data is stored in multiple labeled columns and it is a prime difference between matrix and data frame. Elements of same column should of same type is an observable restriction in data frame.
The dataframe can be imported from the various sources, like CSV file, excel file, SPSS, relational database etc. The dataframe can be created manually also.
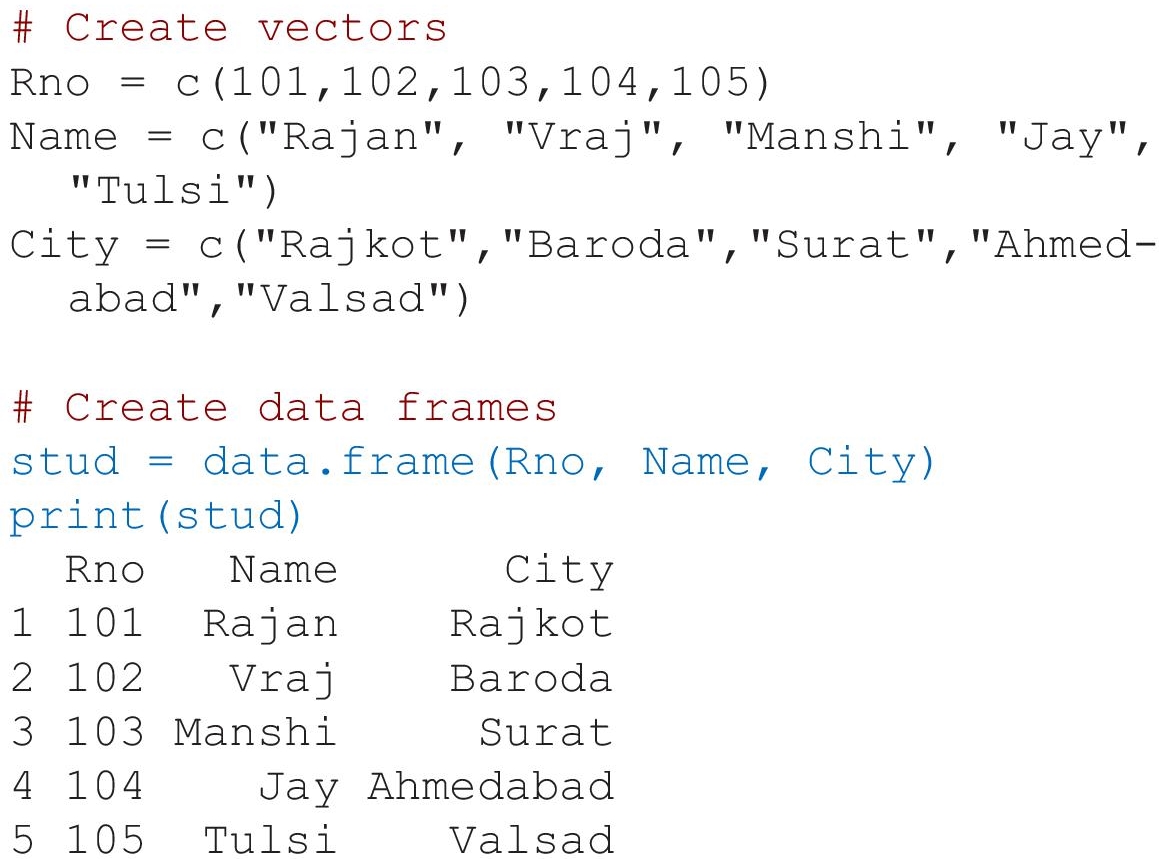
- Create Dataframe
The data.frame() function is used to create a dataframe manually.
The following example will create a stud dataframe with column names Rno, Name and City.
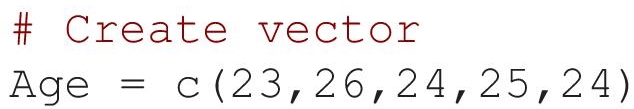
- Addition of Column
We can add a new column in the existing data frame. The following example will add a new column Age in the stud data frame as follows:
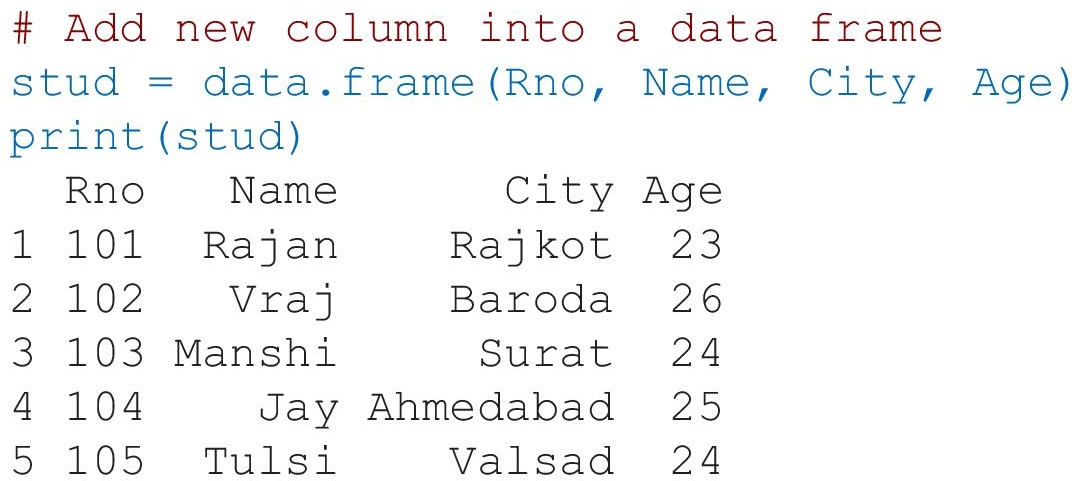
- Accessing Dataframe
The dataframe can be access as follows:
R provides an interactive environment for data analysis and statistical computing. It supports several basic various data types that are frequently used in different calculation and analysis-related work. It supports six basic data types, such as numeric (real or decimal), integer, character, logical, complex, and raw.
References
- 1. Bercea, I.O. Even, G., An extendable data structure for incremental stable perfect hashing, in: STOC 2022 - Proceedings of the 54th Annual ACM SIGACT Symposium on Theory of Computing. (Proceedings of the Annual ACM Symposium on Theory of Computing). S. Leonardi, & A. Gupta (Eds.), pp. 1298–1310, Association for Computing Machinery, 2022. https://doi.org/10.1145/3519935.3520070.
- 2. Ozturk, Z., Topcuoglu, H. R., Kandemir, M.T., Studying error propagation on application data structure and hardware. Journal of Supercomput., 78, 17, 18691–18724, 2022. https://doi.org/10.1007/s11227-022-04625-x
- 3. Wickham, H. and Grolemund, G., R for data science: Import, tidy, transform, visualize, and model data, Paperback – 4 February 2017.
- 4. Prakash, P.K.S., Krishna Rao, A.S., R data structures and algorithms. Packt Publishing; 1st edition, 21 November 2016.
Note
- *Corresponding author: [email protected]