
2
Skills and Responsibilities of Data Wrangler
Prabhjot Kaur, Anupama Kaushik and Aditya Kapoor*
Department of Information Technology, Maharaja Surajmal Institute of Technology, Janak Puri, New Delhi, India
Abstract
The following chapter will draw emphasis on the right skill set that must be possessed by the administrators to be able to handle the data and draw interpretations from it. Technical skill set includes knowledge of statistical languages, such as R, Python, and SQL. Data administrators also use tools like Excel, PoweBI, Tableau for data visualization. The chapter aims to draw emphasis on the requirement of much needed soft skills, which provide them an edge over easy management of not just the data but also human resources available to them. Soft skills include effective communication between the clients and team to yield the desired results. Presentation skills are certainly crucial for a data engineer, so as to be able to effectively communicate what the data has to express. It is an ideal duty of a data engineer to make the data speak. The effectiveness of a data engineer in their tasks comes when the data speaks for them. The chapter also deals with the responsibilities as a data administrator. An individual who is well aware of the responsibilities can put their skill set and resources to the right use and add on to productivity of his team thus yielding better results. Here we will go through responsibilities like data extraction, data transformation, security, data authentication, data backup, and security and performance monitoring. A well aware administrator plays a crucial role in not just handling the data but the human resource assigned to them. Here, we also look to make readers aware of the consequences of mishandling the data. A data engineer must be aware of the consequences of data mismanagement and how to effectively handle the issues that occurred. At the end, the chapter is concluded with discussion of two case studies of the two companies UBER and PepsiCo and how effective data handling helped them get better results.
Keywords: Data administrator, data handling, soft skills, responsibilities, data security, data breaching
2.1 Introduction
In a corporate setup, someone who is responsible for processing huge amounts of data in a convenient data model is known as a data administrator [1]. Their role is primarily figuring out which data is more relevant to be stored in the given database that they are working on. This job profile is basically less technical and requires more business acumen with only a little bit of technical knowledge. Data administrators are commonly known as data analysts. The main crux of their job responsibility is that they are responsible for overall management of data, and it is associated resources in a company.
However, at times, the task of the data administrators is being confused with the database administrator (DBA). A database administrator is specifically a programmer who creates, updates and maintains a database. Database administration is DBMS specific. The role of a data administrator is more technical and they are someone who is hired to work on a database and optimize it for high performance. Alongside they are also responsible for integrating a database into an application. The major skills required for this role are troubleshooting, logical mindset and keen desire to learn along with the changes in the database. The role of a database administrator is highly varied and involves multiple responsibilities. A database administrator’s work revolves around database design, security, backup, recovery, performance tuning, etc.
Data scientist is a professional responsible for working on extremely large datasets whereby they inculcate much needed programming and hard skills like machine learning, deep learning, statistics, probability and predictive modelling [2]. A data scientist is the most demanding job of the decade. A data scientist role involves studying data collected, cleaning it, drawing visualizations and predictions from the already collected data and henceforth predicting the further trends in it. As a part of the skill set, a data scientist must have strong command over python, SQL, and ability to code deep neural networks.
The data scientists as professionals are in huge demand since the era of data exploration has begun. As companies are looking forward to extracting only the needed information from big data, huge volumes of structured or unstructured and semistructured data so as to find useful interpretations which will in turn help in increasing the company’s profits to great extent. Data scientist basically decent on the creative insights drawn from big data, or information collected via processes, like data mining.
2.2 Role as an Administrator (Data and Database)
Data administrators are supposed to render some help to the various other departments like the ones dealing with marketing, sales, finance, and operations divisions by providing them with the data that they need so that all the information concerning product, customer and vendor is accurate, complete and current. As a data administrator, they will basically implement and execute the data mining projects and further create reports using investigative, organizational and analytical skills, to give and have some sales insights. This way, they also get knowledge about different and crucial factors like purchasing opportunity and trends that follow. The job profile is not just restricted to it but it also includes making needed changes or updates in the database of the company and their website. Their tasks include reporting, performing data analysis, forecasting, market assessments and carrying out various other research activities that play an important role in decision making. They play with data according to the need and requirements of the management. A data administrator is also responsible for updating the data of the vendors and products in the company’s database. Not only this but a DBA is also responsible for installing the database softwares [3]. They are also supposed to configure the softwares and according to the requirements they need to upgrade them if needed. Some of the database tools include oracle, MySQL and Microsoft SQL. It is sole responsibility of the DBA to decide how to install these softwares and configure them accordingly [4]. A DBA basically acts as an advisor to the team of database managers and app developers in the company as well. A DBA is expected to be well acquainted with technologies and products like SQL DBA, APIs like JDBC, SQLJ, ODBC, REST, etc., interfacers, encoders, and frameworks, like NET, Java EE, and more.
If we become more specific in terms of roles then a person who works specifically in the warehousing domain is known as data warehouse administrator. As a warehouse administrator, they would specifically need expertise in the domains like:
- Query tools, BI (Business intelligence) applications, etc.;
- OLTP data warehousing;
- Data warehousing specialized designs;
- ETL skills;
- Knowledge of data warehousing technology, various schemas for designs, etc.
Cloud DBA. In today’s world of ever growing data, all the companies and organizations are moving over to the cloud. This has increased the demand of Cloud DBA [5]. The work profile is more or less similar to that of a DBA. It is just that they have switched over to cloud platforms for working. The DBA must have some level of proficiency especially in the implementation on Microsoft Azure, AWS, etc. They should be aware of what is involved in tasks related to security and backup functions on cloud, cloud database implementations. They also look into factors, like latency, cost management, and fault tolerance.
2.3 Skills Required
2.3.1 Technical Skills
It is important to be technically sound and possess some basic skill set to play with data. Here, we describe the need to have skills to work with data and draw inference from the data. The following skills will facilitate your learning and ability to draw inference from the data. The following programming languages and tools pave the way to import and study datasets containing millions of entries in a simplified way.
2.3.1.1 Python
A large amount of the coding population has a strong affinity toward python as a programming language. The first time python was used in 1991 and thereafter it has made a strong user base. It has become one of the most widely used languages credits to its easy understandability. Because of its features like being easily interpreted, and various other historical and cultural reason, Pythonists have come up as a larger community of people in the domain of data analysis and scientific computing [6]. Knowing Python programming has become one of the most basic and crucial tasks to be able to enter the field of data science, machine learning and general software development. But at the same time, due to the presence of other languages, like R, MATLAB, SAS, it certainly draws a lot of comparisons too.
Off late, Python has undoubtedly become an obvious choice because of its widely used libraries like Pandas and scikit-learn. Python is also being used for building data applications, given that it is widely acceptable for software engineering practices. Here we will ponder on a few libraries widely used for data analysis:
a) NumPy: Numerical Python aka NumPy, is a crucial library for numerical computing in Python. It provides the much-needed support required to work on the numerical data and specifically for data analysis.
NumPy contains, among other things:
- It has some crucial functions which make it possible to perform elementwise computations or do some mathematical computations between arrays.
- It also has tools for working with datasets in the form of arrays to the disks.
- It helps us to do various operations related to linear algebra, Fourier transform or random number generation for that very matter.
- Also NumPy facilitates array processing in Python, thus this is one of the most important use of NumPy library in python. It is used for data analysis, whereby it helps to put the data in the form of containers to be passed between the algorithms and libraries.
For numerical data, NumPy arrays have been found to be more efficient in tasks like storage of data and its manipulation in comparison to any other data structures in python.
b) Pandas: The pandas name is derived from panel data. It is basically a term specifically used to describe a multidimensional dataset that is also structured and plays a vital role in Python data analysis itself. It is due to the presence of libraries, like Pandas, which facilitate working with structured data much efficiently and expressively due to the presence of high-level data structures and functions. They have enabled a powerful and much efficient data analysis environment in Python.
The primary object in pandas that is most commonly used is data frame. A data frame is tabular in nature, i.e., column oriented. This data structure has both row and column labels. The series is a 1-D labeled array object. Pandas library perfectly blends the spreadsheets and relational databases (such as SQL) along with high-performance, array-computing ideas of NumPy. Not only this but it also provides an indexing functionality to easily manipulate arrays by reshape, slice and dice, perform aggregations, and select subsets of data. Since data manipulation, preliminaries preparation, and cleaning is such an important skill in data analysis, knowing pandas is one of the primary tasks. Some advantages of Pandas are
- Data structures with labeled axes—this basically acts as a facilitator to prevent common errors to come up that might arise due to misaligned data and at the same time this also helps in working with differently indexed data that might have originated from different sources.
- It also comes with a functionality of integrated time series.
- They help us to undergo various arithmetic operations and reductions that specifically help in reductions that preserve the metadata.
- It is also highly flexible in handling the missing values in the data.
Pandas specifically features deep time series functions which are primarily used by business processes whereby time-indexed data is generated. That is the main reason why main features found in andas are either part of R programming language or is provided by some additional packages.
c)Matplotlib: Matplotlib is one of the most popular Python libraries for producing data visualizations. It facilitates visualization tasks by creating plots and graphs. The plots created using Matplotlib are suitable for publication. Matplotlib’s integration with the rest of the ecosystem makes it the most widely used.
The IPython shell and Jupyter notebooks play a great role in data exploration and visualization. The Jupyter notebook system also allows you to author content in Markdown and HTML, providing a way to create documents containing both code and text. IPython is usually used in the majority of Python work, such as running, debugging, and testing code.
d) SciPy: This library is basically a group of packages, which play a significant role in dealing with problems related to scientific computing. Some of these are mentioned here:
scipy.integrate: It is used for tasks like numerical integrations and solving the complex differential equations.
scipy.linalg: This is basically used for solving linear algebra and plays a crucial role in matrix decompositions. They have more than the once provided in numpy.linalg.
scipy.optimize: This function is used as a function optimizer and root finding algorithm.
scipy.signal: This provides us the functionality of signal processing.
scipy.sparse: This helps us to solve sparse matrices or sparse linear systems.
scipy.stats: This is basically used for continuous and discrete probability distribution. Also, this is used for undergoing various statistical tests and a lot more descriptive mathematical computations performed by both Numpy and SciPy libraries. Further enhancement, the sophisticated and scientific computations were easier.
e) Scikit-learn: This library has become one of the most important general purpose Machine learning toolkits for pythonistas. It has various submodules for various classification, regression, clustering, and dimensionality reduction algorithms. It helps in model selection and at the same helps in preprocessing. Various preprocessing tasks that it facilitates include feature selection, normalization.
Along with pandas, IPython, scikit-learn has a significant role in making python one of the most important data science programming languages.
In comparison to scikit-learn, statsmodel also has algorithms which help in classical statistics and econometrics. They include submodules, such as regression models, analysis of variance (ANOVA), time series analysis, and nonparametric methods.
2.3.1.2 R Programming Language [7]
R is an extremely flexible statistics programming language and environment that is most importantly Open Source and freely available for almost all operating systems. R has recently experienced an “explosive growth in use and in user contributed software.”
R has ample users and has up-to-date statistical methods for analysis. The flexibility of R is unmatched by any other statistics programming language, as its object-oriented programming language allows for the performance of customized procedures by creating functions that help in automation of most commonly performed tasks.
Currently, R is maintained by the R Core Development Team R being an open source can be improvised by the contributions of users from throughout the world. It just has a base system with an option of adding packages as per needs of the users for a variety of techniques.
It is advantageous to use R as a programming language in comparison to other languages because of its philosophy. In R, statistical analysis is done in a series of steps, and its immediate results are stored in objects, these objects are further interrogated for the information of interest. R can be used in integration with other commonly used statistical programs, such as Excel, SPSS, and SAS.R uses vectorized arithmetic, which implies that most equations are implemented in R as they are written, both for scalar and matrix algebra. To obtain the summary statistics for a matrix instead of a vector, functions can be used in a similar fashion.
R as a programming language for data analysis can successfully be used to create scatterplots, matrix plots, histogram, QQ plot, etc. It is also used for multiple regression analysis. It can effectively be used to make interaction plots.
2.3.1.3 SQL [8]
SQL as a programming has revolutionized how the large volumes of data is being perceived by people and how we work on it. Ample SQL queries play a vital role in small analytics practices. SELECT query can be coupled with function or clauses like MIN, MAX, SUM, COUNT, AVG, GROUP BY, HAVING etc on the very large datasets.
All SQL databases, be it commercial/relational/open-source can be used for any type of processing. Big analytics primarily denote regression or data mining practices. They also cover machine learning or other types of complex processing under them. SQL also helps in extraction of data from various sources using SQL queries. The sophisticated analysis require some good packages like SPSS, R, SAS, and some hands-on proficiency in coding.
Usually, statistical packages load their data to be processed using one or more from the following solutions:
- The data can be directly imported from external files where this data is located. This data can be in the form of Excel, CSV or Text Files.
- They also help in saving the intermediate results from the data sources. These data sources can be databases or excel sheets. These are then saved in common format files and then these files are further imported into various packages. Some commonly used interchanging formats are XML, CSV, and JSON.
In recent times, it has been observed that there are ample options available for data imports. Google Analytics being such a service that is becoming quite known among the data analytics community lately. This helps in importing data from the web servers log simply by using user-defined or some standard ETL procedures. It has been found that NoSQL systems have an edge over this particular domain and a significant presence.
In addition to directly importing via ODBC/JDBC connections, at times it is even possible to undergo a database query in a database server with the help of the statistical package directly. For example R users can query SQLLite databases along with directly having the results from the tables into R workspace.
Basically SQL is used to extract records from the databases that are basically very very huge. They also use relational databases to do the needful. The SELECT statement of SQL has some major powerful clauses for filtering records. It helps in grouping them or doing complex computations. The SQL as a programming language has attained center stage due to high-level syntax, which primarily does not require any core coding for most of the queries. It also implements queries from one platform to another like from all database management systems, from desktop to open source and to the commercial ones.
Not only this but the result of SQL queries can also be saved/stored inside the databases and can easily be exported from DBMS to any of the targets or formats as well, i.e., Excel/CSV, Text File, HTML.
SQL wide adaptability and easy understandability and its relation with relational databases and more NoSQL datastores implement SQL-like query languages. This makes many data analysis and data science tasks accessible to non-programmers.
2.3.1.4 MATLAB
A programming language and multi-paradigm numerical computing environment, MATLAB is the final step in advanced data plotting, manipulation, and organization. It is great for companies interested in big data and powerful in machine learning. Machine learning is widely popular in data science right now as a branch of artificial intelligence, and having a good grasp of its models can put you ahead.
2.3.1.5 Scala [9]
Scala is a high level language that combines functional and object oriented programming with high performance runtimes. Spark is typically used in most cases when dealing with big data. Since Spark was built using Scala, it makes sense that learning it will be a great tool for any data scientist. Scala is a powerful language that can leverage many of the same functions as Python, such as building machine learning models. Scala is a great tool to have in our arsenal as data scientists. We can use it working with data and building machine learning models. SCALA has gained much needed center stage due to SPARK being coded in scala and SPARK also being widely used.
2.3.1.6 EXCEL
The ability to analyze data is a powerful skill set that helps you make better decisions related to data and enhance your understanding of that particular dataset. Microsoft Excel is one of the top tools for data analysis and the built-in pivot tables are arguably the most popular analytic tool. In MS Excel there are a lot more features than just using it for SUM and COUNT. Big companies still make use of excel efficiently to transform huge data into readable forms so as to have clear insights of the same. Functions such as CONCATENATE, VLOOKUP and AVERAGEIF(S) are another set of important functions used in industry to facilitate analysis. Data analysis makes it easy for us to draw useful insights from data and thereafter help us to take important decisions on the basis of insights. Excel helps us to explore the dataset at the same time it helps in cleaning data. VLOOKUP is one of the crucial functions that is basically used in excel to add/merge data from one table to another. Effective use of excel but businesses has led them to new heights and growths.
2.3.1.7 Tableau [10]
In the world of visualizations, Tableau occupies the leader post. Not just being user friendly and effective in drawing visualizations it does not lag behind in creating graphs like pivot table graphs in Excel. Not just restricted to that Tableau has the ability to handle a lot more data and is quite fast in providing good amount of calculations.
- Here users are able to create visuals quite fast and can easily switch between different models so as to compare them. This way they can further implement the best ones.
- Tableau has an ability to manage a lot of data.
- Tableau has a much simplified user interface which further allows them to customize the view.
- Tableau has an added advantage of compiling data from multiple data sources.
- Tableau has an ability to hold multiple visualizations without crashing.
The interactive dashboards created in Tableau help us to create visualizations in an effective way as they can be operated on multiple devices like laptop, tablet and mobile. Drop and drag ability of Tableau is an added advantage. Not only this tableau is highly mobile friendly. The interactive dashboards are streamlined in a way that they can be used on mobile devices. It even helps us to run the R models, and at the same time import results into Tableau with much convenience. Its ability of integration with R is an added advantage and helps to build practical models. This integration amplifies data along with providing visual analytics. This process requires less effort.
Tableau can be used by businesses to make multiple charts so as to get meaningful insights. Tableau facilitates finding quick patterns in the data that can be analyzed with the help of R. This software further helps us to fetch the unseen patterns in the big data and the visualizations drawn in Tableau can be used to integrate on the websites.
Tableau has some inbuilt features which help the users in understanding the patterns behind the data and find the reasons behind the correlations and trends. Using tableau basically enhances the user’s perspective to look at the things from multiple views and scenarios and this way users can publish data sources separately.
2.3.1.8 Power BI [11]
Main goal as a data analyst is to arrange the insights of our data in such a way that everybody who sees them is able to understand their implications and acts on them accordingly. Power BI is a cloud-based business analytics service from Microsoft that enables anyone to visualize and analyze data, with better speed and efficiency. It is a powerful as well as a flexible tool for connecting with and analyzing a wide variety of data. Many businesses even consider it indispensable for data-science-related work. Power BI’s ease of use comes from the fact that it has a drag and drop interface. This feature helps to perform tasks like sorting, comparing and analyzing, very easily and fast. Power BI is also compatible with multiple sources, including Excel, SQL Server, and cloud-based data repositories which makes it an excellent choice for data scientists (Figure 2.1). It gives the ability to analyze and explore data on-premise as well as in the cloud. Power BI provides the ability to collaborate and share customized dashboards and interactive reports across colleagues and organizations, easily and securely.

Figure 2.1 PowerBI collaborative environment.
Power BI has some different components available that can certainly be used separately like PowerBI DesktopPowerBU Service, PowerBI Mobile Apps, etc. (Figure 2.2).
No doubt the wide usability of PowerBI is due to the additional features that it provides over the existing tools used for analytics. Some add-ons include facilities like data warehousing, data discovery, and undoubtedly good interactive dashboards. The interface provided by PowerBI is both desktop based and cloud powered. Added to it its scalability ranges across the whole organization.
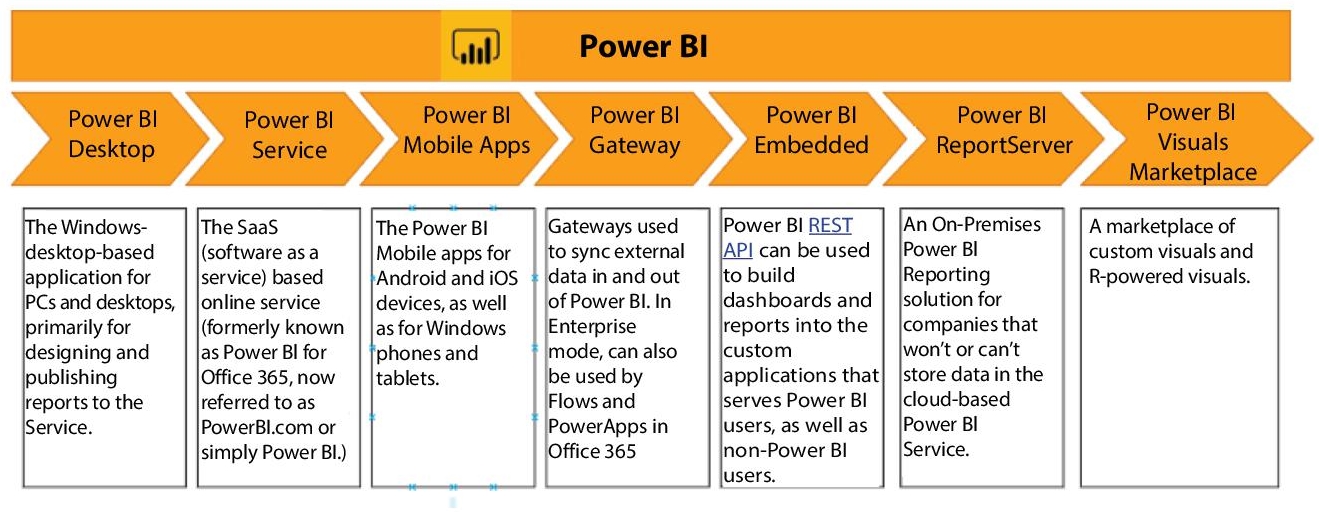
Figure 2.2 Power BI’s various components.
Power BI is free, and initially, its analysis work begins with a desktop app where the reports are made then it is followed up by publishing them on Power BI service from where they can be shared over mobile where these reports can easily be viewed.
Power BI can either be used from the Microsoft store or downloading the software locally for the device. The Microsoft store version is an online form of this tool. Basic views like report view, data view, relationship view play a significant role in visualizations.
2.3.2 Soft Skills
It can be a tedious task to explain the technicalities behind the analysis part to a nontechnical audience. It is a crucial skill to be able to explain and communicate well what your data and related findings have to say or depict. As someone working on data you should have the ability to interpret data and thus impart the story it has to tell.
Along with technical skills, these soft skills play a crucial role. Just technical know-how cannot make you sail through swiftly, lest you possess the right soft skills to express that you cannot do justice to it.
As someone working with and on data you need to comfort the audience with your results and inform them how these results can be used and thereafter improve the business problem in a particular way. That is a whole lot of communicating. Here we will discuss a few of those skills that someone working in a Corporate must possess to ease things for themselves.
2.3.2.1 Presentation Skills
Presentation may look like an old way or tedious as well for that very matter but they are not going to go anywhere anytime soon. As a person working with data you are going to have to at some time or another to deliver a presentation. There are different approaches and techniques to effectively handle different classes of presentations:
One-on-One: A very intimate form of presentations whereby the delivery of information is to one person, i.e., a single stakeholder. Here the specific message is conveyed directly. It is important to make an effective engagement with the person whom the presentation is being given. The speaker should not only be a good orator but should also possess the ability to make an effective and convincing story which is supported by facts and figures so that it increases credibility.
Small Intimate Groups: This presentation is usually given to the board of members. These types of presentations are supposed to be short, sharp and to the point, because the board often has a number of topics on agenda. All facts and figures have to be precise and correct and that the number has been double checked. Here the meetings are supposed to end with a defined and clear conclusion to your presentation.
Classroom: It is a kind of presentation whereby you involve around 20 to 40 participants in your presentations, it becomes more complex to get involved with each and every attendee, hence make sure that whatever you say is precise and captivating. Here, it is the duty of the presenter to keep the message in his presentation very precise and relevant to what you have said. Make sure that your message is framed appropriately and when you summarize just inform them clearly with what you have presented.
Large Audiences: These types of presentation are often given at the conferences, large seminars and other public events. In most of the cases the presenter has to do brand building alongside conveying the message that you want to convey or deliver. It is also important to be properly presentable in terms of dressing sense. Use the 10-20-30 rule: 10 slides, 20pt font and 30 minutes. Make sure you are not just reading out the PPT. You will have to explain the presentations precisely to clarify the motive of your presentation. Do not try and squeeze in more than three to five key points. During a presentation, it should be you as a person who should be in the focus rather than the slides that you are presenting. And never, ever read off the slides or off a cheat sheet.
2.3.2.2 Storytelling
Storytelling is as important as giving presentations. Via storytelling the presenter basically makes their data speak and that is the most crucial task as someone working on data. To convey the right message behind your complex data, be it in terms of code or tool that you have used, the act of effective storytelling makes it simplified.
2.3.2.3 Business Insights
As an analyst, it is important that you have a business acumen too. You should be able to draw interpretations in context to business so that you facilitate the company’s growth. Towards the end it is the aim of every company to use these insights to work on their market strategies so as to increase their profits. If you already possess them it becomes even easy to work with data and eventually be an asset to the organization.
2.3.2.4 Writing/Publishing Skills
It is important that the presenter must possess good writing and publishing skills. These skills are used for many purposes in a corporate world as an analyst. You might have to draft reports or publish white papers on your work and document them. You will have to draft work proposals or formal business cases for c-suite. You will be responsible to send official emails to the management. A corporate work culture does not really accept or appreciates social media slang. They are supposed to be well documented and highly professional. You might be responsible for publishing content on web pages.
2.3.2.5 Listening
Communication is not just about what you speak. It comprises both your speaking and listening skills. It is equally important to listen to what is the problem statement or issue that you are supposed to work on, so as to deliver the efficient solution. It is important to listen to what they have to say—what are their priorities, their challenges, their problems, and their opportunities. Make sure that everything you have to do should be able to deliver and communicate aptly. For this you first yourself have to understand them and analyze what can be the effect of different things on the business. As someone on data it is important that you should make constant efforts to perceive what is being communicated to you. As an effective listener you hear that is being said, assimilate and then respond accordingly. As an active listener you can respond by speaking what has been spoken so that you can cross check or confirm that you heard it right. As a presenter, you should show active interest in what others have to say. As an analyst you should be able to find important lessons from small things. They can act as a source of learning for you. Look for larger messages behind the data.
Data analysts should always be on the lookout for tiny mistakes that can lead to larger problems in the system and to later them beforehand so as to avoid bigger mishappenings in near future.
2.3.2.6 Stop and Think
This goes hand-in-hand with listening. The presenter is supposed to not be immediate with the response that he/she gives to any sort of verbal or written communications. You should never respond in a haste manner because once you have said something on the company’s behalf on record you cannot take your words back. This should be specially taken into account on the soft cases or issues that might drive a negative reaction or feedback. It is absolutely fine and acceptable to think about an issue and respond to it thereafter. Taking time to respond is acceptable rather than giving a response without thinking.
2.3.2.7 Soft Issues
Not just your technical skills will help you make a sail through. It is important to acquaint oneself to the corporate culture and hence you should not only know how to speak but how much to speak and what all to speak. An individual should be aware of corporate ethics and then can in all help the whole organization to grow and excel. There are a number of soft issues that are to be taken into account while being at a workplace. Some of them are as follows:
- Addressing your seniors at the workplace with ethics and politely.
- One should try not to get involved in gossip in the office.
- One should always dress appropriately, i.e., much expected formals, specifically when there are important meetings with clients or higher officials from the office.
- One should always treat fellow team members with respect.
- You should possess good manners and etiquette.
- One should always make sure that they respect the audience’s opinion and listen to them carefully.
- You should always communicate openly and with much honesty.
- You should been keen to learn new skills and things.
2.4 Responsibilities as Database Administrator
2.4.1 Software Installation and Maintenance
As a DBA, it is his/her duty to make the initial installations in the system and configure new Oracle, SQL Server etc databases. The system administrator also takes the onus of deployment and setting up hardware for the database servers and then the DBA installs the database software and configures it for use. The new updates and patches are also configured by a DBA for use. DBA also handles ongoing maintenance and transfers data to the new platforms if needed.
2.4.2 Data Extraction, Transformation, and Loading
It is the duty of a DBA to extract, transform and load large amounts of data efficiently. This large data has been extracted from multiple systems and is imported into a data warehouse environment. This external data is thereafter cleaned and is transformed so that it is able to fit in the desired format and then it is imported into a central repository.
2.4.3 Data Handling
With an increasing amount of data being generated, it gets difficult to monitor so much data and manage them. The databases which are in image/ document/sound/audio-video format can cause an issue being unstructured data. Efficiency of the data shall be maintained by monitoring it and at same time tuning it.
2.4.4 Data Security
Data security is one of the most important tasks that a DBA is supposed to do. A DBA should be well aware of the potential loopholes of the database software and the company’s overall system and work to minimize risks. After everything is computerized and depends on the system so it cannot be assured of hundred percent free from the attacks but opting the best techniques can still minimize the risks. In case of security breaches a DBA has authority to consult audit logs to see the one who has manipulated the data.
2.4.5 Data Authentication
As a DBA, it is their duty to keep a check of all those people who have access to the database. The DBA is one who can set the permissions and what type of access is given to whom. For instance, a user may have permission to see only certain pieces of information, or they may be denied the ability to make changes to the system.
2.4.6 Data Backup and Recovery
It is important for a DBA to be farsighted and hence keeping in mind the worst situations like data loss. For this particular task they must have a backup or recovery plan handy. Thereafter they must take the necessary actions and undergo needed practices to recover the data lost. There might be other people responsible for keeping a backup of the data but a DBA must ensure that the execution is done properly at the right time. It is an important task of a DBA to keep a backup of data. This will help them restore the data in case of any sort of sudden data loss. Different scenarios and situations require different types of recovery strategies. DBA should always be prepared for any kind of adverse situations. To keep data secure a DBA must have a backup over cloud or MS azure for SQL servers.
2.4.7 Security and Performance Monitoring
A DBA is supposed to have the proper insights of what is the weakness of the company’s database software and company’s overall system. This will certainly help them to minimize the risk for any issues that may arise in the near future. No system is fully immune to any sort of attacks, but if the best measures are implemented then this can be reduced to a huge extent. If an adverse situation of attack arises then in that case a DBA ought to consult audit logs to validate who has worked with the data in the past.
2.4.8 Effective Use of Human Resource
An effective administrator can be one who knows how to manage his human resource well. As a leader it is his/her duty to not only assign the tasks as per his members skill set and help them grow and enhance their skills. There are chances of internal mismanagement due to which, at times, it is the company or the output of the team indirectly which has to suffer.
2.4.9 Capacity Planning
An intelligent DBA is one who plans for things way before and keeps all situations in mind, so is the situation of capacity planning. A DBA must know the size of the database currently and what is the growth of the database in order to make future predictions about the needs of the future. Storage basically means the amount of space the database needs in server and backup space as well. Capacity refers to usage level. If a company is growing and keeps adding many new users, the DBA will be supposed to handle the extra workload.
2.4.10 Troubleshooting
There can be sudden issues that may come up with the data. For the issues that come up this way, DBA are the right people to be consulted at the moment. These issues can be quickly restoring the lost data or handling the issue with cre in order to minimize the damage, a DBA needs to quickly understand and respond to the problems when they occur.
2.4.11 Database Tuning
Monitoring the performance is a great way to get to know where the database is to be tweaked so as to operate efficiently. The physical configuration of the database, indexing of the database and the way queries are being handled all can have a dramatic effect on the database’s performance. If we monitor it in a proper way, then the tuning of the system can be done just based on the application, not that we will have to wait for the issue to arise.
2.5 Concerns for a DBA [12]
- A responsible DBA also has to look into issues like security breach or attack. A lot of businesses in the UK have reported an attempt of data breach at least once in the last year. The bigger companies hold a lot of data and as a result the risk that the company might face from the cyber criminals is also very large. The possibility increases to 66% for medium-sized firms and 68% for large firms.
- A Company’s database administrator could also put their employees’ data at risk. A DBA is often warned over and over again that a company’s employees’ behavior can have a big impact on data security in their organization. The level of security of data can bind them with the organization for a longer time. It should be kept in mind that data security is a two-way street. Sensitive information about people in your company is just as valuable as your customers’ data, therefore security procedures and processes have to be of top most priority for both employees’ and customers’ information.
- A DBA might have to look at things like DDoS attacks that a company might have to face. The type of attacks are the ones in which the attackers attack the machines or take down the whole network resources. The type of attacks can be temporary or may disrupt the internet. There is a fear that they might even lead to severe financial losses. These attacks may even lead to huge loss of finances to the company. In ample of these attacks the attacker has particularly dived into the person’s wallet. A prediction says that by 2021, these attacks will cost the world over $5 Billion.
- A DBA needs to make sure that the company is abiding by the rules and regulations set by the government. At times companies try to surpass some important checks in order to maximize profits and thus put data security at stake. As different countries have different policies the organizations are supposed to change their terms accordingly. This is the duty of DBA to make sure they abide by all the regulations.
In 2016, UK businesses were fined £3.2 million in total for breaching data protection laws.
- A DBA could be responsible for putting some confidential property or data that is supposed to be secretive at risk. Cybercrimes are not just restricted to financial losses but they also put intellectual property at risk.
In the UK, 20% of businesses admit they have experienced a breach resulting in material loss.
- In case your company’s database is hit with a virus, DBA will have to cater to such sudden mishappenings. WannaCry, StormWorm and MyDoom are some softwares that have topped the list of being mass destructors.
According to research conducted by the UK Government’s National Cyber Security Program, it has been found that 33% of all data breaches are a consequence of malicious software.
- It is important that the passwords that you keep for your account are not the same or easily identifiable. These passwords might be easy for us to memorize but it is risky at the same time because they can easily be cracked. Short passwords are highly vulnerable to be encoded by the attackers. Keep passwords in a way that they are mixture of both lower and upper case alphabets and have special symbols too.
- A company could also suffer damaging downtime. Often companies spend a lot on PR teams to maintain a good image in the corporate world. This is primarily done to keep a hold of good customers and at the same time eliminate competition. However just a single flaw or attack can put things upside down. This can damage the company’s had earned reputation and this damage shall be irreplaceable.
It has been found that per minute loss can amount to as high as £6,000 due to an unplanned outage.
- A data breach act could hurt a company’s reputation. It is very important for a company to maintain a positive image in the corporate world. Any damages to their image can significantly damage their business and future prospects.
According to 90% of CEOs, striving to rebuild commercial trust among stakeholders after a breach is one of the most difficult tasks to achieve for any company—regardless of their revenue.
- It might even happen that this might result in physical data loss. The physical data loss is something irreplaceable and amounts to huge losses.
2.6 Data Mishandling and Its Consequences
The mishandling of data is basically termed as data breaching. Data breach [13] refers to the process of stealing of the information. The information is taken from the systems by the attackers without any knowledge of the owner or company. The attack is carried out in an unauthorized and unlawful way. Irrespective of the company size, their data can be attacked by the attackers. The data attacked might be highly confidential and sensitive. Now being accessed by the wrong people might lead to serious trade threats or security threats. The effects of the data breach can not only be harmful to the people whose data is at risk but can significantly damage the reputation of the company as well. Victims might even suffer serious financial losses in case they are related to credit card or passwords. A recent survey found out that the personal information stolen was at the first position followed up by financial data being stolen. This was evaluated on the data from year 2005 to 2015.
Data leaks are primarily malware attacks but at the same time there can be other factors too at the same time:
- Some insiders from the organization might have leaked the data.
- Fraud activities associated with Payments cards.
- Data loss could be another reason. This is primarily caused by mishandling.
- Unintended disclosure.
Data theft is continuing [14] to make headlines despite the fact that there has been a lot of awareness among the people and companies. Not just the awareness but there have been stricter laws formulated by the government to prevent the data breach activities. However, cybercriminals have found their way into people’s data and have been posing a threat continuously. They have their different ways of getting into the network. It can be either through social engineering. technique or maybe malware or supply chain attacks. The attackers basically try to infiltrate profits via this.
Unfortunately, the main concern here is despite the repeated increase in issues of data breaching and threat to the data some organizations are certainly not prepared to handle these situations of attack on their systems. Many organizations are willingly underprepared and fail to inculcate proper security systems in their working to avert any sort of cyberattacks.
In a recent survey conducted, it was discovered that nearly 57% companies still do not have cyber security policy and this has risen to nearly 71% of the medium sized businesses having nearly 550 to 600 employees. Companies need to ponder on the after effects of data breach on them and their customers this will certainly compel them to work on bettering their system to avert the cyberattacks.
2.6.1 Phases of Data Breaching
- Research: This is the first and the foremost thing that an attacker would do. After having picked the target an attacker would find the necessary details needed for carrying out the activity/act of data breaching. They find the loopholes in the system or weakness which makes it easy for them to dive in the required information. They get the detail information about the company’s infrastructure and do the primary stalking about the employees from various platforms.
- Attack: After having the much-needed details of the company and its infrastructure, the attacker makes/carries out the first step by making some initial contact either via some network or maybe social media.
In a network-based attack, the main task/purpose of the attacker is to exploit the weaknesses of the target’s infrastructure to undergo the breach. The attackers may undergo an SQL injection or maybe session hijacking.
In a social attack, the attacker uses social engineering tactics to dive into the target network. They may hit the company’s employees in the form of a well-crafted email, and thereafter, the email can phish data by compelling them to provide the personal data in the email. Or that mail may contain some malware attached to it that may get executed as and when the mail is opened.
Exfiltrate: So as soon as the attacker accesses the network they are free to extract any sort of information from the company’s database. That data can be used by the attackers for any of the unlawful practices that will certainly harm the company’s reputation and keep future prospects at stake.
2.6.2 Data Breach Laws
It is important to have administration intervention to prevent the ill practices that occur with data. Data breach laws and the related punishments vary in various nations. Many countries still do not require organizations to notify authorities in cases of data breach. In countries like the US, Canada, and France, organizations are obliged to notify affected individuals under certain conditions.
2.6.3 Best Practices For Enterprises
- Patch systems and networks accordingly. It is the duty of the IT administrators to make sure that the systems in the network are well updated. This will prevent them from the attackers and make them less vulnerable to being attacked in near future.
- Educate and enforce. It is crucial to keep the employees informed about the threats and at the same time impart the right knowledge to them regarding social engineering tactics. This way they will get acquainted with situations where they might have to handle any adverse situation.
- Implement security measures. Experimenting and implementing changes is the primary job here. They are supposed to identify risk factors, ponder on its solutions and then thereafter implement the measures. They also have to bring improvisations to keep a check of the solutions they have implemented.
- Create contingencies. It is crucial to be prepared for the worst so for this particular thing there should be an effective recovery plan put forward so that whenever there is a data breach activity the team and the people know do they handle it, who all will be the contact persons, what are the disclosure strategies, what all would be the mitigation steps and also that employees are well aware of this plan.
2.7 The Long-Term Consequences: Loss of Trust and Diminished Reputation
The long-term effect of data breach could be the loss of faith amongst the customers. The customers share their sensitive information with the company considering the fact that the company will certainly look into data security and their information with the company is safe. In a survey conducted in 2017 by PwC it was found that nearly 92% of people agreed with the fact that the companies will take customer’s data security as a prime concern and top most priority. A goodwill of the company among the customers is highly valued and is the most prized asset. However, instances of data breach can be significantly harmful and damage the reputation earned with much effort and years of service with excellence.
The PwC [15] report found that 85% of consumers will not shop at a business if they have concerns about their security practices. In a study done by Verizon in year 2019, it was found that nearly 29% of people will not return to the company back again where they have suffered any sort of data breach. It is important to understand the consequences because this way the companies will be able to secure their businesses in the long run and at the same time maintain the reputation as well.
2.8 Solution to the Problem
Acknowledging critical data is the first step: As an administrator you cannot secure something that you do not acknowledge. Just have a look at your data about where it is located or how it is being stored or handled. You must look at it from an outsider’s perspective. You must look at it from obvious places that are being overlooked such as workstations, network stations and backups. But at the same time there can be other areas too where data might be stored out of our security control such as cloud environments. All it takes is one small oversight to lead to big security challenges.
2.9 Case Studies
2.9.1 UBER Case Study [16]
Before we get into knowing about how UBER used data analytics in improving and optimizing their business, let us make an effort to understand the business model of UBER and understand its work.
Uber is basically a digital aggregator application platform, which connects the passengers who need to commute from one place to another with drivers who are interested in providing them the pick and drop facility. The demand/need is put forward by the drivers and drivers supply the demand. Also Uber at the same time acts as a facilitator to bridge the gap and make this hassle free process via a mobile application. Let us study key components of UBER’s working model by understanding the following chart:

Figure 2.3 UBER’s working model.
Since riders and drivers are the crucial and most important part of UBER’s business model (Figure 2.3). UBER certainly has valuable features to provide its users/riders, some of which are:
- Booking cab on demand
- Tracking the movement in real time
- Precise Estimated Time of Arrival
- Using digital media for paying money cashless way
- Lessen the waiting time
- Upfront ride fares
- Ample of Cab Options
Similarly, Uber’s value propositions for drivers are:
- Flexibility in driving on their own conditions and terms
- Better Compensation in terms of money earned
- Lesser idle time to get new rides
- Better trip allocation
The main issue that pops up now is that how is Uber deriving its monetary profits? Or what is the system by which Uber streams its revenue? If we have a look at it from a higher view, Uber basically takes commission from drivers for every ride that is being booked from their app also at the same time they have different ways to increase revenue for themselves:
- Commission from rides
- Premium rides
- Surge pricing
- Cancellation fees
- Leasing cars to drivers
- Uber eats and Uber freights
2.9.1.1 Role of Analytics and Business Intelligence in Optimization
Uber undoubtedly has a huge database of drivers, so whenever a request is put in for a car, the Algorithm is put to work and it will associate you to the nearest drive in your locality or area. In the backend, the company’s system stores the data for each and every journey taken—even if there is no passenger in the car. The data is henceforth used by business teams to closely study to draw interpretations of supply and demand market forces. This also supports them in setting fares for the travel in a given location. The team of the company also studies the way transportation systems are being managed in different cities to adjust for bottlenecks and many other factors that may be an influence.
Uber also keeps a note of the data of its drivers. The very basic and mere information is not just what Uber collects about its drivers but also it also monitors their speed, acceleration, and also monitors if they are not involved with any of their competitors as well for providing any sort of services.
All this information is collected, crunched and analyzed to carry forward some predictions and devise visualizations in some vital domains namely customer wait time, helping drivers to relocate themselves in order to take advantage of best fares and find passengers accordingly at the right rush hour. All these items are implemented in real time for both drivers and passengers alike.
The main use of Uber’s data is in the form of a model named “Gosurge” for surge pricing.” Uber undergoes real-time predictive modeling on the basis of traffic patterns, supply and demand.
If we look at it from a short term point of view, surge pricing substantially has a vital effect in terms of the rate of demand, while long-term use could be using the service for customer retention or losing them. It has effectively made use of Machine Learning for the purpose of price prediction especially in case of price hiking, thus it can effectively increase the adequate price to meet that demand, and surge can also be reduced accordingly. This is primarily because the customer backlash is strong in case of rate hiking.
Keeping in mind, these parameters of supply and demand keep varying from city to city, so Uber engineers have found a way to figure out the “pulse” of a city to connect drivers and riders in an efficient manner. Also we have to keep this factor in mind that not all metropolitan cities are alike. Let us see an overview comparison of London and New York for a better overview and insights:
Collection of all the information is basically one minor step in the long journey of Big data and drawing further interpretations from the same. The real question is - How can Uber channelize this huge amount of data to make decisions and use this information? How do they basically glean main points to ponder on out of such a huge amount of data? For example, How does Uber basically manage millions of GPS locations. Every minute, the database is getting filled with not just driver’s information but also it has a lot of information related to users. How does Uber make effective use of the very minute details so as to better manage the moving fellas and things from one place to another ?
Their answer is data visualization. Data visualization specialists have a varied variety of professionals from Computer Graphics background to information design (Figure 2.4). They look into different aspects right from Mapping and framework developments to data that the public sees. And a lot of these data explorations and visualizations are completely fresh and never have been done before. This has basically developed a need for tools to be developed in-house.

Figure 2.4 UBER’s trip description in a week.
2.9.1.2 Mapping Applications for City Ops Teams

Figure 2.5 UBER’s city operations map visualizations.
These visualizations are not the ones specifically meant for the data scientist or engineers but in general for the public as well for having a better understanding and clarity (Figure 2.5). It helps the public to better understand the working insights of the giant, such as visualization helps to know about uberPOOL and thus plays a significant role to reduce traffic (Figure 2.6).

Figure 2.6 UBER’s separate trips and UBER-Pool trips.
Another example of this visualization is particularly in Mega cities, where understanding the population density of a given area is of significant importance and they play a vital role in dynamic pricing change. Uber illustrates this with a combination of layers that helps them to narrow down to see a specific are in depth (Figure 2.7):
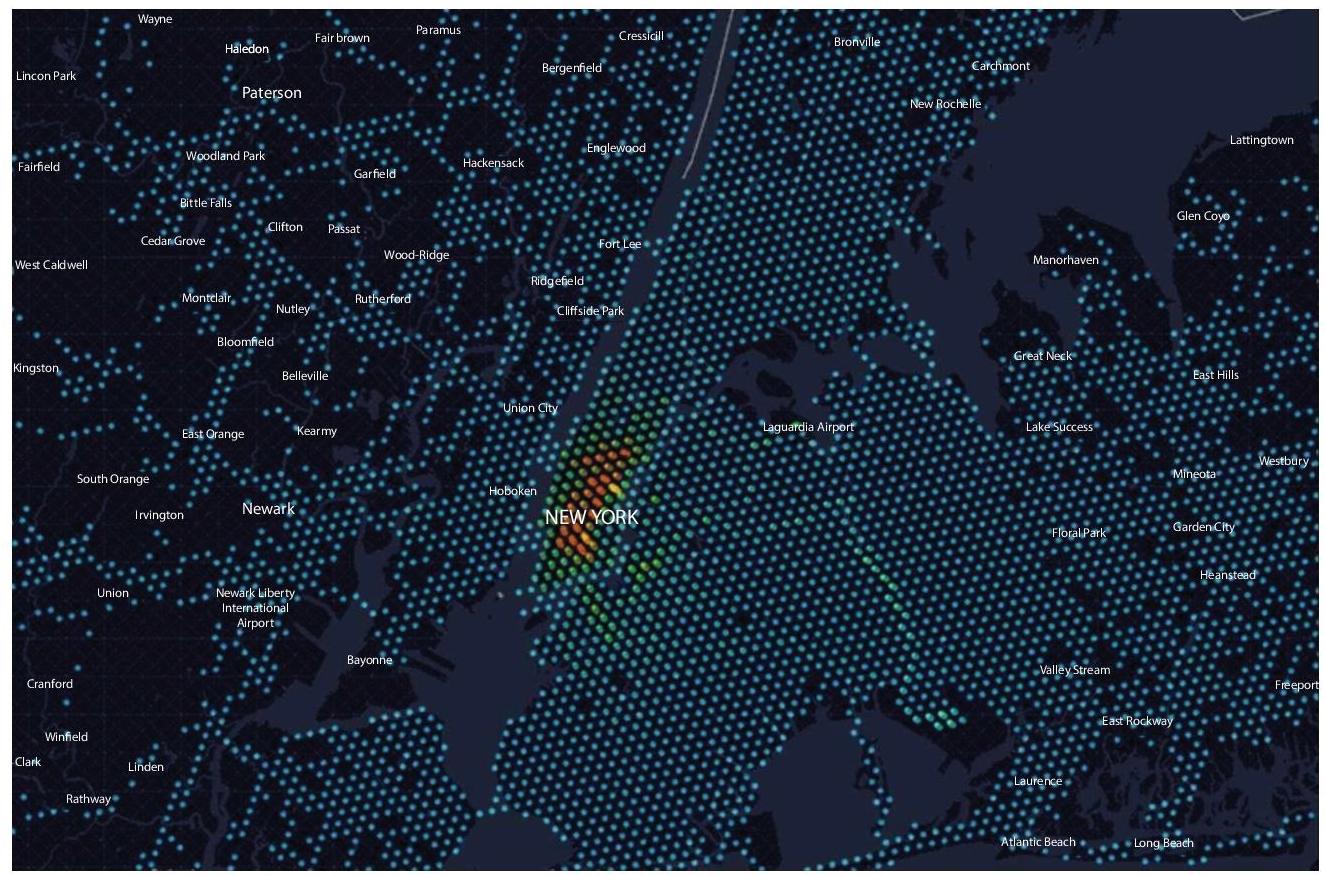
Figure 2.7 Analysis area wise in New York.
Not just visualizations, Forecasting as well plays a significant role in business intelligence techniques that are being used by Uber to optimize future processes.
2.9.1.3 Marketplace Forecasting
A crucial element of the platform, marketplace forecasting helps Uber to predict user supply and demand in a spatiotemporal fashion to help the drivers to reach the high-demand areas before they arise, thereby increasing their trip count and hence shooting their earnings (Figure 2.8). Spatiotemporal forecasts are still an open research area.
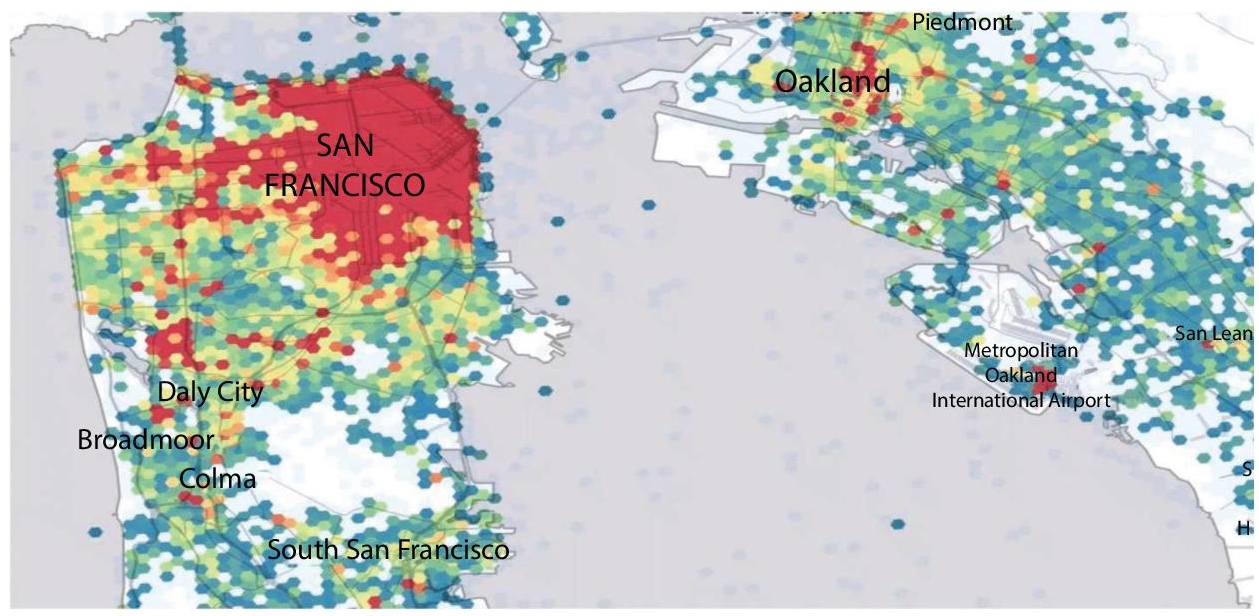
Figure 2.8 Analysis area wise in spatiotemporal format.
2.9.1.4 Learnings from Data
It is just one aspect to describe how Uber uses data science, but another aspect is to completely discover what these results or findings have to say beyond that particular thing. Uber teaches us an important thing to not just have a store of humongous data but at the same time making a use of it effectively. Also an important takeaway from the working style of Uber is that they have a passion to drive some useful insights from every ounce of data that they have and feel it as an opportunity to grow and improve the business.
It is also worth realizing that it is crucial to explore and gather data independently and analyze it for what it is and what is actually going to make insights come up.
2.9.2 PepsiCo Case Study [17]
PepsiCo primarily depends on the huge amount of data to supply its retailers in more than 200 countries and serve a billion customers every day.
Supply cannot be made over the designated amount because it might lead to the wastage of resources. Supplying a little amount as well is problematic because it shall affect the profits and loss and company may reconcile with unhappy and dissatisfied retailers. An empty shelf also paves a way for customers to choose the competitor’s product, which is certainly not a good sign added to it, it has long-term drawbacks on the brand.
Now PepsiCo mainly uses data visualizations and analysis to forecast the sales and make other major decisions. Mike Riegling works as an analyst with PepsiCo in the CPFR team. His team provides insights to the sales and management team. They collaborate with large retailers to provide the supply of their products in the right quantity for their warehouses and stores.
“The journey to analytics success was not easy. There were many hurdles along the way. But by using Trifacta to wrangle disparate data” says Mike. Mike and his teammates made significant reductions to reduce the end-to-end run time of the analysis by nearly 70% Also adding Tableau to their software usage it could cut report production time as much as 90%.
“It used to take an analyst 90 minutes to create a report on any given day. Now it takes less than 20 minutes,” says Mike.
2.9.2.1 Searching for a Single Source of Truth
PepsiCo’s customers give insights that consist of warehousing inventory, store inventory and point-of-sale inventory. The company then rechecks this data with their own shipping history, produced quantity, and further forecast data.
Every customer has their own data standards. It was difficult for the company to do data wrangling in this case. It could take a long time, even months at times, to generate reports. It was another important task for them to derive some significant sales insights from these reports and data. Their teams initially used only Excel to analyze data of large quantities which is primarily messy. At the same time, the team had no proper method to spot errors. A missing product at times led to huge errors in reports and in accurate forecasts. This could lead to losses as well.
2.9.2.2 Finding the Right Solution for Better Data
The most important task for the company initially was to bring coherence to their data. For this they used Tableau and thereafter results were in the form of improved efficiency. Now the new reports basically run without much involvement of multiple access and PepsiCo servers and they run directly on hadoop. The analysts could make manipulations using trifacta now.
As per what company’s officials have said the has been successfully able to bridge the gap between Business and Technology. This technology has successfully helped them to access the raw data and do the business effectively. The use of technology has been such a perfect blend that it has been able to provide a viable solution to each of their problems in an effective way Tableau provides them with finishing step, i.e., basically providing with powerful analytics and interactive visualizations, helping the businesses to draw insights from the volumes of data. Also the analysts as PepsiCo share their reports on business problems with the management using Tableau Servers.
2.9.2.3 Enabling Powerful Results with Self-Service Analytics
Now in the case of PepsiCo it was the combined use of various tools namely Tableau, Hortonworks and Trifacta that have played a vital role driving the key decisions taken by analytic teams. They have helped CPFR teams drive the business forward and thus increased the customer orders. The changes were also visible clearly.
This process of using multiple analytics tools has had multifaceted advantages. Not just it has reduced the time invested upon the data for preparation but added to it ;it has increased an overall data quality.
The use of technology has been of great use for the company. This has been able to save their time significantly as they have been investing time analyzing the data and making their data tell a relevant story rather than putting their data together. They have been able to form better graphs now and study them effectively with much accuracy.
PepsiCo has successfully been able to turn customer data around and successfully present it to the rest of the company such that everyone can understand it better than their competitors.
2.10 Conclusion
This chapter concludes by making the readers aware of both technical and nontechnical skills that they must possess to work with data. The skills will help readers to be effective in dealing with data and grow professionally. Also it makes them aware of their responsibilities as a data or database administrator. Toward the end, we throw some light upon the consequences of data mishandling and how to handle such situations.
References
- 1. https://www.geeksforgeeks.org/difference-between-data-administrator-da-and-database-administrator-dba/ [Date: 11/11/2021]
- 2. https://searchenterpriseai.techtarget.com/definition/data-scientist [Date: 11/11/2021]
- 3. https://whatisdbms.com/role-duties-and-responsibilities-of-database-administrator-dba/ [Date: 11/11/2021]
- 4. https://www.jigsawacademy.com/blogs/data-science/dba-in-dbms/ [Date: 11/11/2021]
- 5. https://www.jigsawacademy.com/blogs/data-science/dba-in-dbms/ [Date: 11/11/2021]
- 6. http://www.aaronyeo.org/books/Data_Science/Python/Wes%20McKinney%20-%20Python%20for%20Data%20Analysis.%20Data%20Wrangling%20with%20Pandas,%20NumPy,%20and%20IPython-O%E2%80%99Reilly%20(2017).pdf [Date: 11/11/2021]
- 7. https://www3.nd.edu/~kkelley/publications/chapters/Kelley_Lai_Wu_Using_R_2008.pdf [Date: 11/11/2021]
- 8. https://reader.elsevier.com/reader/sd/pii/S2212567115000714?token=7721440CD5FF27DC8E47E2707706E08A6EB9F0FC36BDCECF1D3C687635F5F1A69B809617F0EDFFD3E3883CA541F0BC35&originRegion=eu-west-1&originCreation=20210913165257 [Date: 11/11/2021]
- 9. https://towardsdatascience.com/introduction-to-scala-921fd65cd5bf [Date: 11/11/2021]
- 10. https://www.softwebsolutions.com/resources/tableau-data-visualization-consulting.html [Date: 11/11/2021]
- 11. https://www.datacamp.com/community/tutorials/data-visualisation-powerbi [Date: 11/11/2021]
- 12. https://dataconomy.com/2018/03/12-scenarios-of-data-breaches/ [Date: 11/11/2021]
- 13. https://www.trendmicro.com/vinfo/us/security/definition/data-breach [Date: 11/11/2021]
- 14. https://www.metacompliance.com/blog/5-damaging-consequences-of-a-data-breach/ [Date: 11/11/2021]
- 15. https://www.pwc.com/us/en/advisory-services/publications/consumer-intelligence-series/protect-me/cis-protect-me-findings.pdf [Date: 11/11/2021]
- 16. https://www.skillsire.com/read-blog/147_data-analytics-case-study-on-optimizing-bookings-for-uber.html [Date: 11/11/2021]
- 17. https://www.tableau.com/about/blog/2016/9/how-pepsico-tamed-big-data-and-cut-analysis-time-70-59205 [Date: 11/11/2021]
Note
- *Corresponding author: 2000aditya28@gmail