Chapter 2. Service-Level Management
One of the first steps required to successfully design, build, and deploy a service is to understand the expectations of that service. In this chapter, we define what service-level management is and discuss the components of it. We then discuss how to define the expectations of a service and how to monitor and report to ensure we are meeting those expectations. Throughout the chapter, we also build a robust set of service-level requirements to explain this process.
Why Do I Need Service-Level Objectives?
Services that we design and build must have a set of requirements about their runtime characteristics. This is often referred to as a Service-Level Agreement (SLA). An SLA is more than just an enumerated list of requirements, however. SLAs include remedies, impacts, and much more that is beyond the scope of this book. So, we will focus on the term Service-Level Objective (SLO). SLOs are commitments by the architects and operators that guide the design and operations of the system to meet those commitments.
Service-level management is difficult! Condensing it to a chapter is reductive, and it is important to understand the nuances. Let’s take a few examples to illustrate why this problem is difficult:
Maybe you say, I’ll just report on the percentage of requests that are successfully served by my API. Okay...as reported by whom? By the API? That’s obviously a problem, because what if your load balancers are down? Or, what if it returned a 200 error from the database because your service discovery system knew that particular database was unavailable?
Or, what if you say, “Ok, we’ll use a third-party end-to-end checker and calculate how many of those read and write the correct data?” That’s a great thing to do—end-to-end checks are the best high-level reliability alerts. But is it exercising every backend?
Do you factor less-important services into your SLO? Your customers would probably rather have a 99.95% availability rate from your API and a 97% availability from your batch processing product than 99.8% from both your API and and batch processing.
How much control do you have over clients? If your API has a 98% availability, but your mobile clients automatically retry and have a 99.99% reliability response rate within three tries, they might never notice. Which is the accurate number?
Maybe you say, “I’ll just count error percentages,” but what about the errors that are caused by users sending invalid or malformed requests? You can’t actually do anything about that.
Maybe you return a correct result 99.999% of the time, but 15% of the time the latency is more than 5 seconds. Is that acceptable? Depending on the client behavior, that might actually mean your website is unresponsive for some people. You might technically have five 9’s by your own accounting, and yet your users can be incredibly and justifiably unhappy with you.
What if the site is 99.999% up for 98% of your users but only 30% to 70% available for the other 2% of your users? How do you calculate that?
What if one shard or one backend is down or slow? What if you experience 2% data loss due to a bug in an upgrade? What if you experience an entire day of data loss but only for certain tables? What if your users never noticed that data was lost due to the nature of it, but you reported a 2% data loss, alarming everyone and encouraging them to migrate off your stack? What if that 2% data loss actually included rewriting pointers to assets so that even though the data wasn’t “lost” it “could not be found?”
What if some users are experiencing 95% availability because they have bad WiFi, old cable internet, or bad router tables between their client and your server? Can they hold you responsible?
What if it’s from entire countries? Well, then it probably is something that they can blame you for (e.g., packet overruns for DNS UDP packets by some providers—you can fix this).
What if your number is 99.97%, but every error causes your entire website to fail to load? What if your number is 99.92%, but each page has 1,500 components and users almost never notice when a tiny widget has failed to load. Which experience is better?
Is it better to count actual error rate or by time slices? By the number of minutes (or seconds) when errors or timeouts exceeded a threshold?
Five 9’s?
Many people use a number of 9’s as shorthand to describe availability. For instance, a system is designed to have “five 9’s” of availability. This means that it is built to be available 99.999% of the time, whereas “three 9’s” would be 99.9%.
This is why the practice of designing, curating, and adapting SLO and availability metrics over time is less of a computation problem and more of a social science problem. How do you calculate an availability percentage that accurately reflects the experience of your users, builds trust, and incentivizes in the right direction?
From the perspective of your team, whatever availability metrics you all agree are important to deliver become numbers to be gamed to some extent, even if only subconsciously. Those are the numbers you pay attention to when you’re determining whether your reliability is getting better or worse or whether you need to switch resources from feature development to reliability, or vice versa.
From the perspective of your customers, the most important thing about the metric is that it reflects their experience as much as possible. If you have the ability to calculate metrics per customer or slice and dice the data along arbitrary dimensions—even high-cardinality ones like UUID—this is incredibly powerful. Facebook’s Scuba does this and so does Honeycomb.io.
Service-Level Indicators
When evaluating requirements for SLOs, we will generally consider a finite set of indicators, or metrics, against which we will set requirements. In these objectives, we will consider ideal parameters as well as working parameters. An SLO can be considered a set of one or more indicators that define the expectations of a service, often, because these indicators can be intrinsically linked.
For instance, latency past a certain point will become an availability issue because the system is effectively unusable. Latency without throughput is easy to game and not necessarily an accurate view of the system at load. Typical indicators are enumerated and explained in the subsections that follow.
Latency
Latency, also known as response time, is a time-based measurement indicating how long it takes to receive a response from a request. It is best to measure this for end-to-end response from the customer rather than breaking it down component by component. This is customer-centric design and is crucial for any system that has customers, which is any system!
Latency versus Response Time
Vast wars of ink and blood have been spilled on the topic of latency versus response time. There are some factions that consider latency to be the time it takes to get to the service, whereas response time is the time it takes to service the request. In this book, we use “latency” to refer to the total round-trip time of a request, from initiation to payload delivery.
Availability
This is generally expressed as a percentage of overall time the system is expected to be available. Availability is defined as the ability to return an expected response to the requesting client. Note that time is not considered here, which is why most SLOs include both response time and availability. After a certain latency point, the system can be considered unavailable even if the request is still completing. Availability is often denoted in percentages, such as 99.9% over a certain window. All samples within that window will be aggregated.
Throughput
Another common SLI is throughput, or the rate of successful requests in a specific period of time, typically measured on a per-second basis. Throughput actually becomes quite useful as a companion to latency. When a team is preparing for launch and measuring latency, it must do it at the top throughput goals; otherwise, its tests will be useless. Latency tends to be steady until a certain tipping point, and we must know that tipping point in reference to throughput goals.
Durability
Durability is specific to storage systems and datastores. It indicates the successful persistence of a write operation to storage so that it can be retrieved at another time. This can be expressed in a time window, such as: in the event of a system failure, no more than the past two seconds of data can be lost.
Cost or Efficiency
“Cost or Efficiency” is often overlooked, or not considered in service-level discussions. Instead, you will find it relegated to budget and often not tracked effectively. Still, the overall cost of a service is a critical component to most businesses. Ideally, this should be expressed in cost per action, such as a page view, a subscription, or a purchase.
An organization should expect to have the following actions as part of the operations of their services:
- New service
SLOs Defined. In more traditional models, this might be called operating-level agreements.
- New SLOs
Set up appropriate monitoring to evaluate actual versus target metrics.
- Existing service
Regular reviews of SLOs should be scheduled to validate that current service criticality is taken into account for defined SLOs.
- SLO fulfillment
Regular reports to indicate historical and current status of the achievement or violation of SLOs.
- Service issues
A portfolio of issues that have affected service-levels, and their current status in terms of workarounds and fixes.
Defining Service Objectives
SLOs should be built from the same set of requirements toward which product features are built. We call this customer-centric design because we should be defining requirements based on the needs of our customers. We generally only want up to three indicators. More than three indicators rarely add significant value. Often, excessive numbers of indicators could mean you are including symptoms of primary indicators.
Latency Indicators
A latency SLO can be expressed as a range based on a certain indicator. For instance, we might say that request latency must be less than 100 ms (which is actually a range between 100 ms and 0s when we make assumptions explicit). Latency is absolutely critical to the user experience.
Why Is Latency Critical?
Slow or inconsistently performing services can lose more customers than a system that is down. In fact, speed matters enough that Google Research found that introducing a delay of 100 to 400 ms caused a reduction in searches by 0.2% to 0.6% over 4 to 6 weeks. You can find more details at Speed Matters. Here are some other startling metrics:
-
Amazon: for each 100 ms, it loses 1% of sales
-
Google: if it increases page load by 500 ms, it results in 25% fewer searches
-
Facebook: pages that are 500 ms slower cause a 3% dropoff in traffic
-
A one-second delay in page response decreases customer satisfaction by 16%
We can express an availability SLO like this: Request latency must be less than 100 ms.
If we leave the lower bound at 0, we might drive certain dysfunctions. A performance engineer might spend a week of time getting the response time down to 10 ms, but the mobile devices using the application will rarely have networks that can deliver the results fast enough to utilize this optimization. In other words, your performance engineer just wasted a week of work. We can iterate on the SLO like this: request latency must be between 25 ms and 100 ms.
Let’s next consider how we collect this data. If we are reviewing logs, we might take one minute’s worth of requests and average them. There is a problem with this, however. Most distributed, networked systems create distributions with small percentages of outliers that can be fairly significant. This will skew an average and also hide the complete workload characteristics from the engineers monitoring it. In other words, aggregating response times is a lossyprocess.
In fact, thinking about latency must be done by thinking of latency distributions. Latency almost never follows normal, gaussian or poisson distributions, so averages, medians, and standard deviations are useless at best and lies at worst. More details of this can be considered at “Everything you know about latency is wrong.”
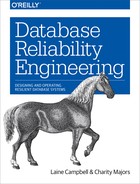
To better understand, take a look at Figures 2-1 and 2-2 provided by Circonus, a high scale monitoring product. In the blog, these graphs are being used to show spike erosion, which is the phenomenon we’re discussing. In Figure 2-1, we have averages graphed with a larger time window in each average to accommodate for a month’s worth of data.
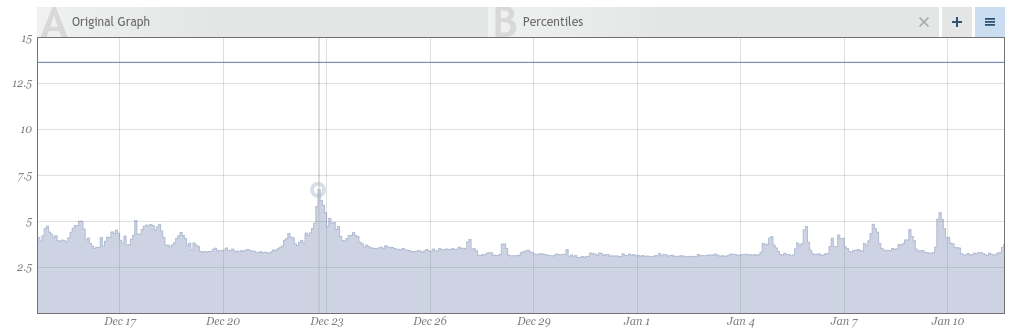
Figure 2-1. Latency averages with larger window of time for each average
In Figure 2-2, we are averaging on much shorter time windows because we are displaying only four hours.

Figure 2-2. Latency averages with a smaller window of time for each average
Even though this is the exact same dataset, the averages in Figure 2-1 indicate a peak of around 9.3, while Figure 2-2 shows 14!
Be Careful Storing Averages!
Remember to store the actual values rather than averages! If you have a monitoring application that is averaging values every minute and not retaining the actual full history of values, you will find a time when you want to average at five minutes, using the one-minute averages. This will absolutely give you incorrect data because the original averaging was lossy!
If you think of the minute of data as a full dataset rather than an average, you will want to be able to visualize the impact of outliers (in fact, you might be more interested in the outliers). You can do this in multiple ways. First, you can visualize the minimum and maximum values over the average. You can also remove outliers by averaging a certain percentage of values in that minute, such as the fastest 99.9%, 99%, and 95%. If you overlay those three averages with the 100% average, as demonstrated in Figure 2-3, and a minimum/maximum, you get a very good feel for the outlier impacts.
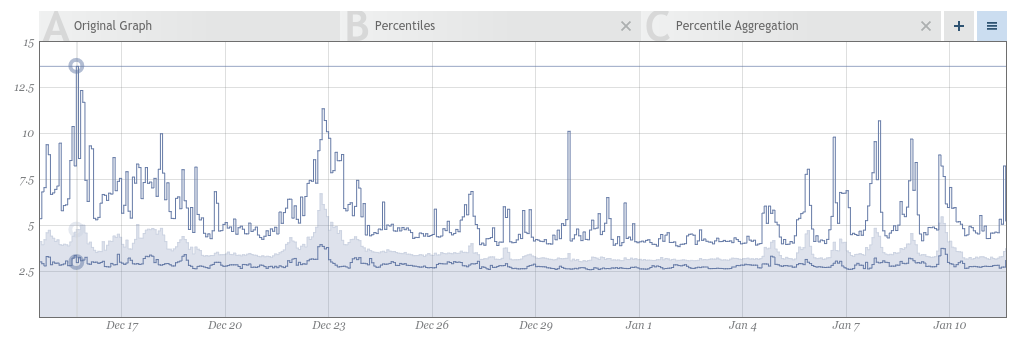
Figure 2-3. Latency average (100% sample size) overlaid with minimum and maximum
Now, with that segue, let’s think of our SLO regarding latency. If we are averaging every minute, no matter what our SLO is, we cannot prove we hit it because we are measuring averages only! Why don’t we make our objective more relevant to real life workloads? We can iterate on this SLO like this: latency over one minute must be between 25 and 100 ms for 99% of requests.
Why do we choose something like 99% instead of 100%? Latency distributions tend to be very multimodal. There are normal times, and there are edge cases, which are due to any number of possibilities in a complex distributed system, such as Java Virtual Machine (JVM) garbage collection, database flushing, cache invalidations, and more. So, we expect a certain percentage of outliers, and our goal in setting an SLO is to recognize the percentage of outliers we are willing to tolerate.
Now, let’s consider the workload. Are we talking about simple response such as you might see in an API? Or, are we measuring a page rendering, which is an aggregation of many calls that happen over a period of time. If we are measuring a page render, we might want to specify initial response as one requirement and final rendering as a second because there can be quite a period of time between them.
Availability Indicators
As mentioned earlier, availability is the amount of time, generally expressed as a percentage, that a service is able to respond to requests with system-defined responses. For instance, we might say that a system should be available 99.9% of the time. This can be expressed like this: service must be available 99.9% of the time.
This gives us about 526 minutes of downtime per year to work with. Almost 9 hours! A king’s feast of downtime. You might ask why we don’t just say 100%? If you are a product owner, or a salesperson, you probably will. It is generally accepted that the differences from 99%, to 99.9%, to 99.99% are each an order of magnitude more complex to manage, more expensive, and more distracting for engineers. Additionally, if this is an application that relies on delivery over the internet or large geographical distances, you can expect that the transport mediums will create their own disruptions, which would not allow you to utilize more than 99% to 99.9% of the uptime your system has.
That being said, there is a big difference between 526 one-minute outages in a year and one 526 minute outage. The shorter the downtime, the greater the chance that most users will not even notice the disruption. In contrast, an eight-hour outage for some services generates news articles, thousands of tweets, and erodes trust from users. It makes sense to consider two data points around your service. The first is Mean Time Between Failures (MBTF). Traditionally, avoidance of failure has been the priority, which means increasing MTBF. The second data point is Mean Time To Recover (MTTR). This is how long it takes to resume service after a failure has occurred. Shorter is better!
Resiliency versus robustness in availability
There has been much discussion over the past decade about building resilient systems that have three specific traits:
Low MTTR due to automated remediation to well-monitored failure scenarios.
Low impact during failures due to distributed and redundant environments.
The ability to treat failure as a normal scenario in the system, ensuring that automated and manual remediation is well documented, solidly engineered, practiced, and integrated into normal day-to-day operations.
Note that there is not a focus on eliminating failures. Systems without failures, although robust, become brittle and fragile. When failures occur, it is more likely that the teams responding will be unprepared, and this could dramatically increase the impact of the incident. Additionally, reliable but fragile systems can lead users to expect greater reliability than the SLO indicates and for which the service has been engineered. This means that even if an SLO has not been violated, customers might be quite upset when an outage does occur.
Armed with this knowledge, as you evaluate an SLO for availability, you should ask yourself some key questions:
Are there workarounds during downtime? Can you function in a degraded mode, such as read only? Can you use caches to provide data even if it is stale?
Is there a different tolerance for downtime if it is limited to a small percentage of users?
- What experience does a user have during downtimes of increasing lengths?
One failed request
30 seconds
One minute
Five minutes
An hour or more
After considering this, you might want to reevaluate the naive availability SLO by doing the following:
Defining the time interval
Defining a maximum incident duration
Defining a percentage of the user population affected before calling availability down
With that in mind, you can express the SLO as follows:
99.9% availability averaged over one week
No single incident greater than 10.08 minutes
Call for downtime if more than 5% of users are affected
Designing for downtime allowed
This new iteration allows us to engineer processes such as failovers, database locks, and restarts that can fit within the parameters provided. We can do rolling upgrades that affect fewer than one percent of users. We can lock tables to build indexes if it takes less than 10 minutes and no downtime has occurred that week. By designing for the downtime allowed, rather than trying to achieve zero downtime, we can be more efficient with our design and allow for some risks in the name of innovation and velocity.
It is worth noting that even in today’s world in which 99.9% uptime is considered ubiquitous, there are times when services truly can tolerate planned and managed downtime safely. Being willing to take four hours of downtime that is communicated, mitigated with read-only options, and broken up into smaller percentages of users can eliminate hours of carefully orchestrated migrations that introduce risk of data corruption, privacy issues, and more.
After considering this, you might want to reevaluate the availability SLO by adding planned downtime options to guide the operations team in their maintenance efforts.
Sample availability SLO, iteration 2:
99.9% availability averaged over one week
No single incident greater than 10.08 minutes
Downtime is called if more than 5% of users are affected
- One annual four-hour downtime allowed, if:
Communicated to usersat least two weeks ahead of time
Affects no more than 10% of users at a time
Throughput Indicators
Throughput, as a service-level indicator, should list a peak value that the service must be able to support while maintaining the latency and availability SLOs provided in conjunction with it. You might say, “Laine and Charity, why do we have it? Shouldn’t latency and availability be enough?” To which one of us would respond, “Intrepid Ops Scout, excellent question!” She would then puff thoughtfully on a pipe...
There might be times when there is a bottleneck that puts an upper boundary on throughput without necessarily tipping over performance or availability. Perhaps there is locking in your system that constrains you to 50 queries per second (qps). Those might be incredibly snappy and tight responses, but if you have 1,000 people waiting to run this query, you have a problem. Because there are times when you cannot measure end-to-end latency, throughput indicators can often be an extra layer of validation that a system is living up to the needs of the business.
Throughput can suffer from similar visibility issues as latency when it comes to using averages and less granular sampling, so please do keep this in mind while monitoring.
Cost/efficiency indicators
As you consider effective indicators for the cost of a system, the biggest variable is what you will use to reference cost against. This is really a business decision, but you should choose the action in the service that drives value. If you are a content provider such as an online magazine, pages being delivered is critical. If you are a Software as a Service (SaaS) provider, subscriptions to your service makes sense. For retailers, transaction counts will be appropriate.
Considerations
Why do you, as a database engineer, need to know this? You are managing one component of the service, so why must you concern yourself with the overall requirements? In the dark days of dysfunction, you might have been given a target for your datastore and graded based on your ability to maintain that. But, as part of a larger team, you have great opportunities to affect the service’s velocity and availability.
By knowing the holistic SLO, you can prioritize your own focus. If you have a latency SLO of 200 ms, you can assume that this 200 ms is being shared by the following:
DNS resolution
Load balancers
Redirection to an http server
Application code
Applications querying the database
TCP/IP transport times across oceans and worlds
Retrieval from memory, both solid-state devices (SSD) and spinning disks
So, if your datastores are doing well and contributing minimally, you know to focus elsewhere. On the other hand, if you see that the SLO is at risk and you see low-hanging fruit, you can devote some time in your sprint to plucking that ripe, delicious performance fruit.
While assembling an SLO for your new and exciting service, there are some additional things to consider:
- Don’t go overboard
We’re metrics hoarders, and we understand the urge. But please try to keep your list simple and concise enough that the SLO status can be reviewed on a single page dashboard.
- Stay user-centric
Think about what your users would find critical and build from there. Remember that most application services focus on latency, throughput, and availability, whereas storage services add data durability to this list.
- Defining SLOs is an iterative process
If you have an SLO review process, you can modify and add on to this over time. While you are in early stages, you might not need to be as aggressive with SLOs. This will allow your engineers to focus on features and improvements.
Use your SLOs to determine how you want to design your services, processes, and infrastructure.
Monitoring and Reporting on SLOs
Now that you have well-defined SLOs, it is critical to monitor how you are doing in real-life in comparison to your ideal objectives. We have not gone into operational visibility in this book yet, but there are crucial things to discuss before moving on to the next topic.
Our top goal in monitoring for service-level management is to preemptively identify and remediate any potential impacts that could cause us to miss our SLOs. In other words, we don’t want to ever have to rely on monitoring to tell us that we are currently in violation. Think of it like canoeing. We don’t want to know rapids are present after we are in them. We want to know what is happening that could indicate rapids there are downstream while we are still in calm waters. We then want to be able to take appropriate action to ensure that we stay within the SLOs to which we have committed ourselves and our systems.
When monitoring, we will always rely on automated collecting and analysis of metrics. This analysis will then be fed into automated decision-making software for remediation, for alerting of human operators (aka, you), or for ticket creation for later work. Additionally, you will want to visualize this data for real-time analysis by humans, and potentially you will want to create a dashboard for a high-level view of current state. We’ll want to consider all three of these scenarios when we discuss the various indicators we will be monitoring.
In other words, suppose that you have 10.08 minutes of downtime for the week, and by Tuesday, you’ve had three minutes of downtime over three days due to “Stop the World” Cassandra Garbage Collection events and one minute from a load balancer failover. You’ve used up 40% of the SLO already, and you still have four days left to go. Now is the time to tune that garbage collection! By having an alert after a certain threshold (i.e., 30%) create an email in the ticketing system, the database reliability engineer (DBRE) can jump right on this issue.
Monitoring Availability
Let’s use the availability SLO that we defined in the previous section. How do we monitor for this? We will need to monitor system availability as well as user-level errors to get an appropriate picture. As a reminder, our current sample availability SLO is as follows:
99.9% availability averaged over one week
No single incident greater than 10.08 minutes
Downtime is called if more than 5% of users are affected
- One annual four-hour downtime allowed, if:
Communicated to users at least two weeks ahead of time
Affects no more than 10% of users at a time
Traditionally, Ops staff would tend to focus on fairly low-level monitoring to inform them whether a system was available. For instance, they might measure to see whether a host was up, whether it was reachable, and whether the expected services that were hosted by that system were running and connectable. In a distributed system, this rapidly proves to be unsustainable and not a good predictor of service availability. If we have 1,000 JVMs, 20 database instances, and 50 web servers in place, how can we learn if any one of these components is affecting the service and to what degree that impact exists?
With this in mind, the first thing we want to focus on is error rates from user requests. This is also known as Real User Monitoring (RUM). For instance, when a user submits an HTTP call from her browser, does she receive a well-formed response from the service? If your service is popular, this can potentially be a lot of data. Consider a major global news event that is generating in excess of 70,000 hits per second on a web service. Any modern CPU can calculate errors rates for this amount of data fairly efficiently. This data is logged from the application (such as Apache HTTP) to a logging daemon (such as a Linux syslog).
At this point, the way in which a system would get the data from these logs into appropriate tools for monitoring and analysis varies wildly. We’re going to gloss over this for now and assume that we’ve stored the success/error rates of the service to a production datastore without any aggregation or averaging at the base level. We discussed this in the previous section, but it is worth repeating that storing averages alone loses the valuable data.
With our data stored, it is relatively trivial to evaluate whether one percent or more of our calls failed, and if so, mark that second as downtime. This regular tally of downtime can be summed and compared to our budget of 604.8 seconds for the week and reported in a dashboard that is displayed in browsers, on monitors in a network operations center or office, or any other number of places to help all stakeholders see how the team is performing.
Ideally, we want to be able to use this data to predict whether the current downtime amounts will lead to violation of the budget by the end of the week. The largest challenge in most environments is workload shifts due to product development. In a system for which releases are happening weekly, and sometimes daily, any previous datasets become relatively useless. This is particularly true of the older datasets compared to the ones in the recent past. This is called a decaying function.
Exploring predictive data science is beyond the scope of this book. But, there are numerous approaches that you can take here to predict whether you will violate your SLO in the current week or potentially in future weeks. It is worthwhile to take the previous N weeks’ value (N could be larger in stable environments or as small as one in continuous deployment models of downtimes) and see how many SLO violations occurred during those periods for which downtime was equal to or less than the current period.
For instance, your script might take the current downtime, which could be 10 seconds for the week, and the current time in the week in seconds. That downtime could be defined as a downtime of 10 seconds and a time of 369,126 seconds into the week.
You would then evaluate the previous 13 weeks, and for each week for which downtime was 10 seconds or less at the same point in the week (between 1 and 369,126 seconds), evaluate whether an SLO violation occurred that week. You would then give a weight based on the nearness of the previous period. For instance, in 13 weeks, the previous week is assigned 13 points, the one before it, 12, and so on. Adding up the weights for weeks for which the SLO violations occurred, you might issue a high-priority ticket to your Ops team and notify them in chat if the combined values are 13 or above. This is just one example of a way to ensure that you have some level of data-driven monitoring in place if you do not have a crack team of data scientists with the time and inclination to review service-level data. The goals here are to get proactive eyes on a potential problem before it is an emergency, which means fewer pages to humans and fewer availability impacts.
In addition to real user monitoring, it is useful to create a second data-set of artificial tests. This is called synthetic monitoring. Just because these are artificial, does not mean that they are not identical in activity to a real user. For instance, a transactional email company might trigger email requests from QA accounts just as any other customer would do.
The case for synthetic monitoring is to provide coverage that is consistent and thorough. Users might come from different regions and be active at different times. This can cause blind spots if we are not monitoring all possible regions and code paths into our service. With synthetic monitoring, we are able to identify areas where availability or latency is proving to be unstable or degraded, and prepare or mitigate appropriately. Examples of such preparation/mitigation include adding extra capacity, performance tuning queries, or even moving traffic away from unstable regions.
With synthetic and RUM, you can identify when availability is affected and even predict when you might have an SLO violation. But, this does not help us when it comes to larger impacts due to system failures or capacity limitations. One of the key reasons to implement robust monitoring is to capture enough data to predict failures and overloads before they occur.
Monitoring Latency
Monitoring latency is quite similar to monitoring for errors in requests. Although availability is Boolean, latency is a value of time that we must measure to validate whether it fits within the constraints given in our SLO.
Latency SLO
Ninety-nine percent request latency over one minute must be between 25 and 100 ms.
As with our error telemetry, we assume that our HTTP request logs have gone through syslog and into a time–series datastore. With that in place, we can take an interval of time, order all data points by latency, and eliminate the top one percent of requests. In this case, we are averaging values in each one-second time window. If any of the remaining 99% of calls are longer than 100 ms, we have a violation that counts toward downtime.
This kind of data can also lend itself to predictive analytics via any multitude of tools or scripts. By measuring previous latencies during similar time or traffic patterns, you can look for anomalies that indicate a climbing response time that could lead to an SLO violation.
Monitoring Throughput
Throughput is easy to assess with the data we’ve assembled and reviewed for availability and latency SLOs. If you are storing every record, you will be able to measure transactions per second quite easily. If you are exceeding the minimum transaction count in your SLO, you are good. If you are not generating enough traffic to exceed your SLO, you will need to rely on periodic load tests to ensure that your system can support the demands of the SLO. Load testing is covered in more detail later.
Monitoring Cost and Efficiency
Cost and efficiency can be a challenging SLO to monitor because there are some costs that are not as quantifiable as others. You must consider the overall cost for a window of time. If you are working in a cloud environment, for which resources are billed like utilities, you can fairly easily quantify costs for resources such as storage, processing, memory, and interinstance bandwidth. If you are using your own bare metal, you will need to get hardware costs for all machines dedicated to the services, estimating when shared resources are in play. Often, the period of time for the cost is not very granular, however, so it can prove challenging to understand costs for specific periods of time, such as by hour, if you are getting monthly reports from the provider.
For fixed-cost items such as instances and storage, you can keep an uploaded cost matrix from your provider or from your own internal databases. This data can be referenced as resources are deployed and decommissioned, creating an estimated spend. For usage costs such as bandwidth, IOPS, and similar items, you can reference other gathered metrics on a scheduled interval to also estimate costs.
You also need to consider the costs of staff who are maintaining the service. This can include operations, database and network engineers, anyone on-call, and coordinating project managers. These can be shared resources, and again, you will find yourself estimating percentage of time devoted to the specific service you are monitoring. If you are in an environment in which time tracking is in use, you can potentially reference that data to build a somewhat real-time human spend metric. Otherwise, you will need to estimate on a regular basis, taking into account factors such as terminations, new hires, and team changes.
This is manual work, and some of it we can not automate easily, but nonetheless it provides incredibly valuable data in terms of the cost of operating services. Comparing this to the value being generated by services gives reliability engineers a target for efficiency improvements.
Wrapping Up
Service-level management is the cornerstone of infrastructure design and operations. We cannot emphasize enough that all actions must be a result of planning to avoid violations of our SLOs. The SLOs create the rules of the game that we are playing. We use the SLOs to decide what risks we can take, what architectural choices to make, and how to design the processes needed to support those architectures.
Having completed this chapter, you should now understand the core concepts of service-level management, including SLAs, SLOs, and SLIs. You should know the common indicators that are used, including availability, latency, durability, and efficiency. You should also understand the approaches to monitoring these indicators effectively to catch problems before your SLOs are violated. This should give you a good foundation to effectively communicate what is expected of the services you manage and to contribute to meeting those goals.
In Chapter 3, we cover risk management. This is where we begin to evaluate what might affect the service-levels we’ve committed to meeting. Using these service-level requirements and recognizing the potential risks, we can effectively design services and processes to ensure that we fulfill the promises we’ve made to the business.