Performance Measurement and Metrics—Enabling Transparency, Visibility, and Sustainability
In God we trust; all others bring data.
—W. Edward Deming
Firms are now holding entire supply chains are accountable for new performance metrics. Performance measurement and metrics are changing; consider the following:
- Walmart announced a goal to eliminate 20 million metric tons of GHG emissions from its global supply chain by the end of 2015. This represents one-and-a-half times the company’s estimated global carbon footprint growth for five years and is the equivalent of taking more than 3.8 million cars off the road for a year. The footprint of Walmart’s global supply chain is many times larger than its operational footprint and represents a more impactful opportunity to reduce emissions.
- There is a Social Cost of Carbon that can be used to assess the impacts of GHG emissions and it has been in use for years.1
- Puma released the world’s first EP&L statement uncovering 145M EUR of environmental impacts. Only 8M EUR were attributed to Puma’s own operations, the remaining 94 percent were within their tier-1 through tier-4 supply chain. The company says future developments for the EP&L initiative include expanding the accounting methodology to include the social value created by the firm.
The growing complexity and changing landscape of sustainability are causing many to wait to see what metrics and standards will become accepted by the leading firms within an industry. Because these firms don’t know what they will be measured and graded on, they don’t know where to invest—so they wait. Those same organizations choosing to wait will inevitably have to catch up to proactive firms. For those willing to measure now (rather than waiting), numerous hidden opportunities await to better understand processes, align entire supply chains, and differentiate products and firms. Innovative firms are already taking a strategic stance on how they want to measure and manage sustainability opportunities. These same early adopting firms provide insight that others can learn from and improve on. To help support this process, there are many metrics to help the next wave of adopting firms.
Objectives
- Understanding the basics of performance measurement, including benchmarking, and how and where to integrate sustainability.
- Review performance metric architecture including functions and types of metrics.
- Review proactive versus outcome-based metrics.
Introduction
“One of the most powerful management disciplines, the one that keeps people focused and pulling in the same direction, is to make an organization’s purposes tangible. Managers do this by translating the organization’s mission—what it, particularly, exists to do—into a set of goals and performance measures that make success concrete for everyone. This is the real bottom line for every organization—whether it’s a manufacturer or a service provider. Its executives must answer the question, ‘Given our mission, how is our performance going to be defined?’”2
Someone who has a lot to say about performance measurement, sustainability, and corporate performance (and whose views are in line with the quote that began this chapter) is Bob Willard. A review of Bob Willard’s most recent work uncovers very tangible performance improvements of innovative firms aligning mission and sustainability performance metrics. Based on years of working with an array of companies, Willard suggests that if a typical company were to use best-practice sustainability approaches already used by real companies, it could improve its profit by at least 51 percent to 81 percent within three to five years, while avoiding a potential 16 percent to 36 percent erosion of profits if it did nothing.3 This business case is organized around seven bottom-line benefits that align with current evidence regarding the most significant sustainability-related contributors to profit. For example, a large manufacturer can:
- Increase revenue by 9 percent.
- Reduce energy expenses by 75 percent.
- Reduce waste expenses by 20 percent.
- Reduce materials and water expenses by 10 percent.
- Increase employee productivity by 2 percent.
- Reduce hiring and attrition expenses by 25 percent.
- Reduce strategic and operational risks by 36 percent.
Given the evidence of improved performance, many managers are both excited and cautious as to where they should start and what should be measured. First things first, we must recognize that the lack of a widely accepted definition of sustainable supply chain management (SSCM) and the complexity of overlapping supply chains make the selection and use of metrics both difficult and increasingly important for strategic alignment. What is needed (and often overlooked) is a process that links the strategic imperative of sustainability to performance measurement and management and then ultimately to corporate performance. This process must ensure that there is alignment (consistency) between the various components so that what is done at one level is consistent with and supportive of the actions carried out at the other levels. A good starting point is understanding how you and your organization define sustainability.
Most firms start with the Brundtland definition of “meeting the needs of a current generation without compromising the needs of future generations to meet their own needs,” and then add to this, customizing the meaning and keywords so that it aligns with their business model and a triple bottom line. This broad definition is a starting place, but does not provide the necessary insight regarding how to measure and integrate sustainability within your company.
To better define what is important while also aligning mission and metrics, Bill Blackburn4 suggests developing a model sustainability policy. This process starts with a statement combining the Brundtland definition with an integrated bottom line5 and then adding a breakout of topics important to your firm. For example, a company commitment to sustainability could start with the vision: “It is in the interest of our company and society as a whole that our company moves along the path to sustainability. To that end, we will strive to achieve the following vision of performance.” Anyone can customize this further to have three additional subareas of the vision covering financial capital, natural capital, and social capital. Within each of these areas, ask yourself the questions below:
- Do our business activities promote sustainable economic health for the company and global community?
- Do we conduct our business in a manner that contributes to the well-being of our employees and the global community?
- Do we manage our operations in a way that is protective of the environment to ensure the earth can sustain future generations and the company’s ability to meet future needs?
By answering these questions and then looking for behaviors that support each of the three areas of the vision, you can further develop a customized sustainability policy to help guide behavior and measurement6. Operationalizing sustainability is a starting point for signaling what is important and how you will design performance metrics that influence behavior. Here is a sustainability policy created by one of the top ranked MBA sustainability programs globally, by students at Duquesne University:
Our vision of sustainable performance includes researching and developing business opportunities that are economically, environmentally, and socially beneficial.
- The program’s economic success will depend on brand strength, community prosperity, and return on investment.
- Our social responsibility includes action-learning, working with corporations on the business case for sustainability, collaboration with communities, respect for stakeholders, systems thinking across disciplines, and an ethical approach to decision making.
- Environmental responsibilities include resource conservation, reduction of supply chain impacts, systems thinking, recycling, closed loop systems, the pursuit of energy efficiency and renewable energy sources.
Corporate examples can be seen within FedEx’s global citizens’ report7 and themes highlighting “delivering what tomorrow requires today,” with goals to connect the world in responsible and resourceful ways, tracking progress in economics and access, environment and efficiency, community and disaster relief, people and the workplace. Others, such as UPS, are vague as to how sustainability is defined, instead stating their mission as “increase the efficiency and reduce the environmental impact of global commerce by combining the shipping activities of customers into a single, highly efficient logistics network.” UPS translates this expertise into convenient services with a wide range of price points and delivery speeds, including options tailored to specific industries and expansion of carbon-neutral services to 36 countries.8
The vignettes at the start of this chapter and the FedEx and UPS examples highlight a few important trends. First, manufacturers and logistics providers alike are innovating practices and processes to meet the changing needs of their key customers and a diverse set of stakeholders. Sustainability policies are a starting point for signaling intentions with metrics signal what is important and what is not. This signaling is both within the firm, its supply chain and to the market as a whole. We also find firms taking on the sustainability challenge are already experiencing gains in financial, natural, AND social capital, the foundations of sustainability. Firms are doing this while generating sustainable value added and strategic competitive advantage.
In this chapter, we propose that single-firm metrics overlook the opportunity to measure and plan for multifirm measures that are necessary to understand performance of a supply chain. Example metrics include energy consumption, GHG emissions, and what is becoming a de facto measure within firms and across supply chains—CO2. Next, we review a performance measurement architecture (Figure 5.1) and present evidence of the growth of sustainability performance metrics. We then go on to identify trends that will remain important to supply chain managers, and highlight the importance and differences of visibility and transparency now exposed within supply chains.
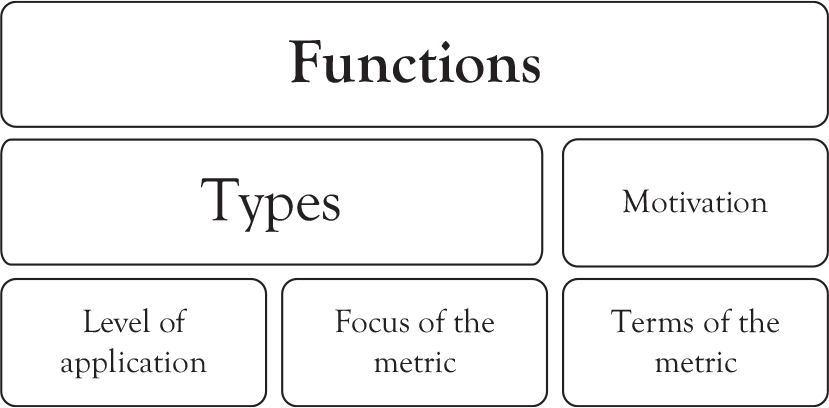
Figure 5.1 The performance metric architecture
Managers pursue multiple types of operations and supply chain metrics at different levels as a means to increase their visibility over aspects of the supply chain they do not control, yet know will have impact on their own company’s performance. Leveraging the Chapter 4 business model to align key customers, capabilities, and the value proposition provides any company an opportunity for process improvement. This improvement will rely upon applying metrics that enable management to identify opportunities for improved profitability AND align sustainability objectives. The goal is to identify opportunities within an organization and across firms in a supply chain. We start with an understanding of the functions of performance measurement before transitioning to different types of metrics.
A metric is a verifiable measure assessed in both quantitative or qualitative terms and defined with respect to a reference point. This definition identifies several attributes of metrics.
- Metrics involve measures that capture data in numerical/quantitative form.
- Metrics are verifiable. Underlying the metric there should be a well-understood, documented process for converting data into the measure.
- Metrics require a reference point, otherwise known as a standard, providing a basis of comparison. Reference points are derived from previous performance, a computed or observed standard, or some ideal value (e.g., optimum value of performance).
- Metrics allow and encourage comparisons across processes, groups, time periods, and operating conditions.
Metrics exist because of, and to enable, people. They provide a language by which we can communicate specific information regarding the state or outcomes of a process. To understand their importance, consider the following functions provided by metrics:
- Communication. This is the most commonly identified function of metrics. Metrics report expectations and performance to process stakeholders (e.g., workers, managers, external agencies such as the Global Reporting Initiative (GRI) or Carbon Disclosure Project (CDP), and stockholders). Also, the selection of a given set of metrics communicates their importance to stakeholders. According to KPMG, Corporate Responsibility reporting has become the de facto law of business. Survey results show 95 percent of the Global 250 report corporate responsibility activities. What are you reporting/communicating?
- Control. Metrics enable managers to control and evaluate the performance of the people, processes, and business units. They also enable employees to control their own equipment and their own performance.
- Expectations. Metrics influence customers’ expectations. For example, if we say that we will eliminate 20 million metric tons of GHGs by 2020, we have formed both an expectation and a metric (i.e., did we meet the amount propose by the deadline of 2020?).
- Learning and Improvement. Metrics identify gaps between outcomes and expectations. Learning occurs when workers try to understand the causes of and remedies for these gaps.
- Transparency. Corporate reporting of transparency involves “the set of information items that relate to a firm’s past, current and future environmental and social management activities and performance … [and their] financial implications.”9 Transparency is measured, managed, and reported by a firm and thus, the firm can control the message associated with its activities. Transparency is often revealed externally through corporate sustainability reports while following the GRI guidelines, and includes the submission of information to the CDP. Other innovative forms or transparency, enabled by technology, are helping firms to differentiate sustainability strategies. See, for example, trends in corporate responsibility reporting and the Dole Farm Locator Program.
Within the organic agriculture and food industry, Dole’s Organic Farm Locator Program allows consumers to see where their food comes from and the farm and farmer who grew the fruit. With the help of a smartphone or your computer, you can now see Dole’s supply chains with more transparency than ever before.

Figure 5.2 Dole organic program farm #776
By utilizing the Dole Organic Farm Locator, you can find the Don Pedro farm in La Guajira, Colombia. Consumers can see this banana farm has been certified since 2005, find photos of the farm, and certification Control Union Certification information from USDA—NOP Organic, ECC 834/2007 Organic, and GlobalGAP. Dole controls information and chain of custody communication to consumers knowing that organic credentials are important while providing access to all current and historical organic farm certifications. This emerging form of transparency facilitates communication, sets expectations, and provides opportunities for consumers to learn more about the product and its supply chain. Consumers are now connected to supply chains and are more willing to be part of the value generation process.
- Visibility. Supply chain visibility is the ability of parts, components, or products in transit to be tracked from the manufacturer to their final destination. The goal of visibility is to improve and strengthen the supply chain by making data readily available to all stakeholders, including the customer. Supply chain visibility technology promotes quick response to change by allowing privileged users to take action and reshape demand or redirect supply. To take this a step further, organizations such as the United Nations Global Compact (UN GC) have a task force of industry partners to help identify common challenges of and solutions to tracing product and raw materials through complex global supply chains. This traceability is part of the UNGC’s current supply chain sustainability efforts.
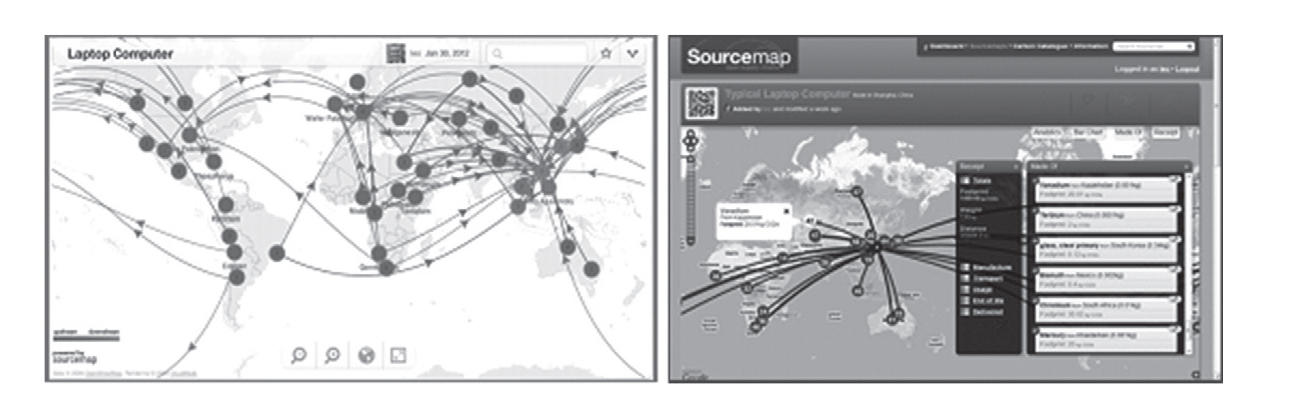
Figure 5.3 Sourcemap.com LCA laptop maps
Source: Reproduced with permission from Sourcemap.com. Both maps added by Leo.10
With the ever-increasing amount of data available through tools such as life cycle assessment (LCA), new mapping technologies now provide more visibility into supply chains. Take for example, Sourcemap.com. This freeware site allows users to post LCA maps of products. Right now, you and anyone else can go to this website and see where a laptop comes from. A drill down into the LCA information can now tell customers or consumers what materials the product is made of, where these materials come from, and the amount of waste, for example, GHG emissions and CO2 associated with manufacturing, transportation, use, and disposal or recycling of the product.
Managers can now use mapping and LCA information to identify the different entities and upstream and downstream linkages comprising the supply chain and value chain. In the example above, vanadium sourced from Kazakhstan contains 21.01 kg CO2 with other sources of materials highlighted consisting of terbium, glass, bismuth, chromium, and mercury. A further breakdown of this information reveals summaries of CO2 contributions from manufacture, transport, usage, end of life, and the delivered product. After the initial focus on which supply chain members are delivering, attention can turn to waste elimination and managing metrics with the greatest potential for increasing competitive advantage in terms of leveraging supply chain efficiency, product stewardship, innovation, and profitability.
Metrics play the critical role of translating an organization’s strategy and business model into reality. They restate corporate objectives that are often broadly stated (e.g., reduce the impact of global commerce or increase market share) into actions that a person working in a given function (e.g., procurement) can understand. For instance, suppose a manufacturer wants to implement a strategy based on differentiating products due to environmental attributes. One way to better define this goal for procurement is to measure the percentage of suppliers with third-party verification for their sustainability-related practices and product attributes. In addition, the supplier’s ability to share information that now includes attributes of sustainability will reduce the risk of supply chain disruption. In this way, metrics serve to define value and strategy in a business process. You can often get a better sense of a firm’s value proposition by studying its metrics than you can be studying the corporate mission statement. Metrics and mission (the basis of the corporate value proposition) should be tightly linked to each other. As the adage goes, you are what you measure. Supply chains provide a dynamic opportunity to better understand how we can leverage metrics within a systems-thinking mindset to enable sustainability. Metrics serve as strong proponents or strong impediments to value creation. Many managers believe metrics are used only for control. In reality, metrics are used for communication and to report outcomes and, in doing so, they also motivate action. When the elements of product value (cost, quality, and timeliness) are identified, quantified, and stated in the form of meaningful metrics, then they become a powerful force for aligning organizational priorities, actions, and behaviors with strategic and value goals. If developed and implemented correctly, metrics form a critical link between value as it is strategically defined and the actions of various processes and people working within the operations management system. Metrics help to ensure that activities are consistent with what the firm wants to achieve in terms of value and how various employees will act.
Types of Metrics
Metrics are pervasive throughout different organizational levels and departments within a firm or supply chain. We will focus our attention on the different types of metrics found in most operations management systems (Table 5.1). These metrics can be categorized in four basic ways:
- Level of application: for what organizational levels are the metrics intended?
- Focus of the metrics: are the metrics oriented toward efficiency or effectiveness?
- Terms of the metrics: are the metrics stated in financial or operational terms?
- Motivation for the metrics: are the metrics used in predictive or outcome-oriented manner?
Table 5.1 Levels of Metrics11
| Level | Examples | Orientation |
Multifirm |
Sustainable value added (SVA), economic value added (EVA),12 risk of supply chain disruption, cradle-to-grave life cycle assessment (LCA), corporate ecosystem valuation (CEV),13 shared value, Scope 3 GHG, normalized CO2, Carbon Disclosure Project (CDP) supply chain member |
Broad-based, strategic (long term) understanding of contribution from suppliers, own operations, to customers and end users; value, impact, and waste created in the system, includes traditionally overlooked externalities |
Corporate or Business Unit |
Sales, growth of sales, market share, stock prices, credit rating, performance on key strategic activities (e.g., on-time arrival and departure for Southwest Airlines), high-performance buildings (Leadership in Energy and Environmental Design [LEED], or Energy Star), Scope 1 & 2 GHG, environmental profit & loss statement, included in Dow Jones Sustainability Index, FTSE 4 Good |
Broad-based, strategic (long term), aggregate units, many financial, includes recognition by external organizations |
Product |
Market share, contribution margin,14 functionality, quality or reputation, repeat purchases, cost per unit (as compared to the budgeted cost), recommendations (by critical groups such as Consumer Reports®, or Good Guide), inventory level, % recycled content, free of xxx (where xxx could be an element such as BPA), Energy Star, qualifies for Green Seal or Ecologo, Design for Sustainability, environmental product declaration (EPD), C2C certification |
Broad-based, cross-functional, measure that can be measured at one location or across locations. Can be strategically oriented (e.g., market share, reputation, externally verified product attributes or labels, recyclability) or operational (e.g., inventory or design) |
Process |
On-time delivery rate, number of units produced, lead time, zero waste, carbon neutral, water neutral, Scope 1 GHG emissions, 100% renewable energy |
More focused, tactically oriented, stated in terms appropriate and meaningful to the function or group |
Individual/Activity |
Utilization, downtime, number of units produced per period; energy, water, or emissions per standard unit of production |
Very focused, operational, emphasis on performance improvement, and normalized to unit of production |
Level of Application
Generally, metrics can be applied at different levels or units of analysis.
The set of metrics used by top management should be different from the set of metrics used by frontline workers. In some cases, however, the same metrics are applied at multiple levels. Metrics applied at higher organizational levels are often aggregates of metrics at lower levels.
Focus of Metrics: Effectiveness vs. Efficiency
Effectiveness-based metrics measure performance on dimensions that are of greatest interest to targeted customers. These metrics answer the critical question “What do I have to do well for the critical customer (and ultimately for the firm) to succeed?” Effectiveness-based metrics link customers, strategy, and activities together. In contrast, efficiency-based metrics focus more on resource utilization and costs. These measures are often formulated independent of customer considerations. Efficiency-based metrics answer the question “How well or efficiently did I or my department do this task?” Both effectiveness and efficiency metrics are needed in operations and supply chain management. However, truly value-driven operations tend to elevate the importance of effectiveness metrics over efficiency metrics.
Metrics Stated in Financial or Operational Terms
The metrics that management typically refers to as supply chain performance focus on attributes of transportation such as lead time, fill rate, or on-time delivery. Metrics are usually reported either in financial terms (e.g., return on investment, profitability, other monetary measures) or operational terms (e.g., lead times, units of inventory, number of defects).
Financial measures do not provide insight regarding how well business processes have performed, how effectively the supply chain has met the needs of critical customers, or how much waste can be attributed to supply chain processes. As was pointed out by Willard earlier in this chapter, sustainability leads to financial gains through increased productivity and revenue, while also decreasing energy, materials, attrition, risk, and waste.
Waste is anything that does not add value to a product or service, such as, GHGs. Sustainability performance metrics such as GHGs are an opportunity for firms to realize a new level of waste measurement and associated costs as visibility increases within a supply chain. There are now new tools and standards enabling an understanding of where opportunities exist to decrease waste, while increasing competitiveness, customer value, and shareholder value15 for firms across a supply chain. Knowing this, supply chain managers are measuring performance outside the firm, evaluating tier-1 through tier-4 suppliers, responding to stakeholders, and relying on third-party providers to help in this process.
Operational metrics are most useful to those people involved in carrying out a specific task or activity being measured, because operational metrics can be clearly linked to the sources of performance in the process. In contrast, financial metrics are most useful for people who evaluate and compare processes (e.g., managers, investors). By putting things in monetary terms, financial metrics allow “apple-to-apple” comparisons.
New operational metrics include but are not limited to water use, GHG emissions, land use, air pollution, and waste. The use of these new metrics helped to form the first EP&L statement by Puma.
Puma is a sport-lifestyle company that designs and develops footwear, apparel, and accessories. Phase I of this three-phase process resulted in Puma uncovering and valuing environmental impacts in excess of 145 M Euro (Table 5.2). This level of analysis included tier-1 through tier-4 suppliers and revealed that 94 percent of environmental impacts resulted from suppliers and not Puma’s direct operations. Here we see new operational terms used to help link processes and performance while new trends toward integrated financial and sustainability reporting reveal efforts to measure environmental impacts and social value of a firm.
Table 5.2 Puma EP&L Statement (Phase I)
| The environmental profit and loss | |||||||
| EUR million | Water use | GHGs | Land use | Other air pollution | Waste | Total | % of total |
|
33% |
33% |
25% |
7% |
2% |
100% |
|
Total |
47 |
47 |
37 |
11 |
3 |
145 |
100% |
PUMA operations |
<1 |
7 |
<1 |
1 |
<1 |
8 |
6% |
Tier 1 |
1 |
9 |
<1 |
1 |
2 |
13 |
9% |
Tier 2 |
4 |
7 |
<1 |
2 |
1 |
14 |
9% |
Tier 3 |
17 |
7 |
<1 |
3 |
<1 |
27 |
19% |
Tier 4 |
25 |
17 |
37 |
4 |
<1 |
83 |
57% |
Source: Puma EP&L Press Kit1416
Motivation: Predictive and Outcome Metrics
Metrics can be used both to judge outcome performance and to predict future performance. An outcome metric supports evaluations of individuals and processes as a basis for rewards or for determining where attention is needed. For example, a manager’s bonus might be tied to performance on a given set of metrics. In contrast, a predictive metric is aimed at increasing the chances of achieving a certain objective or goal in the future. Predictive metrics are associated with aspects of the process that are thought to affect the outcomes of interest. If our interest is in reducing lead time, then we might look at leading indicators of lead time such as the distance required to be traveled by an order, the current level of utilization in a process, and so on. If new supply chain initiatives involve increasing social and natural capital, then firms should put in place communication and training programs to leverage existing certifications, collaboration with NGOs, and use of a broad array of key performance indicators. Predictive metrics are appropriate when the interest is in preventing the occurrence of problems, rather than correcting them.
In many systems, the bulk of metrics are outcome oriented, rather than predictive (Table 5.3). For example, they measure on-time delivery of products rather than looking measures that might predict on-time performance (e.g., inventory accuracy, setup time, and total lead time for a specific operation). As a result, the metrics system gives the managers little information that suggests means for improvement. More and more, firms are turning their attention to the development of predictive metrics. They recognize that such measures are far more useful. Some commonly used operational metrics include those in Table 5.3 above.
Table 5.3 Examples of Predictive and Outcome Metrics
| Performance category | Outcome metrics | Predictive metrics |
Lead times |
Total order to delivery lead time |
Bottleneck cycle time Setup time Throughput time for longest process Number of steps in a process Distance in a process Inventory in the system |
Flexibility |
Number of product variants Percentage of products that are made to order |
Number of different job classes (fewer is better) Number of levels in the typical bill of material Setup time Percentage of cross-trained employees Percentage of parts/components that are common across product line |
Quality |
Parts-per-million defective (PPM) |
Number of certified suppliers Process capability (Cp, Cpk) |
Cost |
Unit cost variance (between standard and actual) Direct labor cost variances Direct material cost variances Overhead costs variances |
Costs to date Number of steps in the process Distance traveled by the order Number of changes processed Throughput time |
Morale and Teamwork |
Number of labor disputes Grievances filed Number of employee-requested terminations Level of absenteeism |
Number of suggestions per employee Amount of training/education time/employee Number of skills/person |
Social capital |
Number of minority-owned suppliers No child labor Unhealthy work environment Executive and board diversity Nonrepresentation of women Transparency concern Corporate sustainability report Shared value |
Level of diversity training Socially responsible supplier audits SA 8000 certification ISO 26000 certification Availability of OSHA training Diversity hiring and promotion practices Women and minorities have at least four seats on the board and >5% of subcontracting Measure wide range of social and environmental performance metrics17 Collaborate with NGOs (GRI, WBCSD,) |
Natural Capital |
Environmental fines (dollars) Pounds of pollution produced Percentage of waste recycled or reused TRI reporting Transport impacts of product and workforce Nonmonetary compliance sanctions Scope 1–3 GHG emissions CEV |
Process yield ISO 14000 & 50000 certifications Energy Star certifications Inventory of toxic materials on premises Percentage employees trained to handle toxic materials Floor space devoted to storage, processing, or disposal of toxic materials Investment in more efficient equipment Measure wide range of indicators, including materials, energy, water, biodiversity, and LCA of product and transportation |
Measurement is the first step that leads to control and eventually to improvement. If you can’t measure something, you can’t understand it. If you can’t understand it, you can’t control it. If you can’t control it, you can’t improve it.
H. James Harrington
What is the difference between predictive and outcome-based metrics? Experience (outcome-based metrics) is enlightening. It enables you to recognize a mistake when you make it again, and again, and again. Predictive metrics enable you to recognize a potential mistake before you make it. The use of predictive metrics is paramount to ensure successful integration of sustainability into any firm.
Summary
We wanted to prominently place metrics within this book to emphasize what operations and supply chain systems should be considered for measuring. This helps to avoid organizations institutionalizing only what they are good at. Instead, SSCM provides an opportunity for a metrics evolution for some and a metrics revolution for others in changing the way management plans for and delivers process performance. Metrics are communication! They must emphasize the mission of the organization and in doing so become a critical element within an organization as they make programs and processes concrete. Mission and metrics define everything we need to know.
This chapter started by highlighting vignettes of a changing performance metrics landscape. Next, best practice highlights showed significant improvements in revenue, energy, waste, water, and materials expenses, along with improvements in employee productivity, attrition, and strategic as well as operational risks. With improved performance as a goal, information then followed discussing the functions, types, motivation, focus, and level of application of metrics. Within this context, trends regarding transparency and visibility showed more measurement and disclosure than at any time in prior history. This trend will only grow over time. To help align mission, metrics, and motivation, we focused on the use of predictive metrics to proactively avoid outcome-driven problems and create cost savings, knowing that cost avoidance and revenue generation would allow firms to leapfrog others in their industry. After reviewing applicable models, protocols, and standards, any organization can take a deep dive into performance measurement while keeping in mind outcome verses predictive metrics to customize an organization’s sustainability assessment. There is room for improvement for any organization as supply chains integrate sustainability and this metric evolution to innovate, reduce waste, and maximize sustainable value.
Applied Learning: Action Items (AIs)—Steps you can take to apply the learning from this chapter
AI: Run your business as if you did have to pay for carbon emissions, how would this change your approach to decision making, management, and supply chain integration?
AI: How many and what types of performance metrics do you use?
AI: How do you currently establish performance goals? Will this process be any different for natural or social capital?
AI: Identify sustainability performance metrics that will align with your existing mission.
AI: What predictive versus outcome metrics do you currently utilize?
Further Readings
Blackburn, W. R. (2016). The Sustainability Handbook. Environmental Law Institute.
Busch, T., & Shrivastava, P. (2011). The Global Carbon Crisis. Bradford, United Kingdom: Greenleaf Publishing.
Eccles, R. G., & Krzus, M. P. (2010). One Report-Integrated Reporting for a Sustainable Strategy. Hoboken, N.J.: Wiley.
Elkington, J. (2012). The Zeronauts-Breaking the Sustainability Barrier. Earthscan.
Juniper, T. (2013). What Has Nature Ever Done For Us? London, UK: Profile Books.
Porter, M. E., & Kramer M. R. (2011). Creating Shared Value. Harvard Business Review.
1EPA Evaluating Climate Policy Options, Costs and Benefits, 2016. https://www.epa.gov/climatechange/evaluating-climate-policy-options-costs-and-benefits
2Magretta and Stone (2002).
3Willard (2012).
5Lovins and Cohen (2011), pp. 25–26.
6Sroufe, R. “Operationalizing Sustainability”, Journal of Sustainable Studies, Inaugural Issue 1.1, 2016.
7FedEx Global Citizen Report (2010).
8Sustainability at UPS report (2010).
9Berthelot et al. (2003); KPMG (2010).
10This map can be found at https://sourcemap.com/view/744
11 This section is based on Melnyk (1999).
12Lambert and Pohlen (2001).
13See the World Business Council for Sustainable Development (2013).
14Contribution margin is defined as: price per unit–variable costs per unit. It is the amount of contribution that each unit of sales makes toward offsetting fixed costs and, ultimately, toward attaining profit.
15Porter and Kramer (2011).
16Puma EP&L press kit (2011).
17As measured by MSCI’s ESG Global Socrates indicators of governance strengths as the effective reporting of a wide range of social and environmental performance metrics. Examples of social and natural capital metrics can be found in what was formerly known as KLD’s indicators of environment, governance, and diversity. Measured and reported to socially responsible investors, researchers, and university students as either strengths or concerns of publicly traded firms.