Sustainability—Reducing Waste, Enhancing Value
There is a simple rule about the environment. If there is waste or pollution, someone along the line pays for it.
—Lee Scott, Chief Executive, Wal-Mart
Ask yourself a question—do you want to source materials or products from poorly performing companies? If the answer is yes, then go ahead and continue paying for excessive waste that is now measured in GHG emissions or poor social impacts in the form of labor practices. If the answer is no, then look for companies in your supply chain that are leveraging sustainability to enhance existing business models, differentiate products and services, and reduce or eliminate waste from processes.
- Lawrence Livermore National Laboratory estimates that in the United States, we waste more than half of our energy consumption. Electricity generation and transportation make up the two largest contributors to this wasted energy.
- Wal-Mart and Puma have found that over 92 percent of their GHG emissions come from their supply chains.
- Combustion engines used for transportation (i.e., your car) only convert 1 percent of energy to movement of the passenger, and only 20 percent of the power generated by burning gasoline reaches the wheels. The rest is lost in heat and friction.
We should not willingly reward wasteful companies. Sustainability and sustainable supply chain management (SSCM) are about realizing the full value from supply chains and operations.
Objectives
- Understand the notion of waste, as it provides new insight to sustainability.
- Recognize the role of business models in making sustainability a strategic imperative.
- Appreciate the importance of “Sustainable Value Added” for assessing sustainability.
Sustainability as Waste Management
Building on the three levels of sustainability introduced in Chapter 3, we now look at waste management. This approach to sustainability traces its roots to a simple but powerful observation made in Chapter 1—waste is simply anything that does not add value to a product or service. Waste has been the focus of lean systems (otherwise known as the Toyota Production System (TPS) or just in time (JIT) manufacturing). Lean systems, since they were first introduced into North America in the early 1980s, have developed a long track record of being highly successful when applied correctly.
In part, the successful spread of lean can be attributed to a three-year study on the impact of lean systems within the automotive industry. This study, conducted by Womack, Jones, and Roos (1990)1 ended the debate about whether lean systems created real, lasting benefits. As shown in Table 4.1, the results showed that in the 1980s Japanese- owned automotive plants following lean were as much as 30 percent more productive than US-owned plants using traditional methods—quite a turnaround from the situation in the 1930s. Furthermore, the Japanese plants delivered cars with fewer defects, lower space requirements, and lower inventories. The data also showed that the Japanese lean effect was significant whether the plant was located in Japan or in the United States.
Table 4.1 Performance Characteristics for Lean Systems in various geographies
| Japanese in Japan | Japanese in North America | Americans in North America | All Europe | |
Performance |
||||
Productivity (hrs/vehicle) |
16.8 |
21.2 |
25.1 |
36.2 |
Quality (assembly defects/100 vehicle) |
60.0 |
65.0 |
82.3 |
97.0 |
Layout |
||||
Space (sq. ft/vehicle/yr) |
5.7 |
9.1 |
7.8 |
7.8 |
Size of repair areas (as percentage of assembly space) |
4.1 |
4.9 |
12.9 |
14.4 |
Inventories (days for 8 sample parts) |
.2 |
1.6 |
2.9 |
2.0 |
Work Force |
||||
Percentage of workforce in teams |
69.3 |
71.3 |
17.3 |
.6 |
Job rotation (0 = none; 4 = freq) |
3.0 |
2.7 |
.9 |
1.9 |
Suggestions/employee |
61.6 |
1.4 |
.4 |
.4 |
Number of job classes |
11.9 |
8.7 |
67.1 |
14.8 |
Training of new production workers (hours) |
380.3 |
370.0 |
46.4 |
173.3 |
Absenteeism |
5.0 |
4.8 |
11.7 |
12.1 |
Automation |
||||
Welding (percentage of direct steps) |
86.2 |
85.0 |
76.2 |
76.6 |
Painting (percentage of direct steps) |
54.6 |
40.7 |
33.6 |
38.2 |
Assembly (percentage of direct steps) |
1.7 |
1.1 |
1.2 |
3.1 |
Source: The Machine That Changed the World, p. 92, by James P. Womack, Daniel T. Jones, and Daniel Roos.
By treating pollution as waste, firms pursuing environmental sustainability could leverage and build on their experiences with lean to simultaneously achieve improved environmental performance. They could draw on and use similar frameworks; they could also use many of the same tools. The result—a low cost and, in many cases, a proven way of reducing waste. To understand this approach, it is important that we start with the foundations on which it is built—pollution and GHG emissions as waste.
Pollution as Waste
One of the major objectives of any lean system is to reduce waste. Waste can be identified as any activity that creates cost without contributing an equal or greater level of value. This thinking is not new and can be traced back to the work of Henry Ford in the early 1910s and 1920s. Waste consumes but does not reward.
Something to think about: of the approximately 97 quads of energy used in the United States, over 55 percent is lost or rejected energy; the two largest contributors to this waste include 47 percent of this loss from electricity generation systems and 36 percent from the transportation industry.2 How much waste is within your system?
Under the lean perspective, waste is a symptom. That is, it is the result of problems elsewhere. It is also the result of problems within processes (the fundamental unit of analysis for lean). Wastes of all kinds, including GHG emissions, can be grouped into one of the seven categories (Table 4.2). To these seven, many managers now add an eighth category—waste of skills—not drawing on or using our people to the best of their ability.
Table 4.2 Seven Types of Waste
| Waste | Symptoms | Root causes |
Overproduction (processing more units than are needed) |
|
|
Waiting (resources wasted waiting for work) |
|
|
Transportation (units being unnecessarily moved) |
|
|
Processing (excessive or unnecessary operations) |
|
|
Inventory (units waiting to be processed or delivered) |
|
|
Motion (unnecessary or excessive resource activity) |
|
|
Product Defects (waste due to unnecessary scrap, rework, or correction) |
|
|
The Lean Approach
To reduce waste, we must study the processes, uncover the critical root causes, and then attack (and hopefully, eliminate) them with a goal of zero waste. We can draw on and use the following lean tools tor attacking waste:
- Total productive maintenance (TPM): The processes and systems that work to identify and prevent all possible equipment breakdown through a combination of preventive maintenance by the employees, rigorous equipment design, and regular inspection of the equipment.
- Setup reduction: The processes used to reduce setup and changeover times with the goal of making output in smaller batch efficient.
- Statistical process control: The use of various statistical tools for analyzing the capabilities of a given process, and for monitoring its performance with the goal of flagging potential problems before they occur.
- Quality at the source (Q@S): The practice of eliminating defects at their origination points.
- Kaizen events: A short-term project (usually 1 to 4 days) aimed at improving an existing process. In that time period, cross-functional team members document a process, assess different options for performance, and develop and document the implemented process changes.
- Process analysis/value stream mapping: Graphic mapping techniques that help managers understand the material and information flows as a product and how it makes its way through the process.
- Poka-yoke: Also known as fool-proofing. An emphasis on redesigning processes in such a way as to make mistakes either impossible or immediately apparent to the people involved.
- Standardization/simplification: A program whereby non-value-adding steps in a process are eliminated (simplification) and each step in the process is carried out in exactly the same way by every employee (standardization) so that waste can be identified and eliminated.
With the lean approach, the emphasis shifts from the outputs (i.e., the pollution) to prevention (by focusing on the processes generating these wastes). Because we know that waste, such as pollution and GHG emissions, is the result of problems in one or more processes, to eliminate waste we have to focus on changing the appropriate processes. We will discuss these and other tools in more detail in this chapter.
This approach is highly attractive because its causal logic is straightforward, the lead time for results is often fairly short (days, weeks, months), there is a strong and direct linkage between cause and effect, and there are significant opportunities for improvement. As discussed in Chapter 1, the following relationships are important to revisit.
- In ordinary firms, for every one unit of value added (defined either from a time or cost perspective), the processes typically adds 1,000 to 2,000 units of nonvalue.
- In world-class firms, for every one unit of value added, the processes typically adds 200 to 300 units of nonvalue.
In other words, there is a lot of opportunity for improvement, waste reduction, and interrelated benefits.
Limitations of Sustainability as Waste Management
For all its attractions, this approach suffers from two major limitations. These involve limitations of scope and focus.
Scope: Scope refers to the extent to which the costs/benefits are applied. When dealing with lean systems, we can measure costs and benefits at several levels (see Figure 4.1). First, we can measure it in terms of its impact on the performance of the department. Of all the levels of analysis, this is the simplest and most direct to determine. Here, we are not interested in whether our actions affect those of the other departments. The goal is to improve our level of performance. Local optimization (at the expense of overall improvement) is accepted and prized. We can increase the scope to include the entire company. Now, analysis and evaluation are more complex. We have to consider the impact of our actions on the integrated performance of other departments in the company. Similarly, we can increase the scope to include the supply chain and finally the community/society.
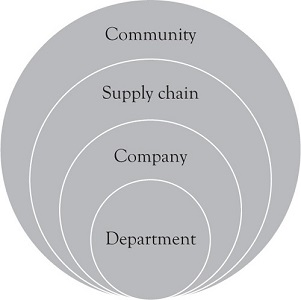
Figure 4.1 Scope of costs/benefits
As we increase the scope, analysis becomes more complex. However, as we increase the scope, we increase the opportunity to measure, manage, and affect more stakeholders.
When applied, lean systems tend to limit their scope to the first two levels—to the departments and to the company. For example, we can introduce a delivery system that emphasizes “milk runs” from our suppliers. Every day, we send a truck out to pick up supplies from our vendors. The truck goes out empty in the morning, but returns full at night. In it, we have enough components for next day’s production. From a typical “lean” perspective, this is good: inventory is low; we have enough inventory to keep production going. Yet, the problem with this approach is that by running our trucks in this manner, we are creating environmental waste in the form of increased energy consumption for the trucks (along with the associated waste and GHG levels). These impacts are typically felt, but not captured at the community level—a level beyond most organizations’ focus.
Focus: In many lean systems, the impact of lean is measured in terms of cost savings or cost avoidance. These are two of the three levels in the performance pyramid (Figure 4.2). At the lowest level, the base, we have cost savings. With cost savings, we address existing problems in current products and processes. For example, we have an inefficient process. We apply the lean tools and eliminate the sources of waste, reduce the number of steps in the process, and lower the level of waste generated by the process. We can evaluate the impact of these changes by comparing the performance of the new, revised process with the level observed for the old process.
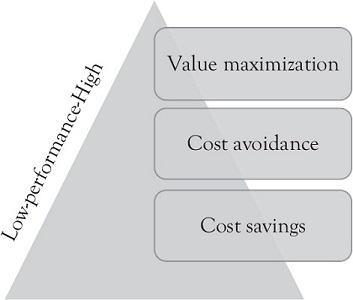
Figure 4.2 Performance pyramid
Cost avoidance is a higher level of performance. Here, we are not correcting past problems; we are avoiding them. This is a more powerful position, but one that is more difficult to assess. How do you measure avoidance? As a sign at a well-known automotive user of lean puts it, “P> S” (Prevention is greater than Savings).
Yet, there is a third and higher level—value maximization. To achieve this level of performance, an approach different from the ones used for the prior two must be implemented. We can achieve cost savings and cost avoidance without ever considering issues as to who is the key customer, or what is the business model driving our firm. However, to increase revenue, we have to understand these and other issues within a larger systems perspective. To increase revenue (especially over time), we have to deal with issues such as value. When dealing with value and the firm’s business model, we have changed the focus of sustainability from being tactical to being strategic. This is a critical transition and the reason that the third level of sustainability as value maximization is one in which environmental, social, AND business sustainability are simultaneously attainable.
Sustainability as Value Maximization
Of the three levels in the performance pyramid, value maximization is the most complex. Before we discuss what this level entails, we must first establish the foundations of this approach. At the heart of this approach are three critical concepts: (a) value, (b) business models, and (c) sustainable value maximization (this concept is defined in greater detail later on in this chapter).
Value
Value or the customer’s assessment of the relative benefits and costs obtained by the acquisition of a specific good or service is becoming increasingly important in today’s economy. While value begins with the customer, this concept is starting to have a significant impact of supply chains. As noted by Melnyk, Davis, Spekman, and Sandor (2010),3 there is a sea change taking place in supply chain management and at the heart of this change is value. In the past, supply chains were price driven (focused on cost savings) and strategically decoupled (not linked to how the firm competed in the marketplace). Now, they are increasingly becoming value driven and strategically coupled (linked to strategy).
It is important to recognize that value is customer specific. It is also important to recognize that not all elements of value are equally important. When a customer looks at the elements of value, how they respond and what they expect is driven by the type of traits they are dealing with. In general, these traits, which are often product-specific, can be classified into one of three categories:4
- Order Winners. These traits cause customers to choose a product or supply chain service over a competitor’s offering, for example, better performance, lower price, environmental and social performance certification such as the Forest Stewardship Council, or fair trade. These are traits on which operations and the supply chain management system must excel and be transparent.
- Order Qualifiers. These are product or supply chain traits such as availability, price, or conformance quality that must meet a certain level for the product to even be considered by customers. The firm must perform acceptably on these traits (i.e., the products must meet certain threshold values of performance), usually at least, as well as competitors’ offerings. In many cases, the customer may not be aware of any level of performance in excess of those minimum levels that they have established.
- Order Losers. Poor performance on these traits can cause the loss of either current or future business, for example, customers who shop at Target instead of Walmart due to labor practices.
In reviewing these categories, there are several factors to remember. First, order winners and order qualifiers form the basis for customers’ expectations. Order losers, in contrast, result from customers’ actual experiences with the firm and its operations management processes. They represent the gap between what the firm delivers and what customers expect. Second, order winners, order qualifiers, and order losers vary by customer. An order winner to one customer may be an order qualifier to another. Third, these traits vary over time. An order winner at one time may become an order qualifier at another point in time. Being able to identify and act on order winners offers the firm a critical strategic advantage.
While important by itself, the value concept becomes especially critical when implemented within a business model.
Business Models
The business model (as illustrated in Figure 4.3) can be viewed as the firm’s method for doing business. It is the framework used by the firm for creating and maintaining dynamic environmental, economic, and social forms of value. Business models have also come to be recognized as a form of intellectual property—an asset that can be protected through a patent.
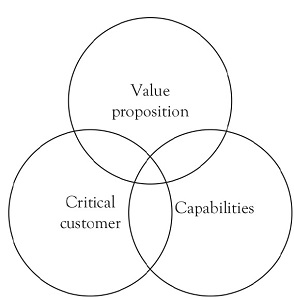
Figure 4.3 The foundations of the business model
There are numerous examples of business models. For example, there is the “razor and blades” business model first developed by Gillette—give away the razor but make your money on the blades. There is also the “direct sales” business model so successfully used by Dell—sell computers directly to the end consumer with Tesla now using this same approach. As a final example, there is the “loyalty” business model. This model has been widely implemented in the airline industry (through the frequent flier program) and in the retail trade (e.g., as in Best Buy’s Reward Zone program). With this model, consumers are rewarded for continuing to deal with the firm.
Business models are part of business strategy, innovation, and sustainability.5 The business model, by its very nature, is highly integrative in that it brings together into a meaningful whole the three elements—the key customer, the value proposition, and capabilities. To this point, this book has focused primarily on the capabilities element. Capabilities, while important, are not enough by themselves. As capabilities change over (due to factors such as technological innovation, capital investments, and process improvements), these changes have to be evaluated in terms of how they affect the other two dimensions. Furthermore, if the firm targets sustainability initiatives as a way to attract a new key customer, it must reevaluate the appropriateness of the current value proposition and capabilities (and make any necessary changes).
Increasingly, managers are talking about the need for better business models for three important reasons. First, there is strong empirical evidence that demonstrates the impact of business models of corporate performance. Business Week published a study, which showed that a firm with an innovative business model consistently outperformed competitors with innovative products, processes, and customer experiences (see Figure 4.4).6

Figure 4.4 Assessing the relative impact of an innovative business model
Second, business models are inherently dynamic. They are intended to help two important groups of firms. For existing firms, it is recognized that they have to develop new and innovative business models to compete against growing competition. For new firms trying to get into an existing market, business models are important because they identify unique niches in the marketplace.
Third, business models are attracting attention because they provide a vehicle for converting new technology and innovations into economic value.7 Innovation and new technology, in turn, are important because of the potential they offer the firm and the way in which they enable sustainability practices:8
- To serve new or existing customer segments whose needs have been neglected by existing competitors and their offerings.
- To serve new or existing customer segments whose needs are being poorly met by existing competitors and their offerings.
- To provide new ways of producing, delivering, or distributing existing (or new) products to existing (or new) customer segments.
Components of the Business Model
As we can see from Figure 4.3, the business model consists of three elements. It is important to understand what each element is and why it is important.
Key Customer(s): The starting and ending point for any effective and efficient supply chain operations is the customer. A customer is a person or organization who consumes the products of a process. A customer is not necessarily the end user; it could be the store manager or the purchasing agent. Almost all firms deal with multiple customers having varied desires and needs that change over time. This creates the dual challenge of keeping track of changing needs and identifying which customers’ needs should be addressed and which should be ignored. Each firm has to identify its key customers.
The key customer is that group or segment that the firm has identified as being important. As Hal Mather, a manufacturing consultant, once said: the key customer is that customer segment that the firm “will profitably delight.” When there is a conflict in meeting customer needs, it is always resolved in favor of the key customer.
Customers can be deemed key for a number of reasons. For example, a key customer may be responsible for largest amount of current or future sales of the firm, or it may be the one with the highest prestige. In the automotive industry, Toyota is often such a customer because of its very high quality and performance standards; a supplier working with Toyota is often viewed as a top-rate supplier.
Value Proposition: To attract these key customers, the firm must formulate and implement a value proposition, or a statement of what the firm offers the customer that is viewed attractive to the customer and is different from what is offered by its competitors. The value proposition is critical because it not only defines how the firm competes but also determines and shapes the types of products that the firm will (and will not) offer.
A well-designed value proposition possesses four traits: (a) it offers a combination of features that customers find attractive and are willing to pay for; (b) it differentiates the firm from its competitors in a way that is difficult to imitate; (c) it satisfies the financial and strategic objectives of the firm; and (d) it can be reliably delivered given the operational capabilities of the firm and its supporting supply chain. The value proposition reflects the order winners, order qualifiers, and order losers for a key customer segment, and thus it greatly influences the competitive priorities for all the related operations across the supply chain. In making the translation from value proposition to competitive priorities, operations managers need to clearly specify what the operations management system must do well (key success factors), what it must do adequately, and what it must avoid doing (because it will jeopardize customer satisfaction and orders).
Outcomes and Value Proposition: Central to value proposition is the set of outcomes to be delivered by the firm and its supply chain. As recently noted by Melnyk et al. (2010),9 supply chains are not simply cost driven; they are outcome driven. That is, all supply chains are built around six basic, major outcomes:
- Cost—Reducing price (initially) and cost (ultimately) is the key focus. Delivery and quality, while important, are secondary considerations and considered part of this outcome. It is important to recognize the difference between price and cost. Price focuses on what you pay for the good or service—it is the price found in the contract or on the tag. In contrast, cost represents all of the costs incurred including acquisition, storage, rework, and all other associated costs over the life of the product or services. As such, cost is a broader concept.
- Responsiveness—The ability to change quickly in terms of volume, mix, or location in response to changing conditions. Typically, responsiveness warrants a higher cost and price.
- Security—This involves supply chains that are safe and protected from external disruptions. Security is a relatively new requirement but has gained a great deal of attention recently, with cases of tainted food products from China and generic drugs from India.
- Sustainability—This outcome is different from security; it involves supply chains that are measuring and managing both environmental AND social dimensions.
- Resilience—This refers to supply chains that can deal with unexpected disruptive conditions or threats to supply, ranging from natural disaster to bankruptcies or even political embargos.
- Innovation—In recent years, many firms have increasingly relied on their supply chain as a source of product and process innovation. For example, IKEA long ago generated a competitive advantage by changing how products were delivered. More recently, Procter & Gamble involved both suppliers and customers in its highly successful new “connect and develop” innovation process.
The most effective and sustainable supply chains are a blend of these outcomes—a blend that is attractive to the key customers (and for which these same customers are willing to pay) and that differentiates them in the minds of the customer. Achieving and delivering the desired blend of outcomes to the customer cannot be achieved by accident. It requires not only strategic planning and intent but also having the “right” supply chain and the “right” supplier base in place.
In reviewing these outcomes, it is important to recognize that, like the elements of value, not all the outcomes are equally important. Rather, recent research conducted by one of the authors has led to the finding that in mixing these outcomes, a 1-2-3 approach should be used. That is:
- One (1) of the outcomes must be critical. This forms the core of the firm’s value proposition. It is that outcome that the firm will never compromise. It defines the essence of the firm and its supply chain.
- Two (2) of the outcomes are important. While not as critical as the prior outcome, they are important in that they describe how the outcomes will be delivered. These three describe the essence of the firm’s value proposition and should include sustainability if the organization’s view of sustainability is going to be more than public relations or waste management.
- Three (the remaining outcomes) are necessary. We do not have to do a great job on these outcomes; we simply need to be good enough.
Capabilities: The third element of delivering value is capabilities. Capabilities are unique and superior operational abilities that stem from the routines, skills, and processes that the firm develops and uses. Usually, abilities to deliver superior performance come from investments and developmental efforts in one or more of the following areas: processes, planning systems, technology, performance measurement, people and culture, and supply chain relationships.
Driving the effective and successful business model is the notion of “fit.” That is, the highest level of value is delivered when what the key customer expects (order winners, order losers, order qualifiers) is addressed by the value proposition and delivered by the capabilities of the firm.
Value Added
If we were to focus only on value, we look at what something is worth to the key customer, independent of the costs (level of waste and impacts) incurred to provide this outcome. The concept of economic value added is well-known to most if not all business leaders, but this concept does not go far enough. To ensure that the pursuit of value is sensitive to the issues of total value generated and total waste, we use the concept of Sustainable Value Added (SVA), where:
Sustainable Value Added = (Level of Financial AND Environmental AND Social Value Generated)—Total Waste
The concept of total cost of ownership fits well with SVA. This more encompassing approach to value creation has simply been defined as value that is created whenever benefits exceed costs.10 Total waste, as used in this context, is the cost and is broader than the notion of waste previously introduced in this chapter. Within the context of SSCM, and rather than focusing only on economic waste alone, total waste includes attempting to value all social, environmental, and economic waste (our negative impact on the environment and people, relationships, suppliers, and customers). An example of this can be found in Puma’s release of information regarding their environmental impacts from their own operations, and those of their tier-1 through-4 suppliers for water use, GHG emissions, land use, other air pollution, and solid waste with an associated cost of 145M EUR, or almost $192,000,000 US.11 This transparency into environmental impacts is part of an Environmental Profit and Loss statement also called an EP&L. While these valuations of environmental impact are not a full measure of the sustainable value added, they are a logical step in this direction and part of a trend toward integrated reporting and a new performance measurement frontier.
We already know that “brand” is a valuable asset. The Coca-Cola brand is worth more than half the company’s market value, and a staggering 10 times the book value of its parent company.12 If companies such as Coke or Microsoft can put brand on their books for umpteen billion dollars, what is the enhancement from more sustainable practices worth? When we start answering that question, then firms and their supply chains have a new opportunity to monetize the amount of value created from environmental and social actions as we move toward better performance metrics as indicators of sustainability and firm performance … or what we want you to start thinking about as SVA.
What this approach forces on management is the twin onus of sustainability—satisfying a real customer need while simultaneously reducing total waste. With this approach, we can see the limitations of prior approaches—at best, they focus on waste reduction and pollution prevention, and they do little for value maximization. The approach that forces management to focus on SVA is that of SSCM and value maximization—the third and highest level of the performance pyramid.
Sustainable Value Maximization
At this level of supply chain management, sustainability is integral to the business model.
- The key customer targeted is someone for whom sustainability (one of the six supply chain outcomes) is either an order winner or at a minimum an order qualifier.
- The value proposition explicitly identifies sustainability and offers it as something that the customer is willing to pay for.
- The firm has organized its capabilities to ensure that value is being delivered. This means that it focuses on both the maximization of value and the elimination of waste/pollution within the production system.
- Performance measurement enabled by systems thinking goes beyond the firm to include the supply chain and ultimately the community.
When viewed from this perspective, it becomes clear that environmental and social sustainability are integrated and simultaneously inclusive of business sustainability. This is the image that we see when we review the vision put forth by Polman for Unilever. It is a vision that emphasizes SVA; a vision that focuses both on value creation and waste reduction. It also represents a vision that seeks to ensure that the community benefits from sustainability—both as consumers and as suppliers. It also represents a situation where environmental and social sustainability are viewed as not only being critical for the firm and the planet but as essential to developing and maintaining a sustainable competitive advantage. For a synopsis of 20 studies showing the business case for sustainability, see “Sustainability Pays,” a project by Natural Capitalism Solutions.13
These are the goals that every firm should aim for when developing a sustainable supply chain and the attainment of these goals will be the focus of the rest of this book.
Summary
This is a book about developing and maintaining the sustainable supply chain. Given the growing importance of sustainability, it is also important that we develop a thorough and well-grounded understanding of this business paradigm. That has been the goal of this chapter where we have made the following points:
- Sustainability can be implemented as waste management, or as sustainable value management.
- When focusing on SVA, think in terms of the business model and strategy of the organization, value creation, and waste elimination.
- The business model forces us to think in terms of aligning three interrelated entities:
- The key customer
- The value proposition
- The capabilities of the system
- We have chosen to focus on the notion of SVA, or value adjusted for waste. This approach has been used to force managers to recognize that they must deal with both the elements—value and waste.
- It is when we implement SSCM as sustainable value delivered that we see a system for synchronizing financial, environmental, and social sustainability.
Building on Chapter 3, we are now able to better understand the challenge of developing a sustainable supply chain. The next two chapters introduce performance measurement and tools.
Applied Learning: Action Items (AIs)—Steps You Can Take to Apply the Learning From This Chapter
AI: How does your organization currently value environmental or social aspects of functions?
AI: What is your business model: key customer, value proposition, and capabilities?
AI: How can you start measuring value creation and waste to enable the concept of SVA?
AI: What lean practices are in place within your organization?
AI: How would you explain to coworkers in other functions why firms are putting a price on CO2 emissions?
AI: How many and what types of waste are within your own operations?
Further Readings
Lovins, B., L. H. Lovins, & P. Hawkins (2007). A Roadmap for Natural Capitalism. Harvard Business Review 85. 7-8.
McKinsey & Co. (2011). Resource Revolution: Meeting the World’s Energy, Materials, Foods, and Water Needs. Global Institute and Sustainability & Resource Productivity Practice.
McKinsey & Co. (2016). Greenhouse Gas Abatement Cost Curves, http://www.mckinsey.com/business-functions/sustainability-and-resource-productivity/our-insights/greenhouse-gas-abatement-cost-curves
1Womack Jones and Roos (1990).
2Lawrence Livermore National Laboratory (2012).
3Melnyk et al. (2010).
4Hill (2000).
5MIT Sloan Management Review and Boston Consulting Group (2013).
6Jana (2008) Business Week, September 22, Indata section, p. 48.
7Chesbrough and Rosenbloom (2002).
8Markides (1998).
9Melnyk et al. (2010).
10Figge, Hahn, and Tobias (2004).
11Puma press kit (2011).
12Kohli and Leuthesser (2001).
13Natural Capitalism Solutions (2012).