Sustainability—A Performance Measurement Evolution or Revolution, Models and Programs
You never change things by fighting the existing reality. To change something, build a new model that makes the existing model obsolete.
—Buckminster Fuller
There are now models and programs available to help measure and manage sustainability initiatives:
- Environmental Protection Agency (EPA) SmartWay programs increase the availability and market penetration of fuel-efficient technologies and strategies that help freight companies save money while also reducing adverse environmental impacts. Specifically, SmartWay Transport programs lower emissions of carbon dioxide, nitrogen oxides, and particulate matter. As of 2010, SmartWay Partners report: saving 50 M barrels of fuel ($6.1 B in fuel costs saved); eliminating 16.5 M metric tons of CO2—equivalent of taking over 3 M cars off the road; eliminating 235,000 of tons nitrogen oxides; and 9,000 tons of particulate matter.
- The Carbon Disclosure Project’s (CDP) network of investors and purchasers represent over $100 trillion, and work with global policy makers who use CDP data and insights to make better-informed decisions.
- The Global Reporting Initiative (GRI), with thousands of reporters in over 90 countries provides the world’s most widely used standards on sustainability reporting and disclosure. The GRI is an intrinsic element of integrated reporting, a recent development that combines the analysis of financial and nonfinancial performance.
There are a number of models, programs, guidelines, and examples of how firms have already started their development of sustainable supply chain management (SSCM). In this chapter, we expand on the context of performance measurement in Chapter 5, while exploring the existing enablers of measurement and management of sustainability initiatives.
Objectives
- Understanding a performance hierarchy and the factors contributing to more comprehensive performance measurement.
- Introducing programs, guidelines to measure and manage supply chains.
- Reviewing key performance indicators providing insight for carriers and less-than-truck-load service providers.
Sustainability: A Performance Measurement Evolution or Revolution?
We see the use of financial and operational metrics as a performance hierarchy (Figure 6.1), with a typical progress of management thinking and sustainability providing new opportunities to accelerate innovation. The ability to align sustainability as a strategic imperative across a supply chain means that you are simultaneously engaging multiple levels of the performance hierarchy from cost savings to value creation while using sustainability as a catalyst for the integration of new multifirm performance metrics.

Figure 6.1 Performance hierarchy
With increased scrutiny of investors and customers, coupled with the ability of technology to quickly showcase supply chain problems, multifirm metrics aligning sustainability provide insight for risk management. This level of thinking also enables both visibility and transparency through telling compelling stories of efficiency, stakeholder engagement, and innovation. Companies are now mapping and managing supply chains in new ways.
In order for management to understand the interrelationships between corporate and supply chain performance, more broad-based measures are required to move firms from efficiency and cost savings into opportunities for innovation, revenue generation, and new markets.
Measures now integrate financial and nonfinancial performance. The complexity of the supply chain requires a different approach for understanding how and where sustainability will align with your business model and corporate performance. A number of factors contributing to the need for more comprehensive performance management include but are not limited to:
- The push for more visibility and transparency within supply chains.
- The increasing complexity of supply chains.
- The need to go beyond internal metrics to understand a supply chain perspective.
- The need to understand interrelationships of corporate and supply chain performance.
- The new availability of data from life cycle assessment (LCA) and product development processes.
- The use of new performance metrics for supply chain analysis and optimization.
- The need for accountability of supply chain waste and sustainable value added (SVA).
- Differentiation and competitive advantage.
Managers need to see into their supply chain by measuring and comparing the performance and activities of companies they do not directly control. Increased visibility and shared metrics assist management with the integration, synchronization, and optimization of processes cradle to grave (raw material extraction to landfill) or cradle to cradle (from raw materials to closed-loop systems recapturing raw materials as inputs). Implementing a supply chain strategy requires metrics that align performance with the objectives of other members of the supply chain. Supply chain and sustainability managers need to work collaboratively to generate the greatest mutual gains and resource efficiency. Aligned metrics help shift management’s attention to making decisions that also align with the goals of the entire supply chain.
The overlay of sustainability within supply chain analysis and planning involves an understanding of how to approach creating sustainable value, and the application of emerging measurement tools and quantitative models that characterize various relationships and economic synergies in the supply chain. The field of supply chain analysis/optimization has made significant strides in both theoretical and practical application of waste reduction. The application of a sustainability lens to analysis results in an unprecedented mixture of predictive and outcome models, global reporting, new visibility and transparency within supply chains, and like the Puma EP&L example, the ability to quantify full costs of operations, products, and supply chains. Next, we discuss how to get started, and the guidelines, tools, and models already available to leverage the integration of sustainability into supply chain management.
Models, Program, Guidelines, and Tools to Help Integrate Sustainability
In this chapter, we are building on a foundation for understanding performance metrics reviewed in the previous chapter while foreshadowing sustainability as the driver of a performance revolution. We next introduce proven models, practices, and insight that help guide measurement and process improvement. The information presented here is a brief summary of models, programs, guidelines, and tools to help customize your own integration opportunities and processes.
The Supply Chain Operations Reference Model
For many, starting with a thorough understanding of your existing supply chain sets the foundation for integrating sustainability initiatives. With the advent of supply chain management, managers have increasingly sought to coordinate activities spanning customer and supplier organizations. One of the challenges of this approach is finding new ways to communicate objectives and performance outcomes among supply chain partners. In the late 1990s, a group of industrialists from about 70 leading companies created an organization called the “Supply Chain Council.” Working together, they developed the Supply Chain Operations Reference Model (commonly known as the SCOR model).1 The model was originally conceived as a framework reference defining concepts and metrics that could be used by organizations in any industry segment to share information with supply chain partners.
The SCOR model includes more than just metrics; it illustrates tools for mapping and describing supply chain processes. It also describes supply chain management best practices and technology. SCOR best practices section includes environmentally responsible supply chain management (called GreenSCOR). However, we will focus here on several dimensions and relative metrics of the model. The SCOR model identifies basic management practices at different levels of operation. For example, “level 1” processes include Plan, Source, Make, Deliver, and Return. One of the basic tenets of the SCOR model is that metrics should cascade hierarchically from one level to the next.
At each of the levels addressing the supply chain, SCOR addresses five basic dimensions of performance. They are:
- Supply Chain Delivery Reliability:
- The performance of the supply chain in delivering the correct product, to the correct place, at the correct time, in the correct condition and packaging, in the correct quantity, with the correct documentation, and to the correct customer.
- Supply Chain Responsiveness:
- The velocity at which a supply chain provides products to the customer.
- Supply Chain Flexibility:
- The agility of a supply chain in responding to marketplace changes to gain or maintain competitive advantage.
- Supply Chain Costs:
- The costs associated with operating the supply chain.
- Supply Chain Asset Management Efficiency:
- The effectiveness of an organization in managing assets to support demand satisfaction. This includes the management of all assets: fixed and working capital.
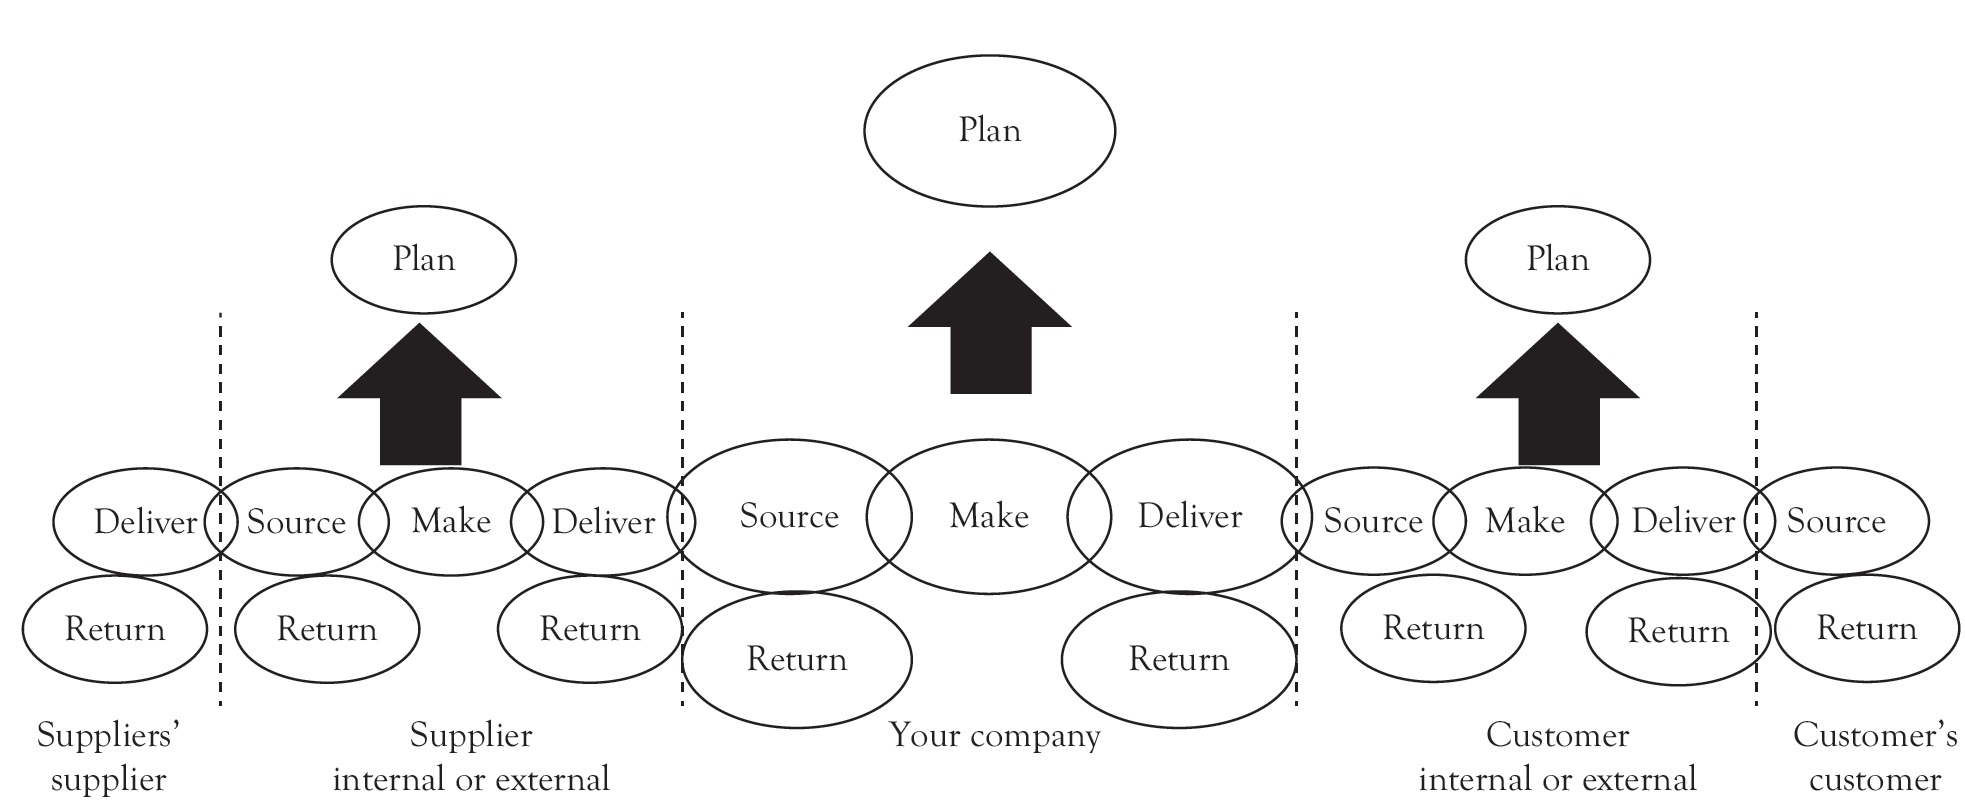
Figure 6.2 The SCOR model and its major components
Source: Supply Chain Council’s Supply Chain Operations Reference-model (SCOR).
The SCOR model identifies performance metrics for each of these dimensions. One of the objectives of the model is to provide a framework for benchmarking and for translating strategy into practice. The following strategic environmental metrics allow the SCOR model to be used as a framework for environmental accounting:
- Carbon dioxide emissions (tons CO2 equivalent)
- Air pollutant emissions (tons or kg)
- Liquid waste generated (tons or kg)
- Solid waste generated (tons or kg)
- Recycled waste (percent)
The SCOR framework ties emissions to the originating processes, providing a structure for measuring environmental performance and identifying where performance can be improved. The hierarchical nature of the model allows strategic environmental footprint goals to be translated to specific targets and activities.2 The results of mapping a supply chain and benchmarking analysis provide the level of performance necessary to be on a par with the industry middle performers, as well as levels required to gain differential advantage. The benchmarking data can indicate the impact of improvement in a given outcome performance metric, either on revenues, costs, or investments. This type of analysis helps partners in a supply chain to plan and prioritize sustainability improvement initiatives in accordance with an overall business strategy.
The primary benefit cited by SCOR users includes process metrics and the benchmarks included in the SCOR guidelines. These guidelines help to show company executives a tangible picture of supply chain gap analysis and shortcomings. In doing so, the SCOR guidelines help direct supply chain performance plans.
Global Reporting Initiative (GRI)
The GRI (www.globalreporting.org/) is a multistakeholder nonprofit organization founded in the United States in 1997 by the Coalition of Environmentally Responsible Economies (CERES). In 2002, GRI was formally inaugurated as a United Nations Environment Program (UNEP) collaborating organization and moved its central office to Amsterdam, where the Secretariat is currently located. GRI has regional “Focal Points” in Australia, Brazil, China, India, and the United States, and South Africa and a worldwide network of 30,000 people.
This organization produces a sustainability reporting framework that has become the de facto framework used around the world to enable greater organizational transparency, and their guidelines are available to the public at no cost. GRI’s reporting guidelines are used by thousands of companies in 90 different countries.3 The GRI’s mission is to mainstream the disclosure of environmental, social, and economic performance metrics for companies. The goal of GRI is to develop a standard practice for sustainability reporting that allows stakeholders to compare sustainability-related data. These guidelines have been in use for well over ten years as the original set of GRI reporting guidelines was released in 2000.
There are several options for reporting depending on the level of detail and amount of metrics a firm can measure and verify. After a company has decided to utilize the GRI reporting structure, the GRI metrics can be used as an audit template internally. The internal auditing and reporting process categorizes information for a general profile disclosure, management approach, an executive mission statement, and a strategy for executing sustainable initiatives. These initiatives are then linked to performance indicators as they relate to economic, environmental, and social metrics. The principles and guidelines help to make the report tailored to a company’s specific industry and the sustainability challenges they face.
Primary benefits of GRI reporting include the use of existing performance metrics for environmental, social, and human rights, society, and product responsibility and the ability to have third-party verification of report contents. Thus, you do not have to reinvent the wheel when looking for relevant environmental and social metrics. Developing a GRI G4-based materiality matrix and sustainability report can be beneficial undertaking for any company. The auditing and reporting process facilitates process level understanding of operations and supply chains and should be leveraged to inform management decisions, identify activities and benchmarks for cost reduction and avoidance, supply chain integration, brand reputation, and market differentiation. GRI guidelines and performance metrics are also leveraged for the assessment of corporate governance. For some, for example, Novo Nordisk, United Technologies, PepsiCo, Southwest Airlines, Bayer, and Philips, sustainability reporting is being combined with the annual financial report. In a survey of GRI report readers, 90 percent of those polled said that reading the sustainability reports resulted in them viewing the companies in a more positive light.4
Carbon Disclosure Project (CDP)
In 2000, the CDP (www.cdp.net) was established to collect information from companies to “accelerate unified action on climate change.”5 Based in the United Kingdom, the CDP provides centralized accounts of corporations’ climate-change and water-management policies and measures their direct impact on the environment through GHG emissions. Working with over 650 institutional investors holding over $100 T in assets, the CDP has an expansive worldwide presence, including offices in New York, Berlin, Sao Paulo, Beijing, and Tokyo.6
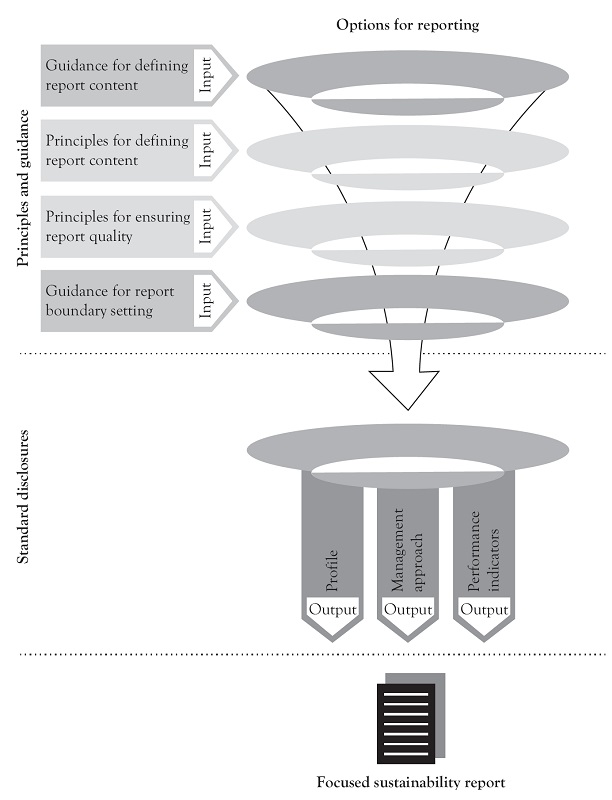
Figure 6.3 The GRI structure—the major components
CDP reports a company’s emissions based on scope, reduction from base year, and target year emissions. Like many sustainability programs, CDP believes in using base targets to set goals for reduction. In the Supply/Chain Public Procurement options, supplier companies’ carbon information is requested in order to identify emissions through all parts of the production and distribution process. The Supply Chain Report, A New Era: Supply Chain Management in a Low-Carbon Economy is available as a free download highlighting survey results of CDP reporting organizations and suppliers.7 Results of the survey show that 90 percent of CDP supply chain member organizations have a climate change strategy. In addition, 62 percent reward suppliers for good carbon management practices with 39 percent soon to deselect suppliers that do not adopt such measures. The CDP also collects data outside of carbon management. Water-intensive companies report water usage and issues regarding coping with threats arising from water scarcity, pollution, and flooding. Cities report in order to prepare for effects of climate change, benchmark, and relate to the business communities.
To begin disclosing, a company submits an online questionnaire focusing on targets, emissions, risk management, scope, and so on. This can be done individually or the CDP offers links to carbon calculator partners, consultancy partners, and third-party verification partners. The resulting reports allow you to calculate carbon footprint, identify areas for improvement, and benchmark against other groups.
There are a number of benefits associated with reporting emission data and water use data through the CDP. One key benefit is the opportunity to advertise successes, particularly in comparison to industry competitors.
The process of reporting this data can also help an organization identify areas for improvement in energy efficiency and cost savings. Organizations benefit by having a standardized response prepared for investor inquiries regarding emissions and water use. In addition, participation in the CDP can be viewed as a favorable demonstration of transparency that can help set an organization apart from its competitors. This can be of particular value during times when investor confidence in the integrity of organizations is wavering.
While climate change policy is still evolving, organizations are seizing the GHG space as a means of differentiation and waste reduction. To help in this process, the GHG Protocol Initiative (www.ghgprotocol.org) arose when World Resources Institute (WRI) and World Business Council for Sustainable Development (WBCSD) recognized the need for an international standard for corporate GHG accounting and reporting. Together with multinational corporate partners such as British Petroleum and General Motors, WRI identified an agenda to address climate change, among which included the need for standardized measurement of GHG emissions. In the late 1990s, WRI and WBCSD convened a core steering group comprising members from environmental groups (WWF, Pew Center on Global Climate Change, The Energy Research Institute) and from industry (Norsk Hydro, Tokyo Electric, Shell) to engage in a multistakeholder standards development process.
The GHG Protocol is now the most widely used international accounting tool for government and business leaders to understand, quantify, and manage GHG emissions. As part of a decade-long partnership between the WRI and the WBCSD, the GHG Protocol is the result of work with businesses, governments, and environmental groups around the world to build a new generation of credible and effective programs for tackling climate change. It serves as the foundation for nearly every GHG standard and program in the world—from the International Standards Organization (ISO) to The Climate Registry—as well as hundreds of GHG inventories prepared by individual companies. The GHG Protocol also offers developing countries an internationally accepted management tool to help their businesses to compete in the global marketplace and their governments to make informed decisions about climate change.
The GHG Protocol Corporate Accounting and Reporting Standard (also called the Corporate Standard) was published in 2001. Since then, the GHG Protocol has built upon the Corporate Standard by developing a suite of calculation tools to assist companies in calculating their GHG emissions and additional guidance documents such as the GHG Protocol for Project Accounting. Additionally, WRI and WBCSD have partnered with governments, businesses, and nongovernment organizations in both developed and developing countries to promote the broad adoption of the GHG Protocol as the foundation for sound climate change strategies.
The primary benefits of using the GHG Protocol include its acceptance as a global standard, understanding of process level performance metrics, and the scope and bounds of GHG measurement for organizations and supply chains. This information is important for understanding and determining who is responsible for GHG emissions, goal setting, and differentiating from others within an industry. Understanding starts with knowing the scope of GHG emissions and what you have direct control over.
GHG Protocol Emission Definitions
Scope 1: Direct GHG emissions occur from sources that are owned or controlled by the company (e.g., emissions from combustion in owned or controlled boilers, furnaces, vehicles, etc.) along with emissions from chemical production in owned or controlled process equipment.
Scope 2: Electricity-indirect GHG emissions account for GHG emissions from the generation of purchased electricity consumed by the company. Purchased electricity is defined as electricity that is purchased or otherwise brought into the organizational boundary of the company. Scope 2 emissions physically occur at the facility where electricity is generated.
Scope 3: Other indirect GHG emissions are an optional reporting category that allows for the treatment of all other indirect emissions. Scope 3 emissions are a consequence of the activities of the company, but occur from sources not owned or controlled by the company. Some examples of Scope 3 activities are extraction and production of purchased materials; transportation of raw materials and finished goods; and use of sold products and services. For products such as consumer electronics, the use of the product will have the largest impact on GHG emissions.
In 2006, the International Organization for Standardization (ISO) adopted the Corporate Standard as the basis for its ISO 14064: Specification with Guidance at the Organization Level for Quantification and Reporting of Greenhouse Gas Emissions and Removals. This milestone highlighted the role of the GHG Protocol’s Corporate Standard as the international standard for corporate and organizational GHG accounting and reporting. ISO, WBCSD, and WRI signed a Memorandum of Understanding in 2007 to jointly promote both global standards.
The SCOR model, CDP, and GHG Protocol provide vast amounts of information for global supply chain mapping, benchmarking, and performance metrics. These initiatives are broad based, providing organizations with proven guidelines and models for measuring, understanding, and, with the help of the GRI framework, reporting process level performance rolled up into organizational and supply chain performance. Two of the three initiatives are specifically focused on GHG and carbon measurement. What many supply chain service providers need at a more micro level includes incentives, policy, and technical solutions to optimize transportation networks in a company’s supply chain. Thus, we next introduce programs within a U.S. context for fuel efficiency and waste reduction.
SmartWay Program
As we found with the Puma EP&L example, many manufacturers have found a significant portion of their carbon footprint lies in the supply chain and distribution of products. To help reduce these impacts and better manage your supply base, you can leverage existing collaborative efforts from the SmartWay Program (http://www.epa.gov/smartway). This is the U.S. EPA’s program for improving fuel efficiency and reducing GHGs and air pollution from the transportation supply chain industry. The program includes four general areas of focus: transport partnership, tractors and trailers, finance, and technical assistance. Developed jointly in early 2003 by the EPA and Charter Partners represented by industry stakeholders, environmental groups, American Trucking Associations and Business for Social Responsibility, the program was launched in 2004. SmartWay comprises of partnerships, financial incentives, policy and technical solutions, and research and evaluation projects that find new ways to optimize the transportation networks in a company’s supply chain. To date, the partnership includes nearly 2,900 companies and associations committed to improving fuel efficiency. The SmartWay Programs support the supply chain industries in the following ways:
- The SmartWay Partnership Program is a government/industry collaboration between EPA, freight shippers, carriers, logistics companies, and other stakeholders, to voluntarily achieve improved fuel efficiency and reduce environmental impacts from freight transport.
- Participating companies benchmark their current freight operations; identify technologies and strategies to reduce their carbon emissions, track emissions reductions, and project future improvement.
- SmartWay partners demonstrate to their customers, clients, and investors that they are taking responsibility for the emissions associated with goods movement, are committed to corporate social responsibility (CSR) and sustainable business practices, and are reducing their carbon footprint.
- SmartWay-endorsed tractors and trailers meet voluntary equipment specifications that can reduce fuel consumption by 10 to 20 percent for 2007 or newer long-haul tractors and trailers. Each qualified tractor/trailer combination can save operators between 2,000 and 4,000 gallons of diesel per year while also reducing GHG emissions and air pollutants.
- To help with capital expenditures, programs include helping companies acquire fuel-efficient emission reduction technologies through easier access to financial mechanisms such as reduced-interest loans with flexible terms.
- To provide evidence-based solutions, the SmartWay assessment program tests and verifies emissions reductions and fuel savings from various available technologies, such as tractor and trailer aerodynamics, auxiliary power units, and wide-based tires. As a result, companies can compare the fuel efficiency and environmental performance of various technologies and make more informed purchases.
Benefits from becoming a SmartWay partner starts with the assessment of freight operations; calculating fuel consumption and carbon footprint; and tracking fuel-efficiency along with emission reductions annually. In exchange for this upfront learning and resource expenditure, the EPA ranks and publicizes partner’s performance on the SmartWay Partner List. Superior performers earn the SmartWay Partner logo and associated point value. Participation in SmartWay helps carriers to identify opportunities to improve efficiency; demonstrate efficiency to potential customers, and reduce fuel costs. Participation in SmartWay also helps shippers and logistics companies choose more efficient carriers; assess optimal mode choices; and reduce their transport carbon footprint.
The SmartWay programs provide a focused insight into fuel and pollution reduction that for many invokes an image of long haul tractors and trailers. It is also beneficial to drill down into more detail regarding a GHG focus within carriers and the less than truckload (LTL) service providers. This insight reveals a number of existing practices with room for many in the industry to catch up to best practices. After reviewing activities within a regional context for logistic service providers, we next transition into information on how corporate sustainability professionals perceive successful sustainability initiatives and how these same professionals work with supply chain professionals to collaborate for success.
GHG Management Within Carriers and an LTL Company Context
Suppliers of both goods and services to leading edge sustainable organizations are seeing a shift from optional GHG improvement initiatives to required sustainability strategies to remain a viable supply chain partner. The first step in SSCM for most organizations is to measure and control direct and indirect GHGs in house, or what is generally referred to as sources owned and controlled by the company (Scope 1 direct emissions) and those from electricity consumed by a firm (Scope 2 indirect emissions). However, for many manufacturers, a significant portion of their carbon footprint lies in the supply chain and distribution of products. More aggressive sustainability programs now expand their assessment and improvement requirements to Scope 3 partners.
PITT OHHIO—Transportation solutions provider
Specifically, one of the largest contributors of CO2 for many manufacturers’ total carbon footprint comes from the logistics services required to properly position material and finished product in today’s global supply chains. Despite the relatively large contribution of transportation to an overall carbon footprint, one of the major hurdles in tracking supply chain emissions is an understanding of how to develop Scope 1 through Scope 3 emissions reporting capabilities.
The leadership of some carriers such as PITT OHIO recognizes both the need and the potential benefit of gaining visibility and control over their carbon footprint as important to maintaining their competitive advantage in the industry into the future. This case example describes the elements of measuring CO2, can provide the necessary link to current activity-based costing (ABC) systems to permit viable CO2 allocation to customers, and reveals best practices to assist any carrier in the development of a sustainable strategic plan.
LTL Carbon Metrics
The GHG Protocol Corporate Standard provides an internationally accepted guidance for companies and other organizations preparing a GHG emissions inventory. It covers the accounting and reporting of the six GHGs covered by the Kyoto Protocol—carbon dioxide (CO2), methane (CH4), nitrous oxide (N2O), hydrofluorocarbons (HFCs), perfluorocarbons (PFCs), and sulphur hexafluoride (SF6). While all six gases are not emitted from every industry, the guidance provides a structured approach to identifying scope bounds for an emission inventory and methodology for summarizing an overall CO2 equivalent. The protocol was designed with the following objectives for all firms including transportation providers:
- To help companies prepare a GHG inventory that represents a fair account of their emissions, through the use of standardized approaches and principles.
- To simplify and reduce the costs of compiling a GHG inventory.
- To provide business with information that can be used to build an effective strategy to manage and reduce GHG emissions.
- To increase consistency and transparency in GHG accounting and reporting among various companies and GHG programs.
The protocol builds on the experience and knowledge of over 350 leading experts drawn from businesses, NGOs, governments, and accounting associations. It has been road-tested by over 30 companies in nine countries. The GHG Protocol Initiative’s vision is to harmonize GHG accounting and reporting standards internationally to ensure that different trading schemes and other climate-related initiatives adopt consistent approaches to GHG accounting.
Preparing an emission inventory has the potential to be straight forward in some environments where only direct emissions are calculated. The aggregation, transfer/sortation, line haul, and distribution nature of LTL and parcel transport add a level of complexity to CO2 calculation and distribution not encountered in bulk transportation methods. Multiple types of equipment in various sizes, picking up and delivering shipments with a wide variety of sizes, weights, and distances traveled makes it a challenge to determine exactly how much carbon is generated within each step of a process, and even more challenging to calculate what portion of that carbon footprint belongs to each stakeholder involved.
Carbon Assessment
With insight provided from PITT OHIO customers, a number of these companies are in the early stages of measuring supply chain CO2 emissions. They have goals and performance metrics tied to CO2. Carrier selection is moving toward a carriers ability to reduce CO2, and the three primary decision criteria for some customers is a combination of service, price, and sustainability, not necessarily in this same order.
One of the primary opportunities to get started is a baseline CO2 assessment. After reviewing a number of publicly available carbon calculators, we find these approaches to be oversimplified by looking only at average burn rates and load factors, they aggregate all trucking for LTL and TL, or they do not produce the same numeric results and will make any assessment difficult to defend as the results will not be customized. A benchmarking of existing calculators reveals an opportunity for a customized assessment solution while leveraging existing internal data.
Enabling PITT OHIO’s ability to draw from multiple sources of GHG emission data, coupled with the support of personnel, and based on best-in-class practices, a customized carbon calculator was created. When developing calculators, we propose taking a Scope 1 and Scope 2 assessment model based on calendar year of data. The bounds for this CO2 assessment should include the electricity, natural gas, propane, and fuel oil used at the facility level. To give you an idea of the scale of this approach, this baseline assessment for PITT OHIO assessed over 20 terminals across nine states; using B-5 diesel fuel for over 700 tractors and over 400 straight trucks; gasoline consumption for 60 nonrevenue fleet vehicles; and all airline miles.
The insight gained during this assessment reveals over 125,000 metric tonnes of CO2 associated with PITT OHIO operations. It’s no surprise that tractors and straight trucks impacting 90 percent of the firm’s CO2
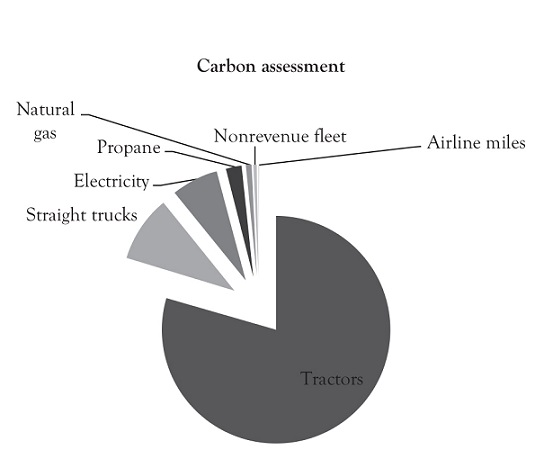
Figure 6.4 PITTOHIO—Carbon assessment generated by its carbon calculator
footprint. Electricity consumption at the terminals is the next largest contributor followed by propane and then natural gas. The process of collecting the location-level utility and fleet data is a good exercise in leveraging existing performance management and environmental management systems and this process will helps to uncover gaps in the data. Existing programs and efforts to reduce impacts at terminals have gone a long way toward resource efficiency for many common facilities initiatives throughout the industry such as electricity and water conservation. Existing programs to reduce fuel consumption within fleet vehicles is a step in the right direction, yet more attention can be put on tractors and straight trucks as a percentage reduction in fuel consumption will have proportionally larger CO2 reductions.
As an LTL service provider, PITT OHIO is in the business of moving customer’s goods with high service rates and competitive pricing. To drill deeper into the CO2 assessment to look for understanding and opportunities for new services, any company will next want to look at the customer’s portion of an LTL’s CO2 footprint.
Customer’s Portion of LTL’S Carbon Footprint
Utilizing the existing activity-based costing system and insight from management; we collaboratively developed and assessed a CO2 equivalent on a per-shipment basis for clients. Based on data, and several discussions with management, the agreed-upon best approach for the allocation of CO2 to a customer can be based on distance, weight, and cube while utilizing a CO2 emission coefficient for B-5 diesel fuel from soy-based and low-sulfur sources. Based on customer data, per-trip amounts of CO2 can be generated and rolled up into a monthly amount of emissions in-line with what some customers are already asking for. Customer allocation also provides an opportunity for offering “carbon-neutral” options for shipments that other providers such as FedEx and UPS are already selling to customers.
The information and insight from a CO2 inventory assessment project like this provide opportunities to better understand and leverage natural capital through outcome metrics while working toward predictive metrics, GRI reporting, and certifications. Key performance indicators (KPIs) for assessing the impact of future sustainability initiatives typically start with natural capital and CO2 and become more nuanced when assessing social capital. These opportunities for differentiation capture short-term positioning of information and analysis capabilities with the growing need for more transparency and better measurement of sustainability initiatives. We next summarized benchmarking regarding important sustainability factors in the LTL industry that align with natural capital, specifically looking at CO2 emissions and resource efficiency.
Carrier and LTL Carbon Management Best Practices
Current commitment to managing and improving the carbon footprint of members of the supply chain’s transportation segment varies significantly across the industry. Some LTL service providers show no evidence that they have taken any steps to track or manage their carbon footprint. Marketing material, websites, and strategic plans rarely acknowledge the concept of sustainability as important to the industry or their customers providing a short-term window of opportunity for differentiation and possibly competitive advantage.
Most regional LTL carriers have some evidence of interest in impacting natural capital. Few reference membership in the EPA’s SmartWay Transport Partnership as an indicator of natural capital. In some cases, the SmartWay logo on promotional material and websites is the only recognition given to natural capital. Other carries provided lists of environmental impact reduction initiatives most of which include: recycling, idle and speed controls, and low emission fuels.
A review of the LTL web landscape finds few LTL carriers presenting natural or social capital as a strategic initiative. Table 6.1 provides a list of the various techniques and practices that LTL carriers are promoting as indicators of natural capital. The first section of this list identifies the most commonly identified CO2 reduction initiatives. However, most, if not all, would also be considered good business decisions as they reduce costs AND improve service. Also listed are those CO2 reduction practices of the more environmentally proactive carriers.
Table 6.1 Actionable CO2 Reduction Practices
| Common CO2 Initiatives |
Facilities |
|
• Electricity
• Recycling
• Resources
• Water
Fleet • Drivers
• Equipment
|
| Proactive/Strategic CO2 Initiatives |
Facilities • Electricity
• Recycling • Ink cartridges, computers, refrigerant, fluorescents, LEDs Fleet • Drivers
• Equipment
Operations • Efficiency
• Administration
|
Expanding the search to larger carrier groups and other modes uncovers a number of “Differentiating Strategic” sustainable practices. Most of the large transportation companies do not acknowledge the common activities listed above as part of their sustainability programs. It is implied that they are doing all of those things and they have moved on to more strategic initiatives. From Old Dominion’s inclusion of electric, natural gas, and hybrid vehicles to UPS’s carbon-neutral program, most of the larger and multimodal carriers are going beyond basic efficiency improvements. Table 6.2 identifies these differentiating CO2 initiatives and the focus of some carriers on partnering with environmentally based organizations and NGOs.
Table 6.2 Best-in-Class Sustainability Differentiating Initiatives
Customer Focus • Package design support • Eco responsible packaging • Shipment Scheduling • Carbon Neutral Option Programs • Carbon Calculators Environmental key performance indicators • CO2 per ship unit • CO2 per $ sales • Water (Gallons) per unit • Environmental and Sustainability Affiliates
|
Business • Carbon Exchanges
• Carbon Offsets
• Promote Green
• Sustainability Index
|
Larger carriers recognize the fact that the vast majority of the CO2 from transportation is from fuel and therefore are focusing their efforts in this area. There are two primary approaches. The first involves alternative fuel options from higher concentrations of bio fuels, to electric, natural gas, or hybrid vehicles. This group of carriers is well past the basics of changing out tires and aerodynamic equipment, as next steps are more significant and expensive. The second focus is on improved utilization of equipment. By improving load factors in their operations and for their customers, more freight can be moved in the same CO2 footprint. The use of enhanced packaging design tools, pallet loading, and trailer loading, internally and externally, CO2 per shipment and per ton mile can be reduced. For those customers actively looking to reduce their scope 3 CO2 footprint, this proactive approach is effective while also understanding sustainable value maximization.
Other differentiating strategies found in the sustainability initiatives of the larger carrier groups involve the advanced practices of carbon offsets and carbon trading. For example, UPS offers a Carbon-Neutral Shipping option by which a freight premium is directed to one of the four global environmental projects that will reduce carbon as much or more than that generated by the shipment. Although eliminating CO2 is preferred to offsetting it, the continued dependence on fossil fuels for transportation in the foreseeable future requires other alternatives to neutralize the effect of transport CO2. One missing practice for a long-term sustainable relationship with nearly all LTL carriers is a formal strategic position on sustainability. While some LTL carriers such as PITT OHIO have a web page and literature about their “green” initiatives, a review of other service provider’s strategic plans and value statements uncovers an absence of a formal statement of sustainability improvement as a corporate goal. Often any mention of sustainability programs by LTL providers is buried in web pages that require searches to locate, while the larger, more sustainably proactive carriers prominently display their sustainable programs, performance metrics, and their strategic commitment to sustainability.
The most visible difference between LTL sustainability programs and the large national LTL, TL, and multimode carriers is the existence, or lack of an annual sustainability report. While these reports in some case are very extensive (FedEx 47 pages and UPS 107 pages), the size is not as important as making an open declaration of past sustainable accomplishments and future goals. Annual sustainability reports provide current and prospective customers with transparency into the organization’s sustainability strategies and establish a level of accountability, providing customers an assurance that sustainability is a critical part of the carrier’s future. By identifying both accomplishments and future plans, customers can understand a compelling story of the value placed on sustainability by the carrier, and how well the carrier’s goals align with their own. For those shippers that are held accountable by offshore parent companies for improving their carbon footprint, alignment with strategically committed sustainable carriers is a positive step toward meeting parent company goals.
The LTL Carrier Context Summary
Our research suggests that any firm integrating sustainability should provide a compelling story to customers regarding the benefits of their previous carbon emission improvements and the development of a program for continued improvement. Industry trends point to the need for more visibility and transparency in reporting carbon reduction efforts, opportunities for providing lower carbon services, and the development of sustainability reports to position any firm relative to others in its industry.
Some firms such as PITT OHIO are already positioned to expand their competitive lead over LTL carriers due to proactive efforts toward environmental sustainability. By going beyond the basic steps of energy and CO2 reduction to full carbon footprint accounting and customer-specific CO2 allocation, some will outperform other LTL carriers and can offer sustainability conscious customers verifiable data on their scope 3 supply chain footprints.
As a result of measurement and reporting, transparent, publicly traded firms can be included in rankings such as Newsweek’s Greenest Companies and within socially responsible investing (SRI) indexes such as the Dow Jones Sustainability Index or FTSE 4 Good. The future reality of supply chain management is an integrated approach where supply chain professionals will leverage visibility within a supply chain to impact financial performance, while simultaneously measuring, managing, and reporting natural AND social capital as enablers of transparency.
Summary
In this chapter, we have looked at performance and the factors contributing to more, not less comprehension of your processes and those of your suppliers. We have introduced programs and guidelines to help you measure and manage processes in new ways. These approaches from the SmartWay, SCOR, GRI, and CDP all indicate that environmental and social performance measurement is here to stay. What appears to be a revolution to many has become an evolution to some. After reviewing applicable models, protocols, and initiatives, a deep dive into the carrier and LTL industry demonstrates the ability to customize an organization’s carbon footprint assessment. There is always room for improvement as supply chains integrate sustainability and this metric evolution to innovate, reduce waste, and maximize sustainable value.
Applied Learning: Action Items (AIs)—Steps You Can Take to Apply the Learning From This Chapter
AI: Are you or your suppliers participants in the SmartWay program?
AI: Where in the SCOR are there opportunities to better understand your own processes?
AI: Search the GRI database to find reports from other firms in your industry?
AI: Evaluate your firm’s practices to assess energy consumption and associated emissions. Do you have more Scope 1, 2, or 3 GHG emissions?
AI: Review the CDP’s supply chain program. What can you and your suppliers do differently to achieve climate resilience?
Further Readings
Global Reporting Initiative; https://www.globalreporting.org/Pages/default.aspx.
Carbon Disclosure Project Supply Chain Program; https://www.cdp.net/en/supply-chain
GHG Protocol Calculation Tools; http://www.ghgprotocol.org/calculation-tools
Environmental Protection Agency’s SmartWay Program; https://www.epa.gov/smartway
DuJon, V., Dillard, J., & Brennan, E. M. (2013). Social Sustainability: A multilevel approach to social inclusion, New York, NY: Routledge.
Tercek, M. and Adams, J. (2013). Natures Fortune, Philadelphia, PA: Basic Books.
1See http://www.supply-chain.org/ for more information on the supply chain council and the SCO-model.
2Supply Chain Operations Reference-model Overview-Version 10 (2013).
3The Global Reporting Initiative (GRI) produces a comprehensive Sustainability Reporting Framework that is widely used around the world, to enable greater organizational transparency. The Framework, including the Reporting Guidelines, sets out the Principles and Indicators organizations can use to report their economic, environmental, and social performance. GRI is committed to continuously improving and increasing the use of the Guidelines, which are freely available to the public. Global Reporting Initiative (2013d).
4Brown et al. (2007).
5Carbon Disclosure Project (2011).
6Molloy (2010), pp. 44–45.
7Carbon Disclosure Project (2012).