
Pragmatic Study of the Impact of Disasters on Humans and Agriculture Using Data Analytics
Namrata Agrawal
NIFM, Ministry of Finance, Government of India, India
Disha Gupta
Gujarat Forensic Sciences University, Gandhinagar, Gujarat, India
Introduction
India has regularly faced natural disasters because of its unique geo-climatic conditions. This chapter highlights the existing disaster vulnerability in India. Around 57 percent of land in India is vulnerable to earthquakes, of which 12 percent is vulnerable to severe earthquakes, 12 percent to floods, and 8 percent to cyclones. The number of climate-induced disasters has increased significantly over the last decade. Of all the natural hazards, floods, droughts, and tropical storms affect the agricultural sector, most depicting the severe impact of climate-related disasters. Apart from natural disasters, some cities in India are also vulnerable to chemical and industrial disasters and other man-made disasters (NPDM 2009). Since 1950, there has been a gradual increase in the economic costs linked with all natural disasters. After each decade, there has been a rising trend in the number of deaths due to natural disasters (around 50 percent), as compared with the population growth rate of around 20 percent. Worldwide, annual economic costs related to natural disasters have been estimated at $50 to $100 billion (FAO 2015). It is predicted that by the year 2050, 100,000 lives will be lost globally each year because of natural disasters and that the global cost could be $300 billion annually (CRED 2017).
This chapter adopts a multidimensional approach through an empirical study and analysis of the impact of natural disasters on humans and agriculture by exhaustive analysis of the data on natural disasters in India during the period 2001 to 2013. The data/figures and statistics have been collected from various ministries of the government of India for the study.
The chapter also highlights the yearwise trend analysis of disasters and the probable reasons thereof, including the analysis of the correlations between various vital parameters such as lives lost, cropped areas affected, and cattle lost.
Research Objectives
The objective of the study was to understand and analyze the trends in natural disasters occurring in India over the last thirteen years. Modern analytical tools and techniques have been used to study the correlations between the vital parameters such as “lives lost” (in numbers), “cattle lost” (in numbers), “houses damaged” (in numbers), and “cropped areas affected” (in million ha) with respect to the natural disasters that took place. The research findings/outcomes will be shared with the stakeholders/Government/decision makers for informed and effective decision making in the future.
Methodology
The data set comprises annual loss figures that occurred because of natural disasters from 2001 to 2013 in India. The data set was obtained from various ministries such as Indian Meteorological Department, Ministry of Health and Family Welfare, Ministry of Agriculture and Animal Husbandry, Ministry of Environment and Forests, and Ministry of Labour. The data set was collated to focus on the statistics on annual lives lost, cattle lost, houses damaged, and cropped areas affected from 2001 until 2013.
Data analytics tools, such as Tableau, Statpro, and Excel, were used to analyze the impact of natural disasters on agriculture, human lives, cattle lost, and houses damaged in the last thirteen years in India with a critical perspective (Evans 2016).
The following analysis was performed on the collated data set:
- A)Trend analysis to reflect the trends in damage/loss to lives in the last thirteen years arising from natural disasters in India;
- B)Trend analysis to find the trends related to damage of cropped areas in the last thirteen years;
- C)To study and analyze the relationships/correlations between various parameters listed here for improved decision making in future:
- C.1 Relationship between lives lost and houses damaged
- C.2 Relationship between lives lost and cattle lost
- C.3 Relationship between lives lost and cropped areas affected
- D)Assessment of the wider impact of natural disasters on the value chain on agro-industries, national economies, livelihoods, and food security in India.
The findings were graphically depicted to facilitate understanding, decision making, and drawing of conclusions.
Findings
The observations and results obtained from the analysis of the data have been elaborated as follows:
Trend analysis of loss of lives on account of disasters in the last thirteen years in India
- •In Figure 2.1, the rise in the number of lives lost during 2001–2002 may be attributed to the massive earthquake that occurred on January 26, 2001, in Kutch district of the state of Gujarat, which killed around 20,000 people.

Figure 2.1 Yearwise lives lost (in numbers)
- •The heat wave in the southern part of India that killed more than 1,000 people in the state of Andhra Pradesh is a probable reason for the rise in the number of causalities during the years 2002–2003 (Figure 2.1).
- •The rise in the graph during the year 2003–2004 reflects the rise in casualties because of the Indian Ocean earthquake/tsunami that occurred on the west coast of Sumatra. However, during the year 2004–2005, there was no significant loss of lives, resulting in a horizontal line in Figure 2.1.
- •The steep rise in the loss of human lives between the years 2006 and 2007 is a consequence of floods in Bihar, a flood-prone state in India. This was the worst disaster in Bihar in the last 30 years.
- •There is a steep fall in the number of lives lost between the years 2008–2009 and 2009–2010 because of comparatively fewer or insignificant natural calamities in the entire country.
- •The graph rises slightly between the years 2010 and 2011 presumably because of the eastern Indian storm that killed more than 90 people and destroyed or damaged around 91,000 dwellings.
- •There were comparatively less cases of natural disasters during the years 2011–2012 (till May 2013) as reflected in the graph below.
Trend analysis of cropped areas affected by disasters in the last thirteen years in India
- •Figure 2.2 shows that there was relatively less damage to crops from 2001 up to 2006, as natural calamities, if any, generally affected human beings.
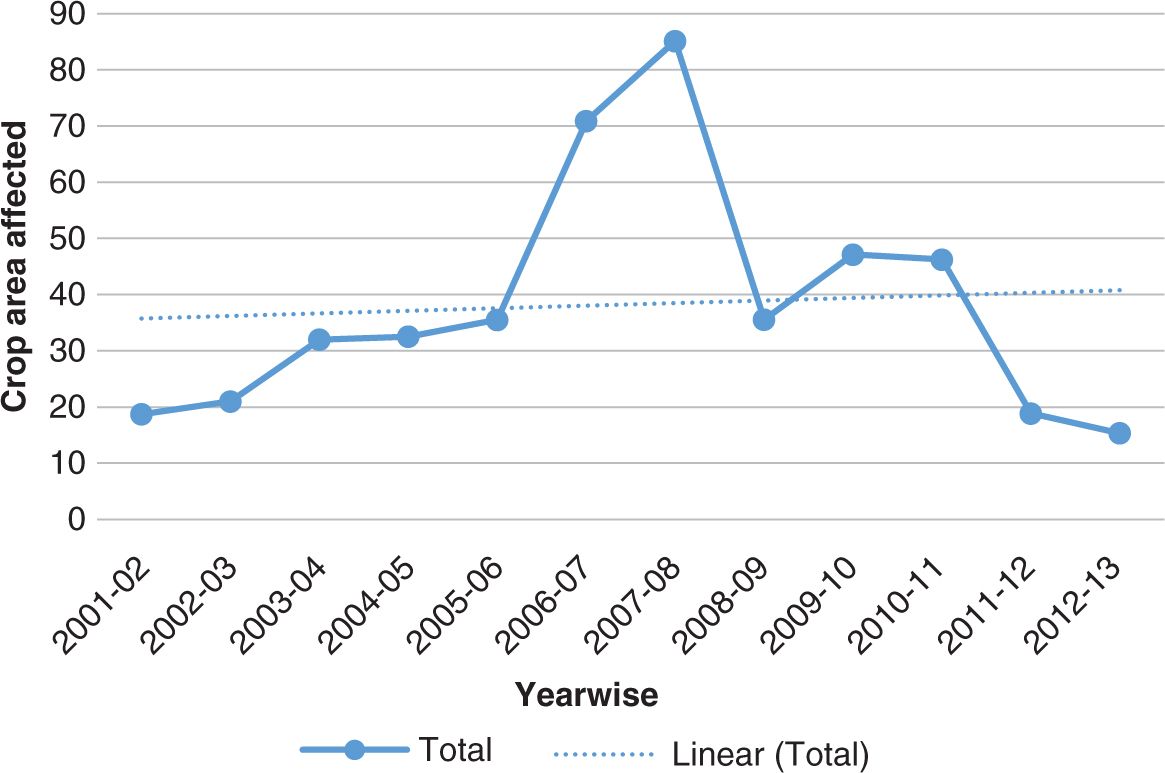
Figure 2.2 Yearwise crop area affected
- •The maximum loss of cropped areas occurred between the years 2005–2006 and 2007–2008 and may be attributed to the Bihar floods and the deficient monsoon in the country as a whole.
- •The trend was relatively constant between the years 2009–2010 and 2010–2011 but declined in subsequent years.
Relationships/Correlations between Vital Parameters
Relationship between Lives Lost and Cropped Areas Affected
Every natural disaster adversely affects the human resources of a nation, resulting in demotivated homeless survivors. The livelihoods of the affected populace were impacted to the extent that they depend solely on the relief measures of the government.
The correlation between the lives lost and the cropped areas affected has been calculated to determine the relationship (if any) that exists between them.
- •It is evident from Figure 2.3 that there is a positive correlation of 0.735 between the number of lives lost and the extent of cropped areas affected. This implies that a rise in human casualty figures would eventually indicate a rise in the adversely affected cropped areas.
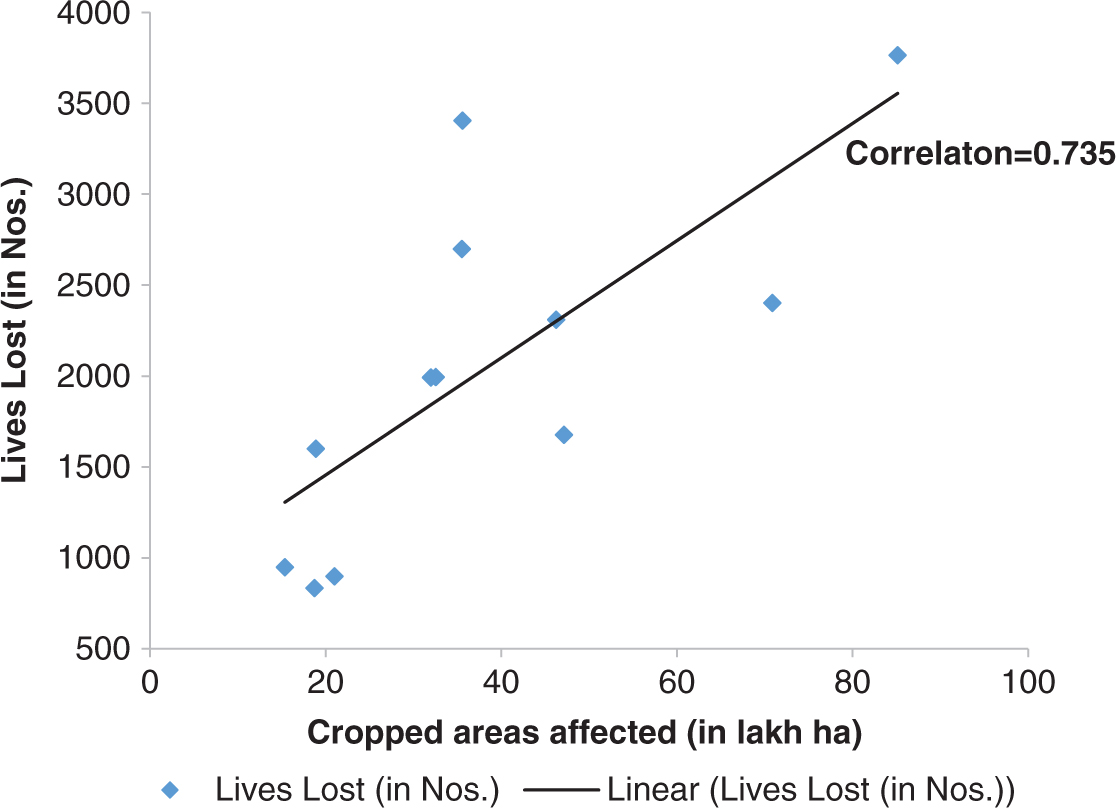
Figure 2.3 Correlation between lives lost and cropped areas affected
- •This analysis is accurate and practical, as more damages to human resources would have a larger bearing on agricultural damage. Ultimately, it is human beings who take care of the cropped areas.
Relationship between Lives Lost and Houses Damaged
- •Data analysis of the natural disaster figures for the period 2001 to 2013 and subsequent study of the relationship between the number of lives lost and houses damaged has been performed (Figure 2.4).

Figure 2.4 Correlation between lives lost and houses damaged
- •A strong positive correlation of 0.873 between the parameters number of lives lost and houses damaged indicates that any increase in the number of damaged houses has eventually resulted in an increased number of lives lost and vice versa. This holds practically true and factual.
Relationship between Lives Lost and Cattle Lost
- •It is observed that there is a relatively weak correlation, 0.322, between the number of lives lost and number of cattle lost, indicating that an increase in cattle loss would not eventually lead to an increase in lives lost and vice versa (Figure 2.5). However, this is indicative of the positive rising trends.
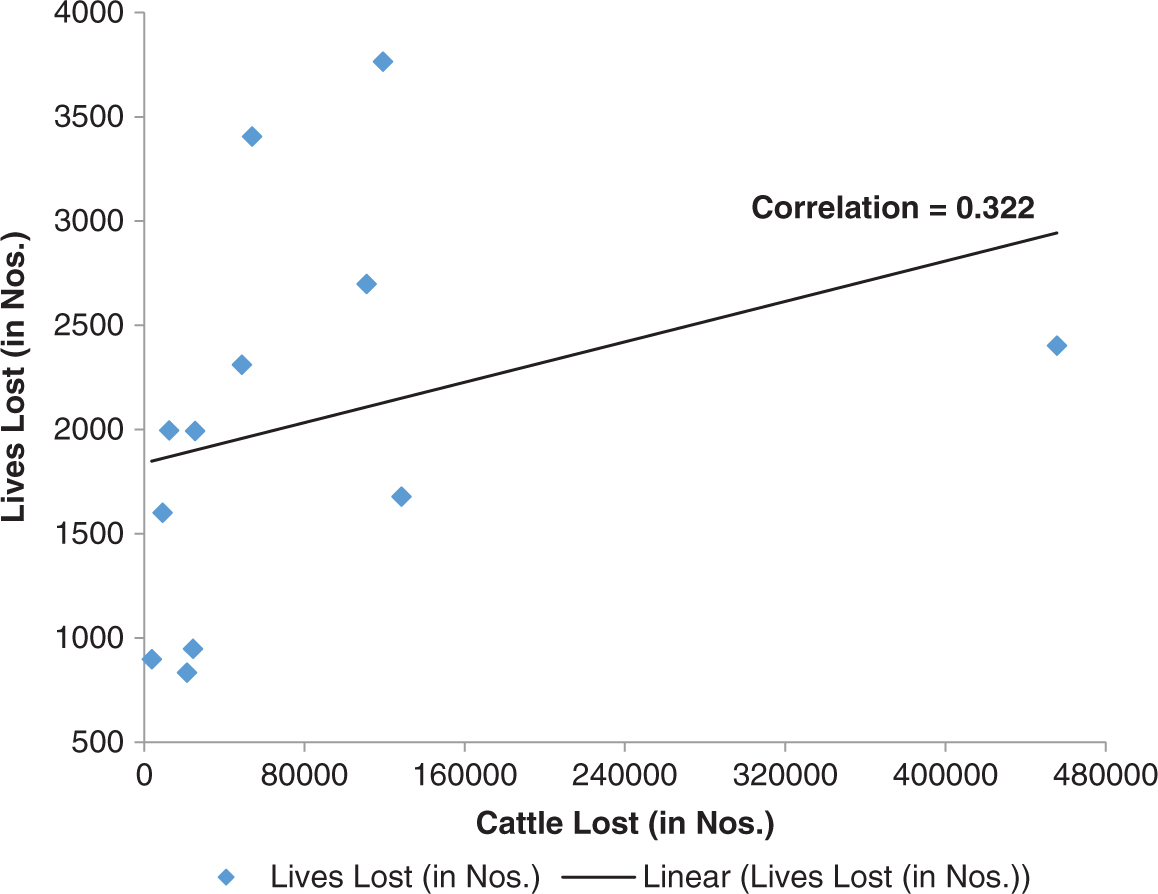
Figure 2.5 Correlation between lives lost and cattle lost
The above findings and trends constitute a strong warning to all (major/minor) stakeholders concerned to collaborate and work together to minimize redundancy of the efforts and to evolve systematic and effective information reporting and monitoring tools for preparedness, immediate response, and damage assessment.
Conclusion
The findings of the study generally exhibit a rising trend of adversities. The study suggests that the potential of information technology may be exploited to check the rising trend of natural disasters. Further, the National Policy on Disaster Management of India should be revisited for a holistic and practical approach to the implementation of prevention, mitigation, and preparedness in the predisaster phase with appropriate additional funding, along with the extant policy on postdisaster relief and rehabilitation under crisis management.
As the number of natural disasters is on the rise and continues to significantly impact the world’s poorest and least-developed countries, emphasis must be placed on appropriate and informed investment toward disaster reduction.
It is necessary to include as a key component R&D work in disaster preparedness, mitigation, and prevention so that adequate funds are earmarked for the schemes of R&D organizations as well as the central ministries and state governments concerned.
Recommendations
The broad assessment of the impact of natural disasters on agriculture, housing, and human lives points to the urgent need for a holistic integrated approach toward safeguarding them. Programs for improving methods of prediction and dissemination of warnings should be expanded and intensified. Stakeholders’ efforts are also needed to determine the impact of disasters on natural resources. Priority should be given to research with practical applications leading to an understanding of physical and biological factors contributing to disasters.
Further, effective and practical guidelines need to be issued to ministries or departments concerned of the Government of India to integrate the measures for prevention of disasters or their mitigation in development plans and projects.
The potential of information technology can be effectively and accurately used. Data on past disasters and its critical analysis would help decision makers in formulating realistic and informed policy decisions and subsequent investments and implementations toward disaster prevention, mitigation, and preparedness. Capacity building should be encouraged at the local and regional levels for undertaking rapid-assessment surveys and investigations of the nature and extent of damage in postdisaster situations.
The use of information and communications technology (ICT) in disaster management in India is expected to reach $10 billion in 10 years. This fact was stated in a business conclave during the 58th International Astronautical Congress held in 2007. The global annual revenues of the ICT in the disaster management/geographic information system (GIS) market are expected to grow from an estimated $4 billion to $150 billion in the next decade (Detwiler 2016). With the increasing use of ICT (GIS) and high-resolution imagery services by government agencies, private companies, and individuals, the market is growing by leaps and bounds, and the advantages of the same should be appropriately utilized (Detwiler 2016).
References
Centre for Research on the Epidemiology of Disasters. 2017. Emergency Disaster Database. Brussels, Belgium: Centre for Research on the Epidemiology of Disasters.
Detwiler, J. 2016. Geospatial Big Data Analytics. University Park, PA: Penn State, College of Earth & Mineral Sciences.
Evans, J.R. 2016. Business Analytics: Methods, Models and Decisions. Upper Saddle River, NJ: Pearson, pp. 255–93.
Food and Agriculture Organization of the United Nations. 2015. The Impact of Disasters on Agriculture and Food Security. Rome, France: Food and Agriculture Organization of the United Nations, pp. 13–19.
United Nations. 2015. “Disaster Risk Reduction.” Proceedings of Sendai-Japan Conference.