
Chapter 1
Introduction: The Role of Wide Area Monitoring Systems in Dynamic Vulnerability Assessment
Jaime C. Cepeda1 and José Luis Rueda-Torres2
1Head of Research and Development and University Professor, Technical Development Department and Electrical Energy Department, Operador Nacional de Electricidad CENACE, and Escuela Politécnica Nacional EPN, Quito Ecuador
2Assistant professor of Intelligent Electrical Power Systems, Department of Electrical Sustainable Energy, Delft University of Technology, The Netherlands
1.1 Introduction
Currently, most social, political, and economic activities depend on the reliability of several energy infrastructures. This fact has established the necessity of improving the security and robustness of Electric Power Systems [1]. In addition, the lack of investment, the use of congested transmission lines, and other technical reasons, such as environmental constraints, have been pushing Bulk Power Systems dangerously close to their physical limits [2]. Under these conditions, certain sudden perturbations can cause cascading events that may lead to system blackouts [1, 3]. It is crucial to ensure that these perturbations do not affect security, so the development of protection systems that guarantee service continuity is required. In this regard, Special Protection Schemes (SPS) are designed in order to detect abnormal conditions and carry out corrective actions that mitigate possible consequences and allow an acceptable system performance [4].
However, the conditions that lead the system to a blackout are not easy to identify because the process of system collapse depends on multiple interactions [5, 6]. Vulnerability assessment (VA) is carried out by checking the system performance under the severest contingencies with the purpose of detecting the conditions that might initiate cascading failures and may provoke system collapse [7]. A vulnerable system is a system that operates with a “reduced level of security that renders it vulnerable to the cumulative effects of a series of moderate disturbances” [7]. The concept of vulnerability involves a system's security level (static and dynamic security) and the tendency of its conditions changing to a critical state [8] that is called the “Verge of Collapse State” [5]. In this context, vulnerability assessment assumes the function of detecting the necessity of performing global control actions (e.g., triggering of SPSs).
In recent years, emerging technologies such as Phasor Measurement Units (PMUs), which provide voltage and current phasor measurements with updating periods of a few milliseconds, have allowed the development of modern approaches that come closer to the target of real time vulnerability assessment [6, 7]. Most of these real time applications have been focused on identifying signals that suggest a possibly insecure steady state. This kind of VA is capable of alerting the operator to take appropriate countermeasures, with the goal of bringing the system to a more secure operating condition (i.e., preventive control) [9]. Nevertheless, the use of PMUs has great potential to allow the performance of post-contingency Dynamic Vulnerability Assessment (DVA) that could be used to trigger SPSs in order to implement corrective control actions. In this connection, a Wide Area Monitoring System (WAMS), based on synchrophasor technology, constitutes the basic infrastructure for implementing a comprehensive scheme for carrying out real time DVA and afterwards executing real time protection and control actions. This comprehensive scheme is called a Wide Area Monitoring, Protection, and Control system (WAMPAC) [10]. This chapter presents a general overview of concepts related to power system vulnerability assessment and phasor measurement technology and subsequently highlights the fundamental relationship between these in modern control centers.
1.2 Power System Vulnerability
A vulnerable system is a system that operates with a “reduced level of security that renders it vulnerable to the cumulative effects of a series of moderate disturbances.” Vulnerability is a measure of system weakness regarding the occurrence of cascading events [7].
The concept of vulnerability involves a system's security level (i.e., static and dynamic security) and its tendency to change its conditions to a critical state [8] that is called the “Verge of Collapse State” [5].
A vulnerable area is a specific section of the system where vulnerability begins to develop. The occurrence of an abnormal contingency in vulnerable areas and a highly stressed operating condition define a system in the verge of collapse state [5].
In this chapter, vulnerability is defined as “the risk level presented by a power system during a specific static or dynamic operating condition regarding the occurrence of cascading events.” This concept makes vulnerability an essential indicator of system collapse proximity.
Although there are a lot of vulnerability causes, which vary from natural disasters to human failures, system vulnerability is characterized by four different symptoms of system stress: angle instability, voltage instability, frequency instability, and overloads [5]. So, vulnerability assessment should be performed through analyzing the system status as regards these symptoms of system stress.
1.2.1 Vulnerability Assessment
Vulnerability assessment has the objective of preventing the occurrence of collapses due to catastrophic perturbations [11]. Performing VA requires specific mathematical models capable of analyzing the multiple interactions taking place between the different power system components [11]. These models have to consider the varied phenomena involved in the vulnerability condition and also the diverse timeframes in which the corresponding phenomena occur.
Many methods have been proposed for vulnerability assessment, which have been classified based on various criteria [6, 7]. However, in terms of their potential implementation in control centers, the techniques to assess vulnerability can be classified into off-line, on-line, and real time methods. Figure 1.1 depicts the proposed classification of vulnerability assessment methods.
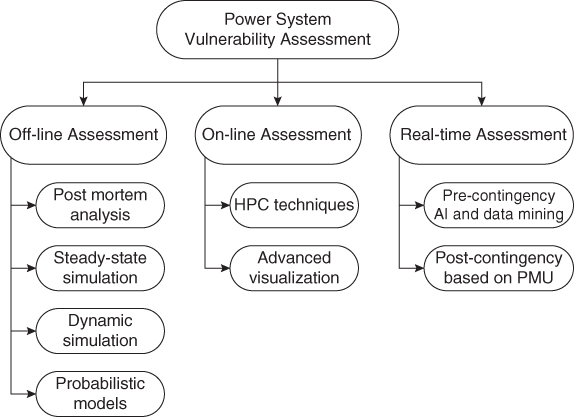
Figure 1.1 Power system vulnerability assessment methods.
- Off-line assessment: Off-line assessment is done using conventional methods that are based on different complex model simulations; these usually involve time-consuming tasks, which restricts on-line applications. The high complexity is provoked by the huge number and diversity of the components that constitute an electric power system and their particular performance during dynamic phenomena. Among this class of methods are those that assess vulnerability via power flow computations. These approaches are based on the hypothesis that a typical contingency provokes minor changes in the Bulk Power Systems, so they migrate from one quasi-steady state to another. The simulations do not include any dynamic response analysis [7]. This type of evaluation is commonly called Static Security Assessment (SSA). As a complement of SSA, dynamic simulation is commonly used in order to consider all the static and dynamic power system components, simulating any type of contingency and any type of instability [9, 12]. In this case, the complexity of the modeling and mathematical computations demands high processing time [7, 9]. This evaluation is usually called Dynamic Security Assessment (DSA). Usually, both in SSA and DSA, several “what-if” contingencies are simulated in order to determine the most critical disturbances (i.e., N-x contingency analysis) [9].
- On-line assessment: In an on-line assessment, the information must be available in the SCADA/EMS (Supervisory Control and Data Acquisition/Energy Management System). The input data are updated using adequate tools and equipment (e.g., IEDs, PMUs, WAMS), but the output is not necessarily obtained as quickly as the real time events occur [12].
- Real time assessment: The input data reflect the most recent picture of the system conditions in a real time analysis, and the entire process is performed within very short time, typically not exceeding a couple of seconds [12]. Emerging technologies, such as Phasor Measurement Units (PMUs), have allowed the development of modern approaches to vulnerability assessment [7, 12] capable of being updated practically in real time. Additionally, some novel mathematical methods permit processing the data obtained in real time through identification of indicators or patterns that show system vulnerability, using artificial intelligence (AI) or modern data mining techniques [7]. Tools based on AI allow the analysis of power system dynamic performance patterns in real time, using the knowledge obtained from off-line learning [7]. On the other hand, data mining techniques permit uncovering valuable hidden information immersed in the electric signals [7], which can exhibit certain regularities (patterns) signaling a possibly vulnerable condition [10, 13]. VA methods based on AI and data mining are oriented to evaluate both pre-contingency quasi-steady state data (i.e., real time DSA for coordinate preventive control actions) as well as post-contingency dynamic data (i.e., post-contingency Dynamic Vulnerability Assessment—DVA—for triggering corrective control actions). In the particular case of post-contingency DVA, it is noteworthy that PMUs are able to provide time-synchronized phasor data, which contain valuable dynamic information that could indicate system vulnerability status and potential collapses [7]. These post-contingency data offer a new framework for system vulnerability assessment that is known as Dynamic Vulnerability Assessment (DVA), which is oriented to coordinating corrective control actions. In this connection, post-contingency DVA requires even a quicker response than pre-contingency DSA, so that AI and data mining techniques are, possibly, the most prominent mathematical tools to be applied for accomplishing this type of real time assessment.
1.2.2 Timescale of Power System Actions and Operations
As mentioned, an important aspect to be considered in vulnerability assessment is the duration of the events involved in the VA timeframe of interest. Due to the complex tasks related to power system operation, which comprise modeling, analysis, simulation, and control actions, the timescale varies from microseconds to several hours [1]. Table 1.1 presents some power system actions and operations and their corresponding timeframes. Most of this book tackles the Dynamic Vulnerability Assessment (DVA) problem, focusing on post-contingency short-term phenomena, which develop in a timeframe of 15 to 20 seconds after a contingency occurs. This time window includes so-called short-term stability phenomena, which comprise transient stability, short-term voltage stability, oscillatory stability, and short-term frequency stability; and also, the possible overloads provoked by a change of system topology (these are the power system symptoms of stress).
Table 1.1 Actions and operations within the power system [1]
 |
Cascading events are the mechanism whereby failures propagate within a power system, thus leading the system to a possible collapse [14]. These events are usually caused by the conventional system protection schemes triggering in response to one or more symptoms of stress. These phenomena typically occur within timeframes between some milliseconds and several seconds, which means that a complete cascading event usually takes place in timescales from seconds up to hours. Therefore, the DVA timeframe definition specified in most of this book (i.e., 15 s to 20 s) matches the period in which an N-1 critical contingency might drive the system to further undesirable events (i.e., N-2 contingencies), which could be considered as the beginning of a cascading event.
A summary of some of the major blackouts registered in the last years is presented in Table 1.2. Several of the vulnerability assessment methodologies that will be presented in this book take a supervisory role whose response should be in the order of a few milliseconds to a few seconds. The use of monitoring methods such as the ones presented in this book, being capable of predicting the risk of initiating cascading events and whose response is in the order of seconds, might prevent the future occurrence of collapses such as those depicted in Table 1.2, whose total evolution is in the order of seconds to minutes.
Table 1.2 Grid blackouts registered around the world [14–16]
| Place | Date | Cascade duration | Disconnected customers | Disconnected power |
| Northwestern America | 10/08/1996 | 6 min | 7.5 millions | 30 GW |
| Northeastern America | 14/08/2003 | 1 h | 50 millions | 62 GW |
| Southern Sweden and eastern Denmark | 23/09/2003 | 5 min | 4 millions | 6.6 GW |
| Italy | 28/09/2003 | 24 min | 56 millions | 24 GW |
| Ecuador | 01/03/2003 | 20 s | 3 millions | 1.2 GW |
1.3 Power System Vulnerability Symptoms
System vulnerability is characterized by four different symptoms of system stress, namely angle instability, voltage instability, frequency instability, and overloads [5].
Thus, most of the phenomena tackled throughout this book, based on the previously defined VA timeframe, comprise four short-term stability phenomena and post-contingency overloads. These phenomena include: transient stability, oscillatory stability, short-term voltage stability, short-term frequency stability, and post-contingency overloads initiated by topological modifications and power injection changes that follow an N-1 contingency.
1.3.1 Rotor Angle Stability
Rotor angle stability refers to the ability of synchronous machines of an interconnected power system to remain in synchronism after being subjected to a disturbance [17].
This type of stability depends on the ability to maintain or restore equilibrium between electromagnetic torque and mechanical torque of each synchronous machine in the system [17]. The electromagnetic torque of a synchronous machine, after a perturbation, can be resolved into two components: the “synchronizing torque” (in phase with rotor angle deviation—Δδ), and the “damping torque” (in phase with the speed deviation—Δω), as shown by (1.1) [18].
where TSΔδ is the synchronizing torque, TS being the synchronizing torque coefficient, and TDΔω is the damping torque, TD being the damping torque coefficient.
Instability in power systems is the result of a lack of one or both torque components: lack of sufficient synchronizing torque results in aperiodic or non-oscillatory instability (which characterizes transient stability phenomenon), whereas lack of damping torque results in oscillatory instability [17].
1.3.1.1 Transient Stability
Transient stability (TS) is a type of rotor angle stability that occurs when the system is subjected to a severe disturbance (e.g., a short circuit on a transmission line). The timeframe of interest in this phenomenon is usually 3–5 seconds following the disturbance [17]. This type of instability is usually characterized by a lack of synchronizing torque.
1.3.1.2 Oscillatory Stability
The rotor angle stability problem involves the study of the electromechanical oscillations inherent in power systems. Oscillatory instability occurs when there is lack of damping torque [17].
Oscillation problems may be either local or global in nature [18]. Local problems (local mode oscillations) are associated with oscillations among the rotors of a few generators close to each other. These oscillations have frequencies in the range of 0.7 to 2.0 Hz. Global problems (inter-area mode oscillations) are caused by interactions among large groups of generators. These oscillations have frequencies in the range of 0.1 to 0.7 Hz [18].
There are other two types of oscillatory problems caused by controllers of different system components (control modes), or by the turbine-generator shaft system rotational components (torsional modes) [18]. These types of oscillations present a large associated range of frequencies.
Modal analysis [18] is the most commonly used tool to analyze oscillations in a power system. It consists on the determination of the oscillatory modes and the analysis of their corresponding complex modal frequencies (i.e., the mode eigenvalues: ![]() ). Oscillatory stability is satisfied when all the modes present a positive damping. The frequency and damping of the oscillation can be determined from the eigenvalue as follows:
). Oscillatory stability is satisfied when all the modes present a positive damping. The frequency and damping of the oscillation can be determined from the eigenvalue as follows:
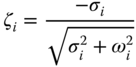
where fi and ζi are the oscillation frequency and the damping ratio of i-th mode, respectively.
1.3.2 Short-Term Voltage Stability
Voltage stability (VS) refers to the ability of a power system to maintain steady voltages at all buses in the system after being subjected to a disturbance. Short-term voltage stability involves the dynamics of fast acting load components such as induction motors, controlled loads, and HVDC converters. The timeframe of interest is in the order of several seconds. Load dynamic modeling is often essential. Short circuits near loads could cause relevant effects in this type of stability [17].
1.3.3 Short-Term Frequency Stability
Frequency stability (FS) refers to the ability of a power system to maintain a steady frequency following a severe system upset resulting in a significant imbalance between generation and load.
Short-term frequency instability is characterized by the formation of an under-generated area with insufficient under-frequency load shedding such that frequency decays rapidly causing the area blackout within a few seconds [17]. On the other hand, when a large amount of load is disconnected, an over-generated area might be formed. In these cases, over-frequency issues might provoke the uncontrolled outage of generation units.
1.3.4 Post-Contingency Overloads
Power flows through system branches can vary after a contingency because a disturbance modifies the grid topology. High electric currents can provoke overloads, and this could trigger protection systems that may separate elements from the system and increase the system vulnerability problem [9]. So, a system may be stable following a contingency, yet insecure due to post-fault system conditions resulting in equipment overloads [17].
In this book, the possible overloads that should be controlled within few seconds are tackled. This type of overload commonly corresponds to special series equipment which presents fast overload control requirements (e.g., electronic devices). On the other hand, equipment that presents slow overload control requirements (i.e., minutes or hours) would permit an on-line assessment via contingency analysis as part of SCADA/EMS applications. In these cases, a quick vulnerability assessment might not be required.
Power system series equipment presents different overload timeframes due to the variety of particular features such as physical limits, thermal capability, and stability constraints, among others. For instance, AC transmission line overload is usually specified by three types of limits: thermal, angle stability, and voltage, from which the temperature commonly does not rise so fast to reach the maximum designed limit. However, angle stability and voltage limits might be quickly reached after a contingency [19].
The physical limits present particular interest in some series electronic equipment because of the special care required for the semiconductor devices of the power converters of HVDCs, FACTS devices, and photovoltaic or wind facilities. In these types of equipment, a quick assessment of possible overloads has relevant importance [19].
1.4 Synchronized Phasor Measurement Technology
1.4.1 Phasor Representation of Sinusoids
A phasor or phase vector constitutes the most commonly applied analytic representation of steady state sinusoidal waveforms of fundamental power frequency. Phasors are used as the basic mathematical tool of AC circuit analysis [20].
A pure sinusoidal equation given by:
where ω is the signal angular frequency in radians per second, φ is the phase angle in radians, and Xm is the peak amplitude of the signal; this can also be written as (1.5) based on Euler's formula [21].
The factor ejωt of (1.5) can be suppressed from this equation when considering that the frequency ω is a constant parameter in steady state. Under this assumption, (1.5) can be simply represented by a complex number ![]() rotating at the angular speed ω, known as its phasor representation or simply phasor, as shown by (1.6) [21].
rotating at the angular speed ω, known as its phasor representation or simply phasor, as shown by (1.6) [21].
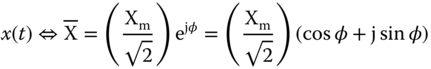
where ![]() is the RMS (root mean square) signal value.
is the RMS (root mean square) signal value.
Figure 1.2 illustrates the phasor representation of a pure sinusoidal equation given by (1.4).

Figure 1.2 Phasor representation of sinusoids: (a) sinusoidal function, (b) phasor representation.
1.4.2 Synchronized Phasors
A synchronized phasor or synchrophasor is defined by [22] as “a phasor calculated from data samples using a standard time signal as the reference for the measurement.”
The synchronized phasors are angularly referenced to a cosine wave at nominal system frequency synchronized to Coordinated Universal Time (UTC, according to the French language). The phase angle φ is defined to be 0° when the maximum of the function x(t) (1.4) occurs at the UTC second rollover (1 pulse per second (PPS) time signal), and -90° when the positive zero crossing occurs at the UTC second rollover [22, 23]. This fact means that synchronized phasors from remote sites have a defined common phase relationship [22].
The synchronizing signal must have uninterrupted and continuous availability and it has to offer easy access to every place where the electrical variables are measured. Additionally, enough accuracy has to be guaranteed in order to accomplish the maximum error requirements (Total Vector Error (TVE)). Thus, the most used synchronizing source is the Global Positioning System (GPS) based on the 1-PPS synchronizing signal, with a maximum error of 1 µs [22].
The concept of TVE and related compliance tests are expanded in [23]. In addition, the definition of frequency and the rate of change of frequency error limits, for both steady state and dynamic conditions, is also considered in [23].
1.4.3 Phasor Measurement Units (PMUs)
Phasor Measurement Units are devices that allow estimation of the synchrophasors of AC voltage and current sinusoidal waves. In order to calculate a synchrophasor, a PMU needs to read the electrical wave x(t) as well as a reference cosine wave synchronized to UTC.
For calculating a synchrophasor, a PMU uses a phasor estimation algorithm. These algorithms employ N samples in a specific time period for carrying out the phasor estimation. The most commonly applied algorithm is the Discrete Fourier Transform (DFT) [21].
Their high accuracy and response speed and their time synchronization ability make PMUs appropriate for wide area monitoring in steady and dynamic states, as well as for control and protection applications [2]. Figure 1.3 schematizes the basic structure of a PMU.
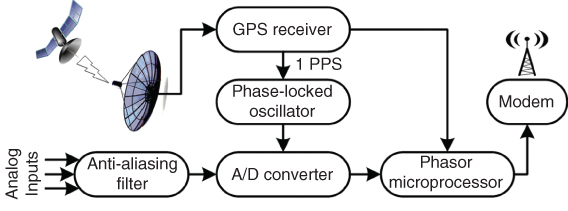
Figure 1.3 PMU basic structure [21].
1.4.4 Discrete Fourier Transform and Phasor Calculation
The DFT is a method for computing the Fourier transform X(f) of a few samples belonging to a specific signal x(t). In this case, the Fourier transform is calculated in discrete intervals in the frequency domain when the signal is sampled in discrete points in the time domain.
Consider a periodic function x(t) with period T0, and N samples: ![]() , where ΔT is the sampling interval; then
, where ΔT is the sampling interval; then ![]() . Under these considerations, the Fourier transform X(f) has only N different values corresponding to the frequencies
. Under these considerations, the Fourier transform X(f) has only N different values corresponding to the frequencies ![]() , where n is between 0 and N/2 (if N is an even number). The following equation represents the DFT definition considering N samples and ΔT sampling intervals [21].
, where n is between 0 and N/2 (if N is an even number). The following equation represents the DFT definition considering N samples and ΔT sampling intervals [21].
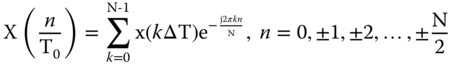
The DFT is a useful tool for Fourier series spectral analysis. The Fourier series coefficients of a periodic function can be computed from the DFT of the sampled data by dividing the DFT corresponding to the frequency of interest by N. Since each frequency always appears in two positions (± n), the coefficients of the Fourier series are:
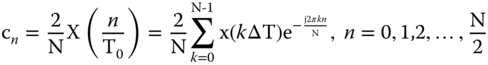
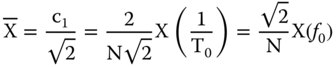
Considering that a phasor represents a pure sinusoidal function, it is necessary to extract the fundamental frequency component f0 (coefficient c1 of the Fourier series) of the sampled signal [21]. Thus, the phasor representation is:

1.4.5 Wide Area Monitoring Systems
Wide area monitoring systems (WAMS) permit access to distributed phasor measurements throughout the network by means of adequately located PMUs. For this purpose, in addition to PMUs, advanced signal processing algorithms, specialized communication systems, and a real time dynamic infrastructure are required. This technology includes applications related to the real time supervision and control of electric power systems. WAMS are mainly composed of PMUs, Phasor Data Concentrators (PDCs), and communication systems [10, 24].
WAMS provide direct voltage and current phasor measurements with updating periods of few milliseconds, ideally avoiding the necessity for state estimators. The fast updating intervals also allow the monitoring of power system dynamic behavior and offer the possibility of detecting potential insecure conditions that might lead the systems to blackouts [12].
It is possible to distinguish three different applications for wide area measurement systems:
- Wide area monitoring systems (WAMS)
- Wide area control systems (WACS)
- Wide area protection systems (WAPS)
Several monitoring, control, and protection applications are depicted in Figure 1.4. These applications are ranked depending on different operational levels. It is possible to note that synchronized phasor measurement technology corresponds to the fourth operational level, which is established by the so-called Wide area monitoring, protection, and control systems (WAMPAC) [2].

Figure 1.4 Wide area monitoring, protection and control systems [2].
The overall WAMPAC scheme comprises several interrelated stages, each one having embedded applications to perform different relevant tasks in order to achieve the objective of allowing a “self-healing grid,” as illustrated in Figure 1.5.
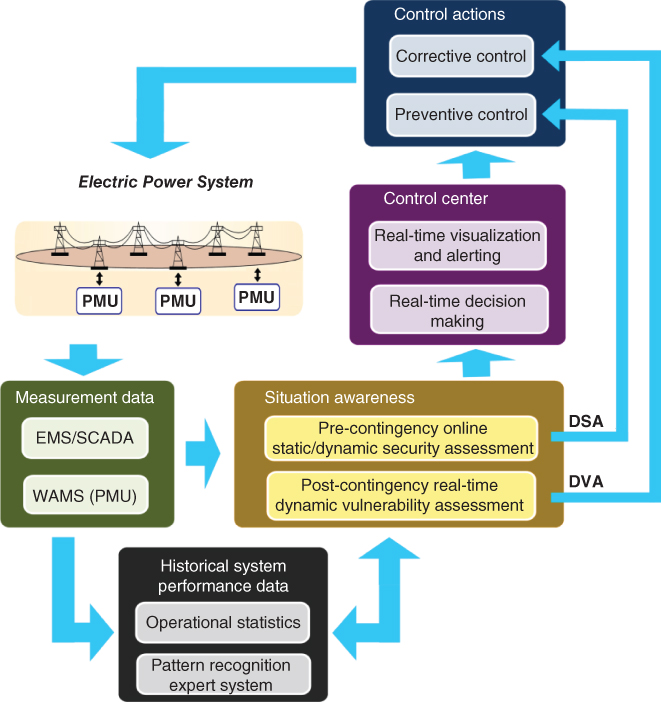
Figure 1.5 Scheme for integrated self-healing functionalities to support secure system operation in real time.
Measurements of the actual system condition from PMU/SCADA-EMS are used to perform the following applications:
- i. Update of system behavior knowledge database (i.e., operational statistics) and execution of pattern recognition routines, which supports the Dynamic Security Assessment (DSA) and real time Dynamic Vulnerability Assessment (DVA) tasks.
- ii. DSA in normal operating states to determine whether or not the system security level is to be degraded in future time when considering a selected set of credible contingencies.
- iii. Real time DVA to determine the actual system security level as well as its tendency to change its conditions to a critical state in post-disturbance immediate time.
The information obtained from DSA and DVA is passed to the control center (for real time monitoring and decision making) and potentially directly to the control systems as well.
Several chapters of this book focus on presenting methodologies capable of performing post-contingency real time DVA based on the development and application of pattern recognition expert systems in combination with the evaluation of various performance indices.
1.4.6 WAMPAC Communication Time Delay
In order to perform global control actions in a timely manner, the WAMPAC scheme must act prior to the tripping of local protection systems. This fact highlights the importance of getting a quick response from all the process involved in the WAMPAC structure, which comprise: the time delay for phasor measurement, fiber-optic communications, PDC throughput including wait time for slowly arriving packets, transfer trip, and circuit breaker tripping or closing [24].
In this connection, it is highly important to consider the total WAMPAC communication time delay in order to be sure the vulnerability assessment will orient timely control actions.
This time delay depends on the complexity of each power system, and it has to be determined prior the development of the WAMPAC scheme. For instance, Table 1.3 presents some reference values that orient a typical WAMPAC communication time delay [24].
Table 1.3 Time delay of a WAMPAC scheme per process [24]
| Process | Time delay in 60-Hz cycles | Time delay (ms) |
| PMU measurement | 3 | 50 |
| Fiber-optic communications | 2 | 33 |
| PDC throughput | 2 | 33 |
| Transfer trip | 1 | 17 |
| Circuit breaker | 2–5 | 33–83 |
| Total WAMPAC time delay | 10–13 | 167–217 |
1.5 The Fundamental Role of WAMS in Dynamic Vulnerability Assessment
As described in the previous section, PMUs are able to provide time-synchronized phasor data with delays of less than 200 ms, which contain valuable dynamic information that could indicate, in real time, the system vulnerability status and potential collapses [7]. These post-contingency data are fundamental to developing methodologies capable of assessing dynamic vulnerability in real time. The huge potential of the dynamic information immersed in PMU data actually allows the assessment of both tasks involved in the concept of vulnerability: (i) the system security level (static and dynamic security), and (ii) the tendency to change the system conditions to a critical state that is called the “Verge of Collapse State.”
For instance, synchronized measurements obtained from Wide Area Monitoring Systems (WAMS) can be used to detect a possible system separation, to monitor the voltage and frequency of critical nodes, or to check power flows in important branches in order to analyze congestion. PMU data could also be used to analyze poorly-damped power system oscillations [25], to carry out transient stability assessment (TSA) [26, 27], or to develop closed loop control schemes in order to improve system stability [12].
A characteristic ellipsoid (CELL) method to monitor the power system dynamic behavior and provide wide area situational awareness using PMU data is presented in [13]. A logic-based method to identify a contingency severity and to assess voltage stability from PMU data is proposed in [28]. These approaches permit the assessment of post-contingency system security level, but they do not consider the tendency of the system to change its conditions to a critical state.
Some methods to perform real time TSA are summarized in [26]. From these methods, Emergency Single Machine Equivalent (E-SIME) seems attractive for real time applications. This method uses the multi-machine rotor angles (δ) and the system accelerating power (Pa) to establish a One Machine Infinite Bus equivalent (OMIB) in order to predict transient instability, using data obtained from PMUs. In this approach, the calculus of the mechanical variables and the prediction of the Pa–δ curves provoke time delays and accuracy problems. In this same context, [26] presents a method for TSA based on post-contingency area-based center-of-inertia (COI) referred rotor angles estimation from PMU measurements. To this aim, several off-line tasks were addressed to deal with issues regarding the selection of PMU monitoring locations, reduction of data volume, and definition, training, and tuning of a suitable support vector regressor (SVR).
A scheme based on phase-space visualization, which allows finding patterns that could indicate a possible collapse, is presented in [29]. This method permits monitoring of phase-space curves of critical variables and providing early warning, but it needs to draw images in order to find the similarities among them, which makes an automatic response difficult.
A technique for prediction of the transient stability status of a power system following a large disturbance such as a fault, based on synchronously measured samples of the magnitudes of voltage phasors at major generation centers, is presented in [30]. The voltage samples are taken immediately after a fault is cleared and used as inputs to a binary classifier based on a support vector machine (SVM) to identify the transient stability status. This approach considers that there exist PMUs installed in all generators' terminal buses, and does not contemplate any feature extraction technique in order to reduce the amount of classifier input data; this increases the dimensionality of the problem and might provoke mistakes and delays in the training stage.
A data mining-based framework for performing power system vulnerability assessment and predicting system instabilities that may lead to possible system cascading failure is presented in [31]. Based on Monte Carlo methods, power system contingency data of dynamic and steady state simulations are generated. These data are then analyzed via advanced data mining methods, based on a combination between Graph Theory, Local Correlation Network Pattern (LCNP) and Kernel Based Classification, to find the most relevant system information or patterns with respect to system instability; this is then used for achieving instability prediction based on PMU measurements as well as generator variable measurements. This method suggests using the first 10 or 20 system variables (including generator and system variables) with the greatest chi-square (obtained from LCNP) as the features of the prediction model. This method presents the drawbacks of using too many variables, including those belonging to generators that are not easily to be available (such as rotor angle, speed, mechanical power, etc.) Additionally, results of classification accuracy show a recall (i.e., dependability) of around 93%, which might be improved by using a different data analysis technique.
A vulnerability assessment method for quickly assessing the multi-area power system post-contingency vulnerability status, mainly as regards rotor angle stability, is developed in [32]. This method uses PMU data to compute Wide Area Severity Indices (WASI), as an extension of the severity indices firstly presented in [33]. These WASI are calculated in the frequency domain through applying the Short Time Fourier Transform (STFT) to data obtained from PMUs located in specific system buses, determined by a coherency criterion defined in [34] and improved in [35]. A systematic scheme for rapidly classifying the stability status resulted from WASI using fuzzy rule-based classifiers is presented in [36]. This classifier uses large-size decision trees (DTs) to generate initial accurate classification boundaries for decision making as early as 1 or 2 s after fault clearing. A WASI-based model-predictive framework for determining fast catastrophe precursors in a bulk power system has been presented in [37]. These fast catastrophe predictors use random-forest (RF) learning in order to increase the classification accuracy, showing excellent performance as regards typical DTs. In [38], a comparison between several data mining classifiers, such as artificial neural network (ANN), SVM, DT, Fuzzy DT, Fuzzy ID3 (Iterative Dichotomiser 3), and RF is performed; from this, the RF-based predictor is the only one to achieve more than 99.0% accuracy based on WASI. However, the RF has poor transparency characteristics and might exhibit over-fitting problems. In this connection, a more transparent predictor is suggested to be used in [38] at the expense of loss of accuracy. WASI offer a novel concept in power system real time VA that reasonably permits estimating the tendency of the system to change its conditions to a critical state. Nevertheless, these indices present the problem of showing a considerable large overlapping zone. For instance, test results in [37] conclude that “75% of stable cases verify the relationship FastWASI300ms < −2.5, while for 75% unstable cases, FastWASI300ms > −2.5.” This fact denotes that the overlapping zone is formed by 25% of stable cases belonging to the region of the unstable cases and vice versa. This large overlapping range is the main reason for classification difficulties.
A data-mining-based approach for predicting power system post-contingency vulnerability status in real time is proposed in [10]. To this aim, system dynamic vulnerability regions (DVRs) are first determined by applying singular value decomposition, by means of empirical orthogonal functions (EOFs), to a post-contingency database obtained from Phasor Measurement Units (PMUs) adequately located throughout the system. In this way, the obtained pattern vectors (EOF scores) allow mapping the DVRs within the coordinate system formed by the set of EOFs, which permits revealing the main patterns buried in the collected PMU signals. The database along with the DVRs enable the definition, training, and identification of a support vector classifier (SVC), which is employed to predict the post-contingency vulnerability status as regards three short-term stability phenomena, that is: transient stability, short-term voltage stability, and short-term frequency stability (TVFS). Enhanced procedures for feature extraction and selection as well as heuristic optimization-based parameter identification are proposed to ensure a robust performance of the SVC. This method allows the assessment of system vulnerability for three different phenomena, estimating the system tendency of changing its conditions to the Verge of Collapse State, and overcomes the drawback of large overlapping caused by applying other types of signal processing tools.
The potential applications for DVA make PMUs fundamental in the basic architecture of a self-healing grid. However, despite the valuable dynamic data obtained from PMUs, they are not able to give any information about system health by themselves. So, it is necessary to develop mathematical tools capable of quickly analyzing the data in order to accurately assess dynamic vulnerability in real time. This is a very novel research area in which further investigation is needed to improve tools and methods, so that in the future, Dynamic Vulnerability Assessment would be performed with confidence as an important element of a self-healing grid structure.
An additional aspect to be considered is PMU data quality. In fact, synchronized measurements will be used as input to control and protection systems after the DVA has determined the necessity of performing corrective control actions; therefore, it is fundamental to have enough confidence about data obtained from the PMUs. In this connection, it is necessary to carry out an evaluation of the performance of PMUs under dynamic conditions for previous application in DVA and further control schemes. This is because system perturbations provoke different transients that cause current and voltage wave distortions, such as peaks, sags, frequency variations, oscillations, harmonics, DC components, and so on, which affect the accuracy of synchronized measurements [21]. In this connection, prior to the development and enforcement of dynamic applications, it is necessary to evaluate the performance of PMUs under possible dynamic conditions, which might be used in order to specify the minimum requirements of the devices. This need is essential in order to guarantee the PMUs satisfactorily fulfill the guidelines suggested by the IEEE C37.118.1-2011 standard [23] to assure dynamic compliances, depending on the required application. For instance, the PMUs have to accomplish one of the two performance class filters: P class or M class. P class is for applications requiring fast response whereas M class better adjusts for applications of greater precision. So, depending on the specific application, a different combination of errors from the magnitude and phase angle measurements might be specified in order to get the desired TVE [23].
In summary, based on the presented literature review, WAMS has been determined as the fundamental source of data useful for being the input to adequate mathematical tools capable of assessing vulnerability in real time. To accomplish this function, some basic requirements are necessary, such as the implementation of PMUs with confident enough phasor estimation algorithms, robust communication and information technology systems and, mainly, the development and application of proper mathematical methodologies capable of analyzing huge volumes of data in real time, in order to give confident early warning indicators as soon as the different vulnerability phenomena evolve in real time.
1.6 Concluding Remarks
The lack of investment, the use of congested transmission lines, and other technical reasons, such as environmental constraints, have been dangerously pushing Bulk Power Systems close to their physical limits. Under these conditions, certain sudden perturbations can cause cascading events that may lead to system blackouts. In this connection, it is crucial to ensure system security, so the development of protection systems that allow guaranteeing of service continuity is required. Nevertheless, these remedial action schemes are usually set to operate when specific pre-established operational conditions are reached, so they are unable to work under unconsidered contingencies that might entail cascading events. Thus, the control of the system and the protection triggering should be adjusted depending on the real time progress of a given event, emphasizing the need to develop a “self-healing grid.” Real time Dynamic Vulnerability Assessment (DVA) is a fundamental task within this self-healing grid structure, and PMU-based methods show a huge potential for performing this smart grid application, since they have the capability to detect the necessity of performing the remedial action. DVA has to be carried out in order to trigger adequate corrective control actions that mitigate the consequences of the disturbances and reduce the possibility of system blackouts. This task has opened a very novel research area, where further investigation is needed.
References
- 1 M. Amin, “Toward self-healing infrastructure systems”, Electric Power Research Institute (EPRI), IEEE Computer, vol. 33, no. 8, pp. 44–53, 2000.
- 2 C. Martinez, M. Parashar, J. Dyer, and J. Coroas, “Phasor data requirements for real time wide-area monitoring, control and protection applications”, CERTS/EPG, White Paper – Final Draft, for: EIPP – Real Time Task Team, vol. 26, pp. 8, January, 2005.
- 3 U. Kerin, G. Bizjak, E. Lerch, O. Ruhle, and R. Krebs, “Faster than real time: Dynamic security assessment for foresighted control actions”, 2009 IEEE Bucharest Power Tech Conference, June 28th–July 2nd, Bucharest, Romania.
- 4 J. D. McCalley, and Fu Weihui, “Reliability of special protection systems”, IEEE Transactions on Power Systems, IEEE Power & Energy Society, vol. 14, no 4, pp. 1400–1406, November 1999.
- 5 D. McGillis, K. El-Arroudi, R. Brearley, and G. Joos, “The process of system collapse based on areas of vulnerability”, Large Engineering Systems Conference on Power Engineering, pp. 35–40, Halifax, NS, July 2006.
- 6 I. Dobson, P. Zhang, et al, “Initial review of methods for cascading failure analysis in electric power transmission systems”, IEEE PES CAMS Task Force on Understanding, Prediction, Mitigation and Restoration of Cascading Failures, IEEE Power Engineering Society General Meeting, Pittsburgh, PA USA July 2008.
- 7 Z. Huang, P. Zhang, et al, “Vulnerability assessment for cascading failures in electric power systems”, Task Force on Understanding, Prediction, Mitigation and Restoration of Cascading Failures, IEEE PES Computer and Analytical Methods Subcommittee, IEEE Power and Energy Society Power Systems Conference and Exposition 2009, Seattle, WA.
- 8 A. Fouad, Qin Zhou, and V. Vittal, “System vulnerability as a concept to assess power system dynamic security”, IEEE Transactions on Power Systems, vol. 9, no 2, p. 1009–1015, May 1994.
- 9 J. Gimenez, and P. Mercado, “Online inference of the dynamic security level of power systems using fuzzy techniques”, IEEE Transactions on Power Systems, vol. 22, no. 2, pp. 717–726, May 2007.
- 10 J. Cepeda, J. Rueda, G. Colomé, and I. Erlich, “Data-mining-based approach for predicting the power system post-contingency dynamic vulnerability status”, International Transactions on Electrical Energy Systems, vol. 25, issue 10, pp. 2515–2546, October 2015.
- 11 Chen-Ching Liu, Juhwan Jung, Gerald T. Heydt, Vijay Vittal, and Arun G. Phadke, “The strategic power infrastructure defense (spid) system, a conceptual design”, IEEE Control System Magazine, vol. 20, no 4, pp. 40–52, August 2000.
- 12 S. C. Savulescu, et al, Real-Time Stability Assessment in Modern Power System Control Centers, IEEE Press Series on Power Engineering, Mohamed E. El-Hawary, Series Editor, a John Wiley & Sons, Inc., Publication, 2009.
- 13 Yuri Makarov, Carl Miller, Tony Nguen, and Jian Ma, “Characteristic ellipsoid method for monitoring power system dynamic behavior using phasor measurements”, VII Symposium on Bulk Power System Dynamics and Control, Charleston, USA, August, 2007.
- 14 I. Dobson, B. Carreras, V. Lynch, and D. Newman, “Complex systems analysis of series of blackouts: cascading failure, critical points, and self-organization”, Chaos: An Interdisciplinary Journal of Nonlinear Science, 2007, vol. 17, no 2, p. 026103, June 2007.
- 15 G. Andersson, P. Donalek, R. Farmer, and I. Kamwa, “Causes of the 2003 major grid blackouts in North America and Europe, and recommended means to improve system dynamic performance”, IEEE Transactions on Power Systems, vol. 20, no. 4, pp. 1922–1928, November 2005.
- 16 V. Venkatasubramanian, and Yuan Li, “Analysis of 1996 western American electric blackouts”, Bulk Power System Dynamics and Control – VI, Italy, August 2004, pp. 685–721.
- 17 P. Kundur, J. Paserba, V. Ajjarapu, et al, “Definition and classification of power system stability”, IEEE/CIGRE Joint Task Force on Stability: Terms and Definitions. IEEE Transactions on Power Systems, vol. 19, no. 3, pp. 1387–1401, August 2004.
- 18 P. Kundur, Power System Stability and Control, McGraw-Hill, Inc., Copyright 1994.
- 19 J. Cepeda, D. Ramirez, and G. Colome, “Probabilistic-based overload estimation for real-time smart grid vulnerability assessment”, Proc. Sixth IEEE/PES Transmission and Distribution: Latin America Conference and Exposition (T&D-LA), Montevideo, Uruguay, September 2012.
- 20 A. Phadke, “Synchronized phasor measurements in power systems”, IEEE Computer Applications in Power, vol. 6, no. 2, pp.10–15, April 1993.
- 21 A. Phadke, and J. Thorp, Synchronized Phasor Measurements and Their Applications, Virginia Polytechnic Institute and State University, Springer Science + Business Media, 2008, ISBN 978-0-387-76535-8.
- 22 IEEE Power Engineering Society, “IEEE standard for synchrophasors for power systems”, IEEE Std. C37.118-2005, March 2006.
- 23 IEEE Power Engineering Society, “IEEE standard for synchrophasors for power systems”, IEEE Std. C37.118.1-2011, December 2011.
- 24 C. W. Taylor, D. C. Erickson, K. E Martin, R. E. Wilson, and V. Venkatasubramanian, “WACS – wide-area stability and voltage control system: R&D and online demonstration”, Proceedings of the IEEE, vol. 93, no. 5, May 2005.
- 25 J. Cepeda, G. Argüello, P. Verdugo, A. De La Torre, “Real-time monitoring of steady-state and oscillatory stability phenomena in the ecuadorian power system”, IEEE Transmission and Distribution Latin America (T&D-LA) 2014, Medellín, Colombia, Septiembre 2014.
- 26 J. Cepeda, J. Rueda, G. Colomé, D. Echeverría, “Real-time transient stability assessment based on centre-of-inertia estimation from PMU measurements”, IET Generation, Transmission & Distribution, vol. 8, issue 8, pp. 1363-1376, August, 2014.
- 27 D. Echeverría, J. Cepeda, G. Colome, “Critical Machine Identification for Power Systems Transient Stability Problems using Data Mining”, IEEE Transmission & Distribution Latin America (T&D-LA) 2014, Medellín, Colombia, Septiembre 2014.
- 28 A. Tiwari, and V. Ajjarapu, “Event Identification and Contingency Assessment for Voltage Stability via PMU”, 39th North American Power Symposium, pp. 413–420, Las Cruces, October 2007.
- 29 Kai Sun, and S.T. Lee, “Power system security pattern recognition based on phase space visualization”, Third International Conf. on Electric Utility Deregulation and Restructuring and Power Technologies, Nanjuing pp. 964–969, April 2008.
- 30 F. Gomez, Prediction and Control of Transient Instability Using Wide Area Phasor Measurements, Doctoral Thesis, University of Manitoba, September 2011.
- 31 P. Zhang, Y. D. Zhao, et al, Program on Technology Innovation: Application of Data Mining Method to Vulnerability Assessment, Electric Power Research Institute (EPRI), Final Report, July 2007.
- 32 I. Kamwa, J. Beland, and D. Mcnabb, “PMU-based vulnerability assessment using wide-area severity indices and tracking modal analysis”, IEEE Power Systems Conference and Exposition, pp. 139–149, Atlanta, November, 2006.
- 33 I. Kamwa, R. Grondin, and L. Loud, “Time-varying contingency screening for dynamic security assessment using intelligent-systems techniques,” IEEE Transactions on Power Systems, vol. 16, no. 3, pp. 526–536, Aug. 2001.
- 34 I. Kamwa, A. K. Pradham, and G. Joos, “Automatic segmentation of large power systems into fuzzy coherent areas for dynamic vulnerability assessment”, IEEE Transactions on Power Systems, vol. 22, no. 4, pp. 1974–1985, Nov. 2007.
- 35 I. Kamwa, A. K. Pradham, G. Joos, and S. R. Samantaray, “Fuzzy partitioning of a real power system for dynamic vulnerability assessment”, IEEE Transactions on Power Systems, vol. 24, no. 3, pp. 1356–1365, August 2009.
- 36 I. Kamwa, S. R. Samantaray, and G. Joos, “Development of rule-based classifiers for rapid stability assessment of wide-area post-disturbance records”, IEEE Transactions on Power Systems, vol.24, no. 1, pp.258–270, Feb. 2009.
- 37 I. Kamwa, S. R. Samantaray, and G. Joos, “Catastrophe predictors from ensemble decision-tree learning of wide-area severity indices”, IEEE Transactions on Smart Grid, vol.1, no.2, pp. 144–158, Sept. 2010.
- 38 I. Kamwa, S. R. Samantaray, and G. Joos, “On the accuracy versus transparency trade-off of data-mining models for fast-response PMU-based catastrophe predictors”, IEEE Transactions on Smart Grid, vol. 3, no. 1, pp. 152–161, March 2012.