
Measurement by application
The creation of the application context presents an opportunity to review the way performance monitoring and charge back mechanisms are performed. This chapter explains the improvements in the process, and demonstrates how to use them:
7.1 Overview
When an IBM Customer Information Control System (CICS) Transaction Server (CICS TS) task enters an application through one of the application’s entry points, application context is associated with the task, as described in 4.2, “The components of a CICS TS application” on page 53. This task application context information is available in the performance records written to System Management Facilities (SMF) as part of the CICS Monitoring Facility (CMF).
Customers can use the application context to assist with charge back accountancy, performance monitoring, capacity planning, and problem determination. The operation field of the application context can provide a different perspective about which parts of the customer application is running, and which resources are being used.
With the CMF enabled in a CICS TS region, a performance record can be written to record how many resources a single task has consumed. A small subset of resource usage data that is recorded in a performance record is included in the following list:
•Processor time
•Virtual storage usage
•File input/output (I/O) counts
•Database access
Armed with this wealth of statistical data, an information technology (IT) department can calculate how many processor seconds the payroll department has used in a month, and charge them to a percentage of the IT budget. The performance monitoring staff can use the data to ensure that CICS TS is running efficiently for the needs of the application, and the capacity planners can plan upgrades to the hardware to meet future needs.
Traditionally, one or more of the following fields are used to assign task resource usage to a department or customer:
•Transaction ID
•Initial program ID (for example, the first program run in a transaction)
•Terminal ID
•User ID
•Region APPLID
Depending on how the application has been structured, it can be difficult or impossible to determine which business function a transaction is performing, and to which department or customer it should be assigned. In a worst-case scenario, a transaction that cannot be assigned could be put into the IT operating expenses.
The application context within the CMF performance record enables an additional method of identifying the function or owner of a task.
7.1.1 The application context within the CICS Monitoring Facility
New data fields have been made available in the CMF performance record:
•Application name
•The major, minor, and micro version numbers of the application
•Platform name
•Operation name
The following sections describe possible uses of the new fields.
Application name
Rather than maintaining a list of payroll transactions for charge back, the reports could be summarized on the application name so that future additions to the transaction IDs used by the application are included automatically.
Major, minor, and micro version numbers
These version numbers could be used to compare the resource consumption of an application before and after enhancements have been applied.
Platform name
The platform name can be used to identify where part of an application ran, rather than
using the CICS TS applid (TOR1, TOR2, AOR3), and therefore avoid the need to maintain applid lists.
using the CICS TS applid (TOR1, TOR2, AOR3), and therefore avoid the need to maintain applid lists.
Operation name
This field could be used to identify the function of a transaction where the traditional summary fields do not give the required granularity.
7.1.2 Problems with traditional chargeback and performance monitoring
The application context can be used to resolve problems using the traditional summary fields that were listed earlier. The following sections describe these problems in more detail.
Transaction ID and initial program
Some business applications, third-party or internal, use the same transaction ID and initial program for all of the distinct business functions. This is especially true when a menu is presented to the user to select an inquiry, update, or delete function. After the user has selected the option, the initial program will perform an EXEC CICS LINK to a second program depending on the function.
However, in the performance record for the task, by default only the transaction ID and initial program is recorded. The CMF can be customized so that it can write additional records on each link, but this dramatically increases the number of performance records that are written.
If separate entry points are created for the inquiry, update, and delete programs, the operation name in the performance record can be used to summarize and group all of the tasks based on function.
Multi-region accounting
When a user’s transaction runs across multiple regions, it can be difficult to correlate the task performance records from the different regions to obtain a true picture of the transaction’s resource consumption. If an entry point is created within the initial region, the resulting application context will flow with the task to the subsequent regions.
The performance record from the task in the subsequent regions contains the application name, version, platform, and operation fields that were set in the initial region. This makes it much easier to assign resource consumption to a business function. This only works if the communications link is multiregion operation (MRO) or Internet Protocol interconnectivity (IPIC).
7.1.3 Pre-requisites to using application context in CICS Monitoring Facility records
To make use of the application context in the CMF performance records, the following elements are required:
•System initialization table (SIT) parameters MN=ON and MNPERF=ON (or enable performance monitoring on your running CICS TS region, for example, CEMT SET MON ON PERF)
•One or more applications installed, enabled, and available on your CICS TS region
•A software product that can process CMF performance records, for example, CICS Performance Analyzer V5.1
7.2 Examples of using the application context in the CICS Monitoring Facility
This section provides you with several examples using the application context with CMF.
7.2.1 Enabling chargeback within the GENAPP application using CICS Performance Analyzer
In Example 7-1, the CICS Performance Analyzer V5.1 example report could be used to calculate the processor resource usage for a series of the business functions.
Example 7-1 CICS Performance Analyzer report
V5R1M0 CICS Performance Analyzer
Performance Summary
SUMM0001 Printed at 13:24:53 1/02/2013 Data from 12:45:26 1/02/2013 to 12:46:22 1/02/2013
Total Total Total
ACApplNm ACOperNm #Tasks User CPU FC Total TS Total
Time Count Count
GeneralInsuranceCustomer addCustomer 18 .0561 18 0
GeneralInsuranceCustomer inquireCustomer 39 .0773 0 0
GeneralInsuranceCustomer 57 .1334 18 0
Total 57 .1334 18 0
Example 7-2 shows the CICS Performance Analyzer V5.1 parameters used to generate the example report.
Example 7-2 CICS PA report
CICSPA IN(SMFIN001),
LINECNT(60),
FORMAT(':','/'),
PRECISION(4),
SUMMARY(OUTPUT(SUMM0001),
EXTERNAL(CPAXW001),
SELECT(PERFORMANCE(
INC(ACAPPLNM(General*)))),
TOTALS(8),
INTERVAL(00:01:00),
FIELDS(ACAPPLNM(ASCEND),
ACOPERNM(ASCEND),
TASKCNT,
CPU(TIME(TOT)),
FCTOTAL(TOT),
TSTOTAL(TOT)))
7.2.2 Monitoring performance of the GENAPP application using CICS Performance Analyzer
In Example 7-3, the following CICS Performance Analyzer V5.1 example report can be used to detect an increase in resource usage when an application is upgraded.
Example 7-3 CICS PA report
V5R1M0 CICS Performance Analyzer
Performance Summary
SUMM0001 Printed at 13:51:51 1/02/2013 Data from 12:45:26 1/02/2013 to 12:46:22 1/02/2013
Avg Avg Avg Avg Avg
ACApplNm ACApplVr ACOperNm #Tasks User CPU SC24UHWM SC31UHWM DB2 Reqs FC Total
Time Count Count Count Count
GeneralInsuranceCustomer 1.0.0 addCustomer 27 .0029 1465 372232 1 1
GeneralInsuranceCustomer 1.0.0 inquireCustomer 56 .0019 1522 271139 1 0
GeneralInsuranceCustomer 1.0.0 83 .0022 1503 304025 1 0
GeneralInsuranceCustomer 1.0.1 addCustomer 18 .0031 1632 394601 1 1
GeneralInsuranceCustomer 1.0.1 inquireCustomer 39 .0020 1634 282194 1 0
GeneralInsuranceCustomer 1.0.1 57 .0023 1633 317691 1 0
GeneralInsuranceCustomer 140 .0023 1556 309589 1 0
Total 140 .0023 1556 309589 1 0
Example 7-4 shows the CICS Performance Analyzer V5.1 parameters used to generate the example report.
Example 7-4 CICS PA report
CICSPA IN(SMFIN001),
LINECNT(60),
FORMAT(':','/'),
PRECISION(4),
SUMMARY(OUTPUT(SUMM0001),
EXTERNAL(CPAXW001),
SELECT(PERFORMANCE(
INC(ACAPPLNM(General*)))),
TOTALS(8),
INTERVAL(00:01:00),
FIELDS(ACAPPLNM(ASCEND),
ACAPPLVR(ASCEND),
ACOPERNM(ASCEND),
TASKCNT,
CPU(TIME(AVE)),
SC24UHWM(AVE),
SC31UHWM(AVE),
DB2REQCT(AVE),
FCTOTAL(AVE)))
7.2.3 Diagnosing problems in GENAPP using CICS Explorer
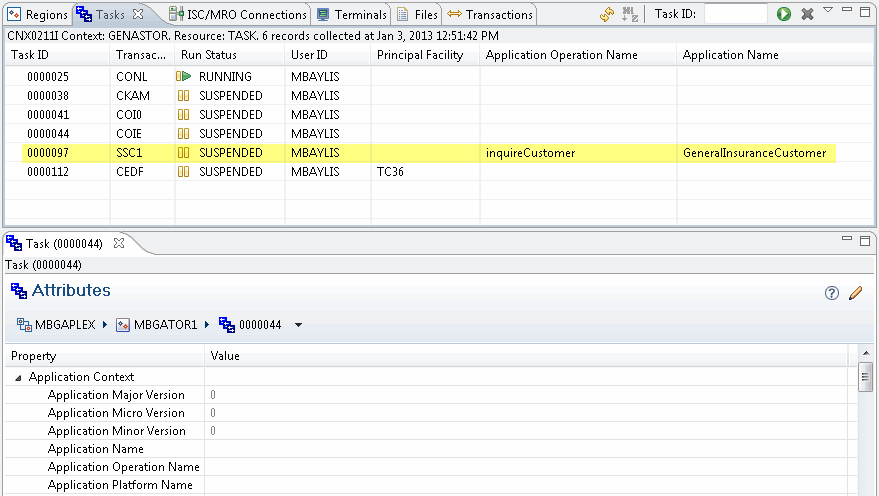
Understanding the purpose of a task that is causing problems in a CICS TS region becomes easier when the task is assigned an application context. Figure 7-1 demonstrates that task 97 is the common GENAPP transaction SSC1, which is suspended. However, because the
task has been assigned an application context, it is easy to determine that it is an inquire customer operation.
task has been assigned an application context, it is easy to determine that it is an inquire customer operation.

Figure 7-1 Suspended Task 97: GENAPP transaction
..................Content has been hidden....................
You can't read the all page of ebook, please click here login for view all page.
